Introduction to Paleoclimatology n n n Snow and


 emerge from")
- Slides: 27
Introduction to Paleoclimatology n n n Snow and Ice Report Snow Photos Significance of Climate Proxies Types of Proxies Limitations and Strengths Ice Cores Selected slides from: www. mun. ca/geog/courses/rwhite/Lec 4. 2_Measuring. Past. Climate. ppt
Snow/Ice Report n n https: //climate. rutgers. edu/snowcover/ https: //nsidc. org/arcticseaicenews/ http: //climate. appstate. edu/Data/Met/EVERNET/Balcony_Col_Wind_Temp. png http: //www. skimountaineer. com/Mtn. Web. Cam s/Rainier. Mtn. Web. Cams. html? size=med&telemetry=true
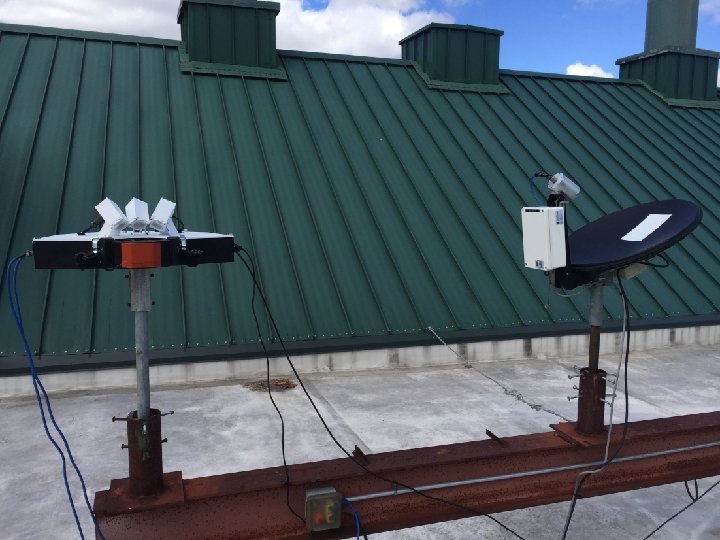
9 December 2017 MRR Summary
0100 – 0200 UTC 9 Dec 2017
0200 – 0300 UTC 9 Dec 2017
0300 – 0400 UTC 9 Dec 2017
0400 – 0500 UTC 9 Dec 2017
0500 – 0600 UTC 9 Dec 2017
1400 – 1600 UTC 9 Dec 2017
1600 – 1700 UTC 9 Dec 2017
0000 – 0200 UTC 10 Dec 2017
0200 – 0300 UTC 10 Dec 2017
Driving Question Ø How and why do scientists reconstruct the climate record prior to the instrument era? © AMS 14
Reconstructing Past Climates: Why and How? Ø Climate reconstruction l l l © AMS Improves our understanding of environmental response to climate variability and climate change Provides perspective on current climate Requires identification of a link between quantitative climate forcing and environmental response 15
What kinds of climate proxies can be used to estimate surface temperatures (last 2000+ years)?
What kinds of climate proxies can be used to estimate surface temperatures (last 2000+ years)? Ø Ø Ø Ø Ø Tree rings Corals Ocean and lake sediments (varves) Cave deposits (speleothems) Ice cores Pollen deposits Packrat middens Glaciers Documentary evidence (historical records, paintings, etc. )
Climate Proxies Ø Which of the climate proxies excites you the most? Why? © AMS 18
How are proxy data used to reconstruct climate? For most proxies, statistical techniques are used to define the relationship between the proxy measurements and the concurrent instrumental records. Ø Then, this relationship is used to reconstruct the past climate from the remaining proxy data. Ø
Steps Involved Collect proxy data Dating the proxy data (e. g. , matching growth rings of trees to calendar year) Ø Calibration – usually, this involves using regression to relate the proxy measurement to know climatic conditions Ø Validation – basically tests the skill of the calibration Ø Reconstruction – once the proxy/climate relationship is established, we again use regression to predict what past climate was like Ø Ø
What are the limitations and strengths of large-scale climate reconstructions? Ø 1. The instrumental record is short (~100 - 150 years at most) Ø 2. The relationship between the proxy data and the climate variable being reconstructed (e. g. , temperature) may have varied over time.
Limitations Ø 3. There is no consensus among scientists as to which statistical methods/formulae are most appropriate for calibrating and validating the models. Ø Thus, different teams of researchers could reach different conclusions when dealing with the same proxy data
Limitations Ø 4. Spatial limitations – collecting proxy data is both time consuming and expensive. This limits the amount of data available in terms of spatial coverage.
Key strengths of proxy measures Ø 1. Proxy records are meaningful recorders of environmental variables. The science is sound as the connections between the proxy-derived data and climate variability are well established.
Strengths Ø 2. Tree ring-derived data are especially valuable in climate reconstruction as they often represent regions (i. e. , multiple sites within a region are sampled and replication is a key element of the scientific method).
Strengths Ø 3. Most surface temperature reconstructions incorporate proxy data from a variety of sources over wide geographic areas. Thus, even if we start to remove individual records, the overall results remain robust.
Strengths Ø 4. The same general trends (e. g. , temperature trends) emerge from multiple reconstructions.