Introduction to Ocean Numerical Modeling 0 General Introduction


: - VERY expensive -")


- Slides: 24
Introduction to Ocean Numerical Modeling #0 –General Introduction Global model SSH Gildas Cambon, IRD/LOPS, France regional model SST gildas. cambon@ird. fr
WEEK 1 Day 1: 09: 30 – 11: 00: Introduction + Equations of geophysical fluid dynamics 11: 30 – 13: 30: Discretization + First steps in numerical modeling 15 h 00 – 18 h 00: Statistical tools for model validation (A. Montecinos) Day 2: 09: 30 – 12: 00: First steps in numerical modeling 14: 00 – 15: 45: Practical using simplified 1 D equations 16: 00 – 17: 45: Practical for Statistical tools for model validation (A. Montecinos) Day 3: 09: 30 – 12: 00: Presentation of 3 D models + CROCO 13: 45 – 15: 45: Practical using the shallow water model 16: 00 – 18: 00: Practical for Statistical tools for model validation (A. Montecinos) Day 4: 09: 30 – 12: 00: Evaluation 15: 00 – 18: 00: Finish practical and open discussion
Goals: • To understand the concepts of numerical modelling of the Ocean. • To be aware of the methods and limitations in numerical modelling. PDF available at http: //stockage. univ-brest. fr/~cambon/asi 18/sess 1/lectures_sess 1/
1 – Why study the Physics of the Oceans? 2 – Ocean general properties 3 – Ocean observations 4 – Ocean models
Why study the Physics of the oceans? 1. We get food from the ocean. Fish: about 15. 4% of animal protein consumption and 5. 5% total protein consumption by humans in the 1990 s. (source FAO) Example: fisheries in upwelling ecosystems (source Benguela Current Commission) Surface chlorophyll concentration (source Sea. Wi. FS & CZCS, NASA/Goddard Space Flight Center) Benguela fisheries: 600 000 – 800 000 tons , US$19 billion per year.
Why study the Physics of the oceans? 2. We use the ocean. Example: transport Example: exploitation Example: leisure
Why study the Physics of the oceans? 3. Influence on weather and climate image source http: //data. giss. nasa. gov/gistemp/2008/ Ocean heat content for 0 -700 m (Levitus et al. 2009)
Why study the Physics of the oceans? 3. Influence on weather and climate Ocean northward heat transport for 1988 Source Stewart et al. , 2005, http: //oceanworld. tamu. edu/resources/ocng_textbook/contents. htm l
Oceanic geometry Source http: //oceansjsu. com/105 d/exped_commotion/8. ht ml Width: ~ 5000 – 10000 km Depth: ~ 5 km
Oceans and Currents Surface circulation Image source http: //earth. usc. edu/~stott/Catalina/Oceans. html Surface temperature Surface salinity
A wide range of scales for ocean processes Figure adapted from Cushman-Roisin and Beckers, 2009.
Ocean observation Research cruises
Ocean observation Moorings Source http: //www. pmel. noaa. gov/pirata/ Source http: //www. brest. ird. fr/pirata/ Source http: //www. pmel. noaa. gov/tao/
Ocean observation Satellite Oceanography Jason 2 satellite, operated by EUMETSAT Source http: //www. computescotland. com/2721. php
Ocean observation Coastal Radar Stations Source http: //www-bml. ucdavis. edu/boon/hf_radar. html Source http: //reinas. soe. ucsc. edu/images/codar-sample. gif
Ocean observation ARGO profilers Source http: //www. argo. ucsd. edu/
Ocean observation Gliders
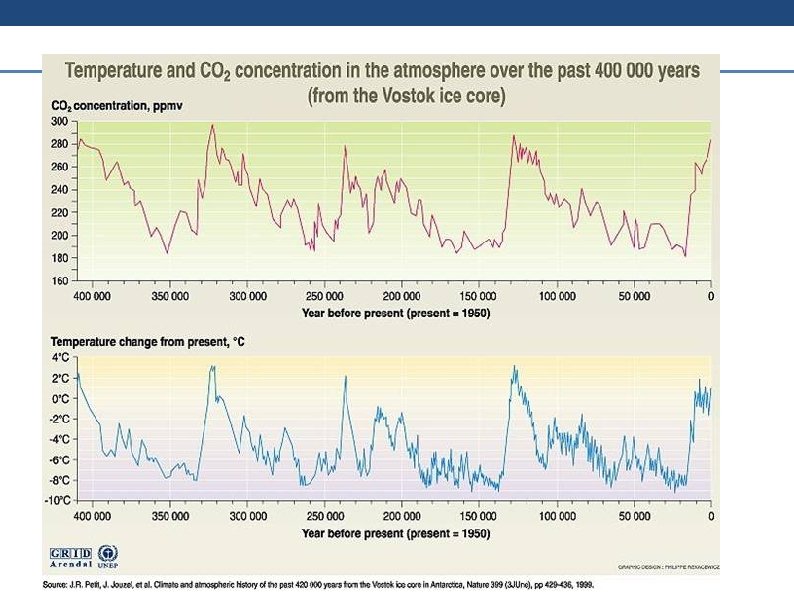
Ocean Observation Paleo-oceanography
Ocean dynamics are complex… Surface circulation Iso-surface of vorticity for the Agulhas rings . . . and highly non-linear
It is difficult to observe the Ocean In-situ observations (boat): - VERY expensive - 1 station at a time (no global coverage). - difficult to get all the variables at the same time. - limited time period. Moorings: - Long time series (a few months to a few years). - Very localized (1 point). - Subject to fooling and vandalism. Satellites: - Global coverage. - Quasi-synoptic view (i. e. Possible to get almost a snapshot of the global ocean) - Only surface measurements. - Few variables: SST, SSH, Ocean color (phytoplankton). - Problem of clouds (SST, color) or reference level (SSH). Lagrangian floats (surface drifters, profilers, etc. . ): - Quasi-synoptic observations (if enough floats). - Limited coverage. - Difficult to control. New technologies (gliders, sea-soar, etc. . ): - Prototypes. + It is very difficult to understand these observations. . .
. . . Use of models: Pros: - Can be relatively cost effective. - Gives you a synoptic view for all the variables at all times. - Possibility to diagnose the equilibriums (ex: role of bottom friction). - Possibility to use simplified models to understand the processes. - Possibility to track processes in time (ex: fate of upwelled water). - Possibility to test hypothesis (ex: Remove Madagascar). - Possibility to run events from the past (ex: Paleo-climatology). - Possibility to test “what if” scenarios (ex: global warming). - Possibility to couple different models (ex: atmosphere, water quality, biogeochemistry, land, rivers, fish, economy). - Possibility to do forecasts. Cons: - A model solution is not reality. - Sometimes it doesn’t work. - Staying all day in front of a computer Downloaded from Miami Isopycnic Coordinate Ocean Model web site
Good point : we know the equations to solve Bad point : we don't know how to solve them => Use of numerical modelling
Principle: Boundary conditions Ocean at time t Primitive Equations Ocean at time t + dt