Introduction to Intel x 86 64 Assembly Architecture
Introduction to Intel x 86 -64 Assembly, Architecture, Applications, & Alliteration Xeno Kovah – 2014 xkovah at gmail

All materials is licensed under a Creative Commons “Share Alike” license. • http: //creativecommons. org/licenses/by-sa/3. 0/ Attribution condition: You must indicate that derivative work "Is derived from Xeno Kovah's 'Intro x 86 -64’ class, available at http: //Open. Security. Training. info/Intro. X 86 -64. html”
gcc - GNU project C and C++ compiler • Available for many *nix systems (Linux/BSD/OSX/Solaris) • Supports many other architectures besides x 86 • Some C/C++ options, some architecture-specific options – Main option we care about is building debug symbols. Use “ggdb” command line argument. • Basically all of the Visual. Studio options in the project properties page are just fancy wrappers around giving their compiler command line arguments. The equivalent on *nix is for to developers create “makefile”s which are a configuration or configurations which describes which options will be used for compilation, how files will be linked together, etc. We won’t get that complicated in this class, so we can just specify command line arguments manually. Book p. 53
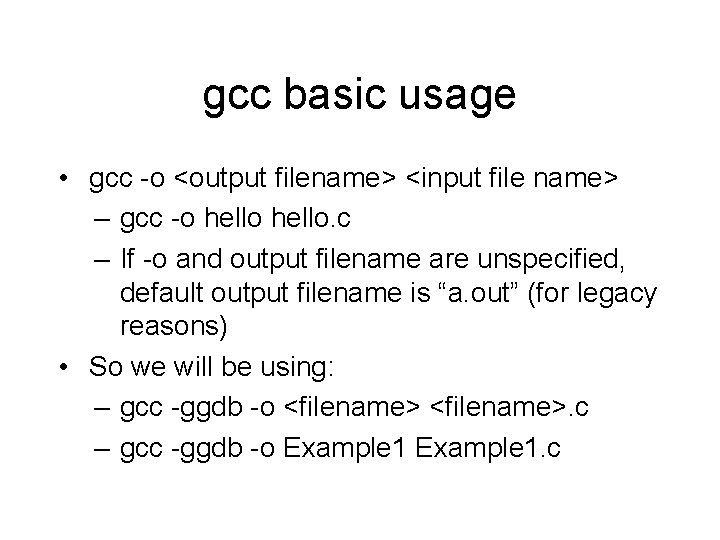
gcc basic usage • gcc -o <output filename> <input file name> – gcc -o hello. c – If -o and output filename are unspecified, default output filename is “a. out” (for legacy reasons) • So we will be using: – gcc -ggdb -o <filename>. c – gcc -ggdb -o Example 1. c
objdump - display information from object files • Where ”object file” can be an intermediate file created during compilation but before linking, or a fully linked executable – For our purposes means any ELF file - the executable format standard for Linux • The main thing we care about is -d to disassemble a file. • Can override the output syntax with “-M intel” – Good for getting an alternative perspective on what an instruction is doing, while learning AT&T syntax Book p. 63
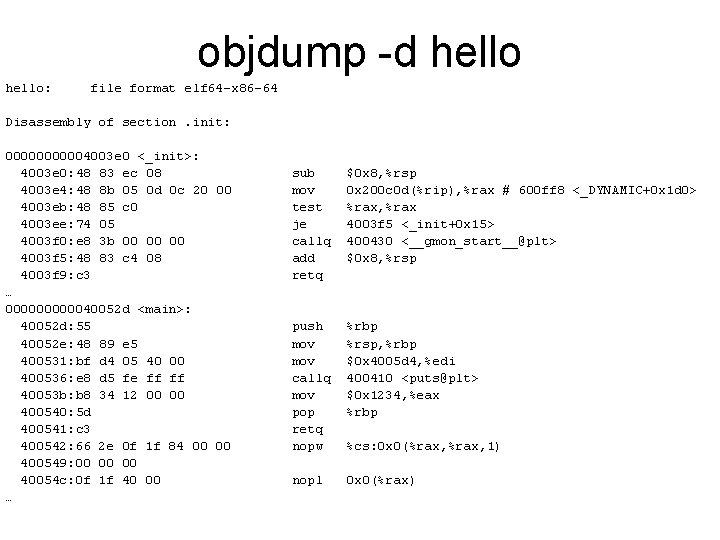
objdump -d hello: file format elf 64 -x 86 -64 Disassembly of section. init: 000004003 e 0 <_init>: 4003 e 0: 48 83 ec 08 4003 e 4: 48 8 b 05 0 d 0 c 20 00 4003 eb: 48 85 c 0 4003 ee: 74 05 4003 f 0: e 8 3 b 00 00 00 4003 f 5: 48 83 c 4 08 4003 f 9: c 3 … 0000040052 d <main>: 40052 d: 55 40052 e: 48 89 e 5 400531: bf d 4 05 40 00 400536: e 8 d 5 fe ff ff 40053 b: b 8 34 12 00 00 400540: 5 d 400541: c 3 400542: 66 2 e 0 f 1 f 84 00 00 400549: 00 00 00 40054 c: 0 f 1 f 40 00 … sub mov test je callq add retq $0 x 8, %rsp 0 x 200 c 0 d(%rip), %rax # 600 ff 8 <_DYNAMIC+0 x 1 d 0> %rax, %rax 4003 f 5 <_init+0 x 15> 400430 <__gmon_start__@plt> $0 x 8, %rsp push mov callq mov pop retq nopw %rbp %rsp, %rbp $0 x 4005 d 4, %edi 400410 <puts@plt> $0 x 1234, %eax %rbp nopl 0 x 0(%rax) %cs: 0 x 0(%rax, 1)
![Wait…whut? “nopl/nopw”? “There are more [NOPS] under heaven and earth, Horatio, than are dreamt Wait…whut? “nopl/nopw”? “There are more [NOPS] under heaven and earth, Horatio, than are dreamt](http://slidetodoc.com/presentation_image_h2/cbdd0e35544f87da817ff926fe93ad37/image-7.jpg)
Wait…whut? “nopl/nopw”? “There are more [NOPS] under heaven and earth, Horatio, than are dreamt of in your philosophy” : ) GCC is clearly using some multi-byte NOPs to pad the end of main() so that the next function starts on a 0 x 10 -aligned boundary
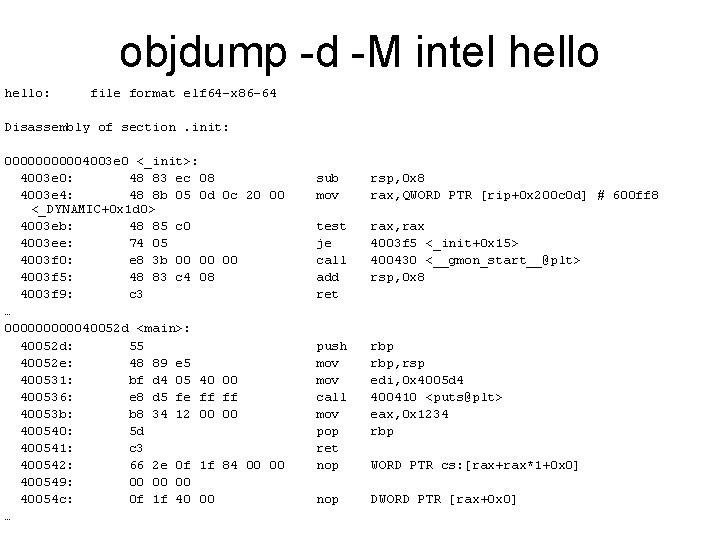
objdump -d -M intel hello: file format elf 64 -x 86 -64 Disassembly of section. init: 000004003 e 0 <_init>: 4003 e 0: 48 83 ec 08 4003 e 4: 48 8 b 05 0 d <_DYNAMIC+0 x 1 d 0> 4003 eb: 48 85 c 0 4003 ee: 74 05 4003 f 0: e 8 3 b 00 00 4003 f 5: 48 83 c 4 08 4003 f 9: c 3 … 0000040052 d <main>: 40052 d: 55 40052 e: 48 89 e 5 400531: bf d 4 05 40 400536: e 8 d 5 fe ff 40053 b: b 8 34 12 00 400540: 5 d 400541: c 3 400542: 66 2 e 0 f 1 f 400549: 00 00 00 40054 c: 0 f 1 f 40 00 … 0 c 20 00 00 00 ff 00 84 00 00 sub mov rsp, 0 x 8 rax, QWORD PTR [rip+0 x 200 c 0 d] # 600 ff 8 test je call add ret rax, rax 4003 f 5 <_init+0 x 15> 400430 <__gmon_start__@plt> rsp, 0 x 8 push mov call mov pop ret nop rbp, rsp edi, 0 x 4005 d 4 400410 <puts@plt> eax, 0 x 1234 rbp nop DWORD PTR [rax+0 x 0] WORD PTR cs: [rax+rax*1+0 x 0]
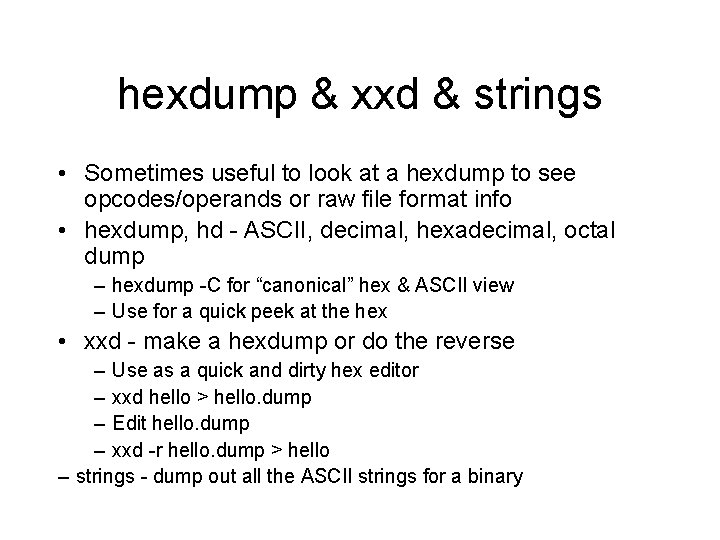
hexdump & xxd & strings • Sometimes useful to look at a hexdump to see opcodes/operands or raw file format info • hexdump, hd - ASCII, decimal, hexadecimal, octal dump – hexdump -C for “canonical” hex & ASCII view – Use for a quick peek at the hex • xxd - make a hexdump or do the reverse – Use as a quick and dirty hex editor – xxd hello > hello. dump – Edit hello. dump – xxd -r hello. dump > hello – strings - dump out all the ASCII strings for a binary
GDB - the GNU debugger • A command line debugger - quite a bit less userfriendly for beginners. – There are wrappers such as ddd but I tried them back when I was learning asm and didn’t find them to be helpful. YMMV • Syntax for starting a program in GDB in this class: – gdb <program name> -x <command file> – gdb Example 1 -x my. Cmds Book p. 57
About GDB -x <command file> • Somewhat more memorable long form is “ --command=<command file>” • <command file> is a plaintext file with a list of commands that GDB should execute upon starting up. Sort of like scripting the debugger. • Absolutely essential to making GDB reasonable to work with for extended periods of time (I used GDB for many years copying and pasting my command list every time I started GDB, so I was super ultra happy when I found this option)
GDB commands • “help” - internal navigation of available commands • “run” or “r” - run the program • “r <argv>” - run the program passing the arguments in <argv> – I. e. for Example 2 “r 1 2” would be what we used in windows
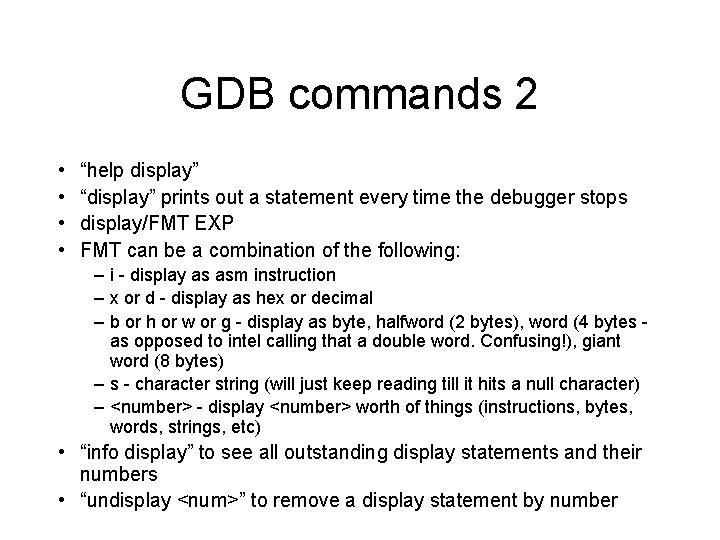
GDB commands 2 • • “help display” “display” prints out a statement every time the debugger stops display/FMT EXP FMT can be a combination of the following: – i - display as asm instruction – x or d - display as hex or decimal – b or h or w or g - display as byte, halfword (2 bytes), word (4 bytes as opposed to intel calling that a double word. Confusing!), giant word (8 bytes) – s - character string (will just keep reading till it hits a null character) – <number> - display <number> worth of things (instructions, bytes, words, strings, etc) • “info display” to see all outstanding display statements and their numbers • “undisplay <num>” to remove a display statement by number
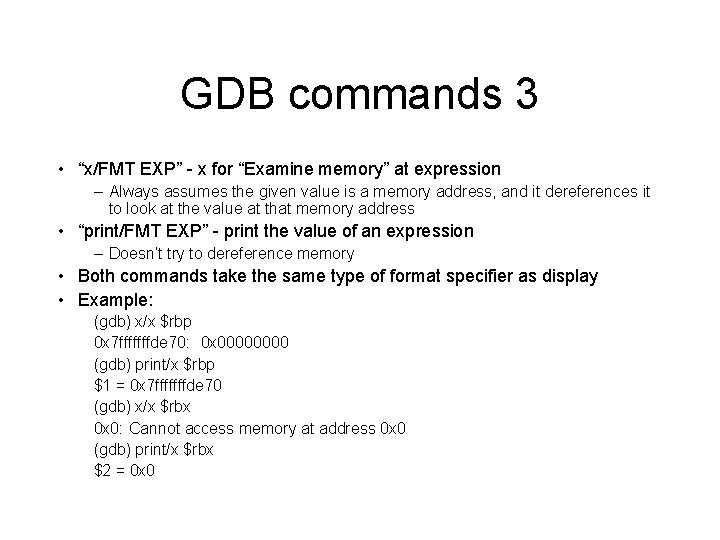
GDB commands 3 • “x/FMT EXP” - x for “Examine memory” at expression – Always assumes the given value is a memory address, and it dereferences it to look at the value at that memory address • “print/FMT EXP” - print the value of an expression – Doesn’t try to dereference memory • Both commands take the same type of format specifier as display • Example: (gdb) x/x $rbp 0 x 7 fffffffde 70: 0 x 0000 (gdb) print/x $rbp $1 = 0 x 7 fffffffde 70 (gdb) x/x $rbx 0 x 0: Cannot access memory at address 0 x 0 (gdb) print/x $rbx $2 = 0 x 0
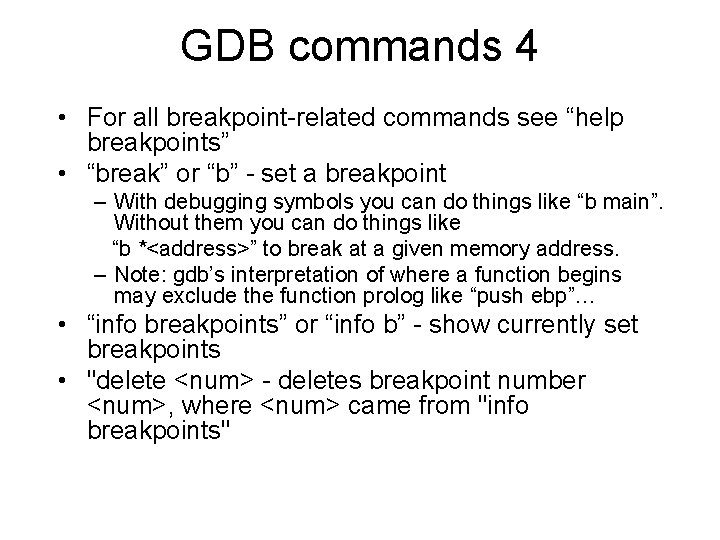
GDB commands 4 • For all breakpoint-related commands see “help breakpoints” • “break” or “b” - set a breakpoint – With debugging symbols you can do things like “b main”. Without them you can do things like “b *<address>” to break at a given memory address. – Note: gdb’s interpretation of where a function begins may exclude the function prolog like “push ebp”… • “info breakpoints” or “info b” - show currently set breakpoints • "delete <num> - deletes breakpoint number <num>, where <num> came from "info breakpoints"
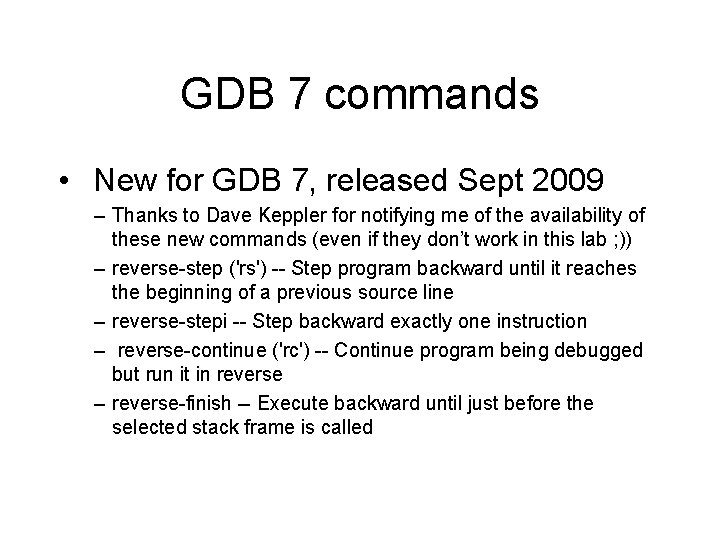
GDB 7 commands • New for GDB 7, released Sept 2009 – Thanks to Dave Keppler for notifying me of the availability of these new commands (even if they don’t work in this lab ; )) – reverse-step ('rs') -- Step program backward until it reaches the beginning of a previous source line – reverse-stepi -- Step backward exactly one instruction – reverse-continue ('rc') -- Continue program being debugged but run it in reverse – reverse-finish -- Execute backward until just before the selected stack frame is called
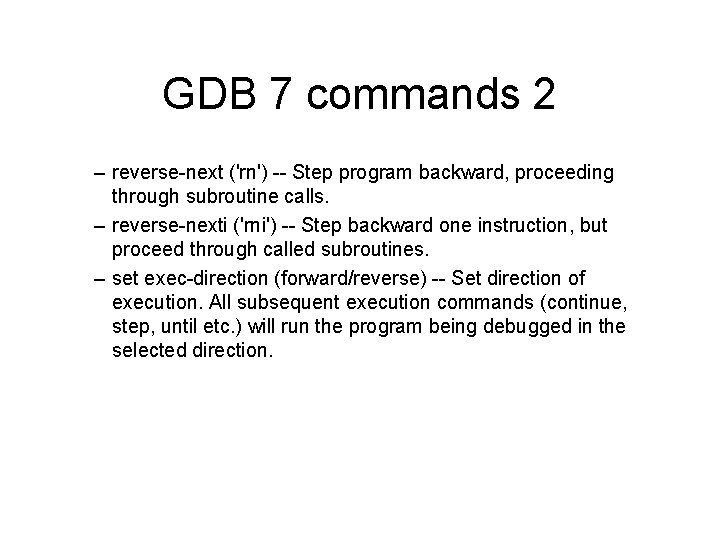
GDB 7 commands 2 – reverse-next ('rn') -- Step program backward, proceeding through subroutine calls. – reverse-nexti ('rni') -- Step backward one instruction, but proceed through called subroutines. – set exec-direction (forward/reverse) -- Set direction of execution. All subsequent execution commands (continue, step, until etc. ) will run the program being debugged in the selected direction.
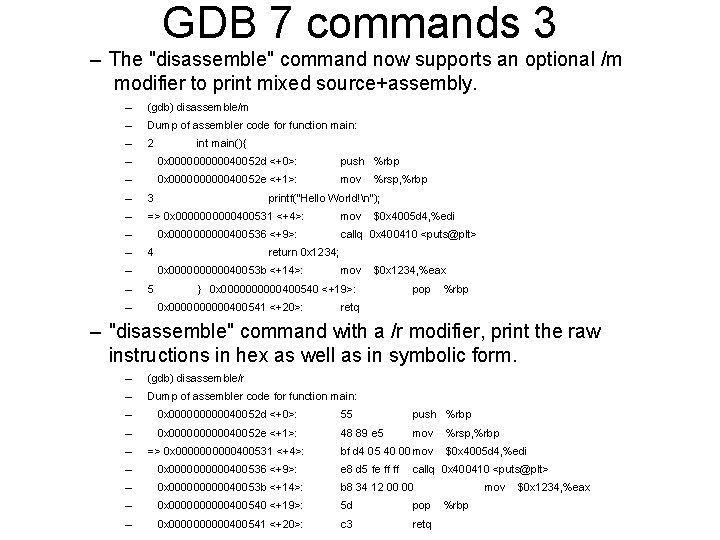
GDB 7 commands 3 – The "disassemble" command now supports an optional /m modifier to print mixed source+assembly. – (gdb) disassemble/m – Dump of assembler code for function main: – 2 int main(){ – 0 x 0000040052 d <+0>: push %rbp – 0 x 0000040052 e <+1>: mov – 3 – => 0 x 00000400531 <+4>: – 0 x 00000400536 <+9>: – – – printf("Hello World!n"); 4 – mov $0 x 4005 d 4, %edi callq 0 x 400410 <puts@plt> return 0 x 1234; 0 x 0000040053 b <+14>: 5 %rsp, %rbp mov $0 x 1234, %eax } 0 x 00000400540 <+19>: 0 x 00000400541 <+20>: pop %rbp retq – "disassemble" command with a /r modifier, print the raw instructions in hex as well as in symbolic form. – (gdb) disassemble/r – Dump of assembler code for function main: – 0 x 0000040052 d <+0>: 55 push %rbp – 0 x 0000040052 e <+1>: 48 89 e 5 mov – => 0 x 00000400531 <+4>: – 0 x 00000400536 <+9>: e 8 d 5 fe ff ff – 0 x 0000040053 b <+14>: b 8 34 12 00 00 – 0 x 00000400540 <+19>: 5 d pop – 0 x 00000400541 <+20>: c 3 retq bf d 4 05 40 00 mov %rsp, %rbp $0 x 4005 d 4, %edi callq 0 x 400410 <puts@plt> mov %rbp $0 x 1234, %eax
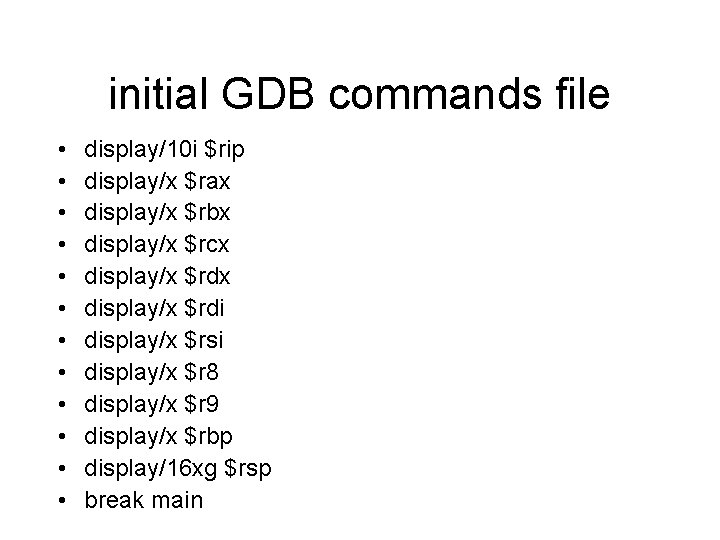
initial GDB commands file • • • display/10 i $rip display/x $rax display/x $rbx display/x $rcx display/x $rdi display/x $rsi display/x $r 8 display/x $r 9 display/x $rbp display/16 xg $rsp break main
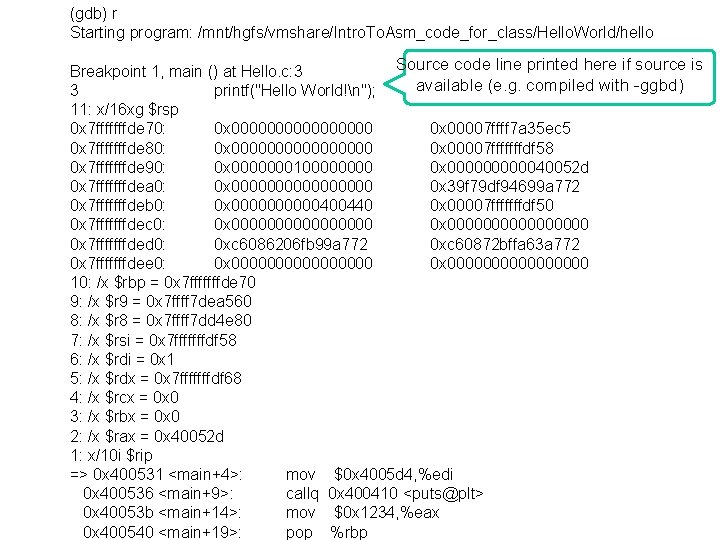
(gdb) r Starting program: /mnt/hgfs/vmshare/Intro. To. Asm_code_for_class/Hello. World/hello Example run with commands file Source code line printed here if source is Breakpoint 1, main () at Hello. c: 3 available (e. g. compiled with -ggbd) 3 printf("Hello World!n"); 11: x/16 xg $rsp 0 x 7 fffffffde 70: 0 x 00000000 0 x 00007 ffff 7 a 35 ec 5 0 x 7 fffffffde 80: 0 x 00000000 0 x 00007 fffffffdf 58 0 x 7 fffffffde 90: 0 x 000000010000 0 x 0000040052 d 0 x 7 fffffffdea 0: 0 x 00000000 0 x 39 f 79 df 94699 a 772 0 x 7 fffffffdeb 0: 0 x 00000400440 0 x 00007 fffffffdf 50 0 x 7 fffffffdec 0: 0 x 0000000000000000 0 x 7 fffffffded 0: 0 xc 6086206 fb 99 a 772 0 xc 60872 bffa 63 a 772 0 x 7 fffffffdee 0: 0 x 0000000000000000 10: /x $rbp = 0 x 7 fffffffde 70 9: /x $r 9 = 0 x 7 ffff 7 dea 560 8: /x $r 8 = 0 x 7 ffff 7 dd 4 e 80 7: /x $rsi = 0 x 7 fffffffdf 58 6: /x $rdi = 0 x 1 5: /x $rdx = 0 x 7 fffffffdf 68 4: /x $rcx = 0 x 0 3: /x $rbx = 0 x 0 2: /x $rax = 0 x 40052 d 1: x/10 i $rip => 0 x 400531 <main+4>: mov $0 x 4005 d 4, %edi 0 x 400536 <main+9>: callq 0 x 400410 <puts@plt> 0 x 40053 b <main+14>: mov $0 x 1234, %eax 0 x 400540 <main+19>: pop %rbp
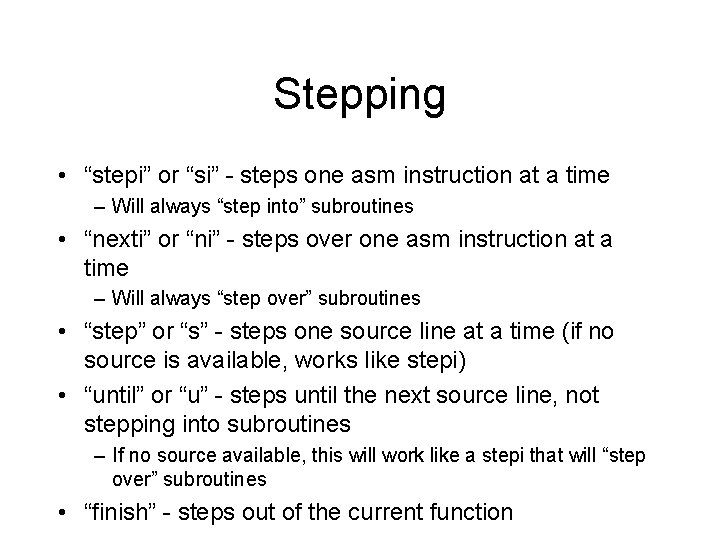
Stepping • “stepi” or “si” - steps one asm instruction at a time – Will always “step into” subroutines • “nexti” or “ni” - steps over one asm instruction at a time – Will always “step over” subroutines • “step” or “s” - steps one source line at a time (if no source is available, works like stepi) • “until” or “u” - steps until the next source line, not stepping into subroutines – If no source available, this will work like a stepi that will “step over” subroutines • “finish” - steps out of the current function
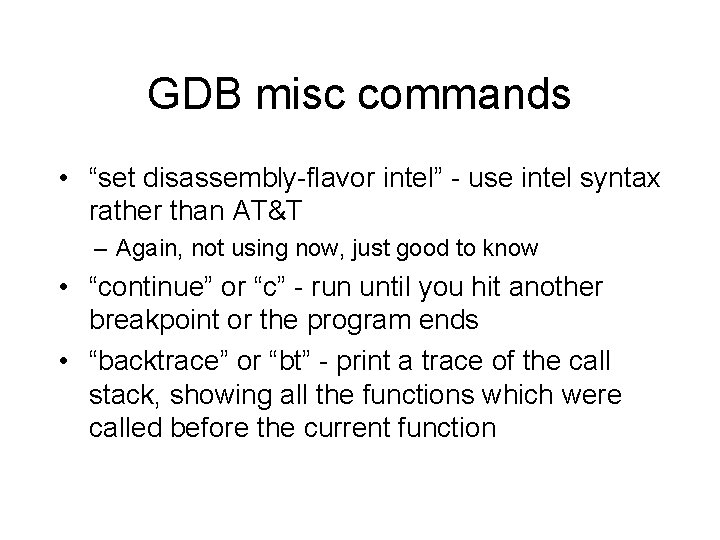
GDB misc commands • “set disassembly-flavor intel” - use intel syntax rather than AT&T – Again, not using now, just good to know • “continue” or “c” - run until you hit another breakpoint or the program ends • “backtrace” or “bt” - print a trace of the call stack, showing all the functions which were called before the current function
Lab time: Running all the examples we ran earlier with Windows/VS with Linux/GDB
- Slides: 23