Introduction to Inference Confidence Intervals Significance Test Use


…if a sample of 25 candies from the machine contained")


 • http: //www. teachpsychscience. org/files/pdf/")


 Determine what you are measuring")


 1214 1121 1258")

- Slides: 37
Introduction to Inference • Confidence Intervals • Significance Test • Use and Abuse of Statistical Inference *Grab your computer (same # as your calculator) and log in. We’ll use them briefly today
www. whfreeman. com/tps 4 e
http: //www. rossmanchance. com/applets/ #4)…if a sample of 25 candies from the machine contained 10 orange candies… #6) …(that’s 40% orange)? How about 10 orange candies (20% orange)? Explain
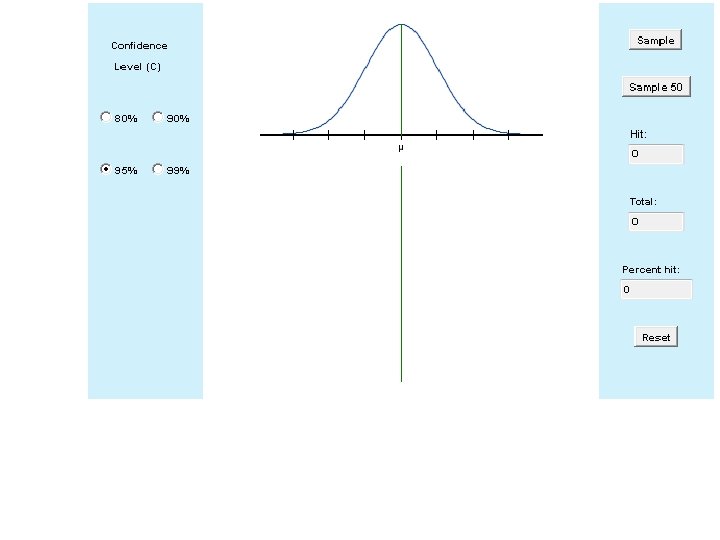
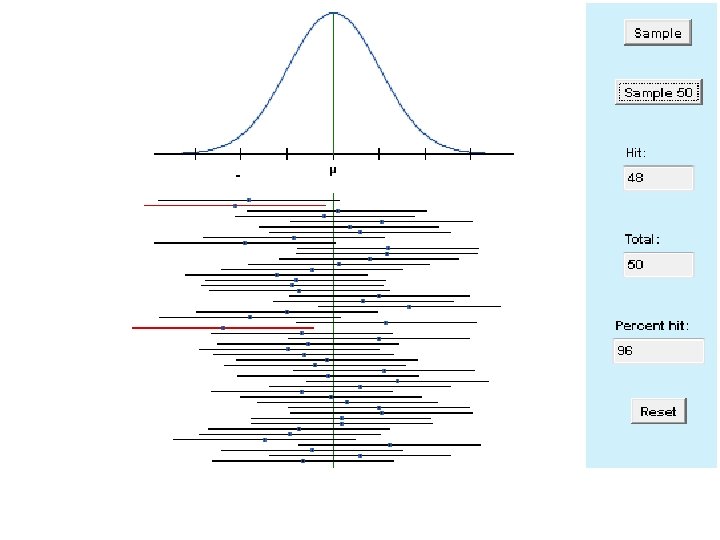
Observations about applet: Ø The center of each interval is the pt. est. Ø The dist. from pt. est. to either end of the interval is the margin of error Ø IF we created EVERY interval poss. then ______% of the intervals would contain pop. parameter
Vocab • Statistical inference- drawing conclusions about population based on data from sample • Parameters- #s that describe population • Statistic- # calculated from sample
• The 2007 Youth Risk Behavior Survey questioned 14, 041 students grades 9 -12. Of these 2808 said they had smoked cigarettes at least one day in the past month. That’s 20. 0% of the sample. • What is our population? Parameter? Statistic?
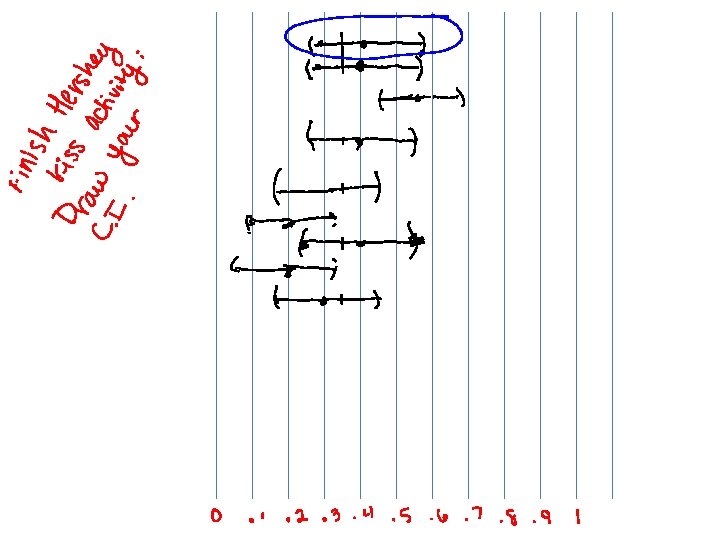
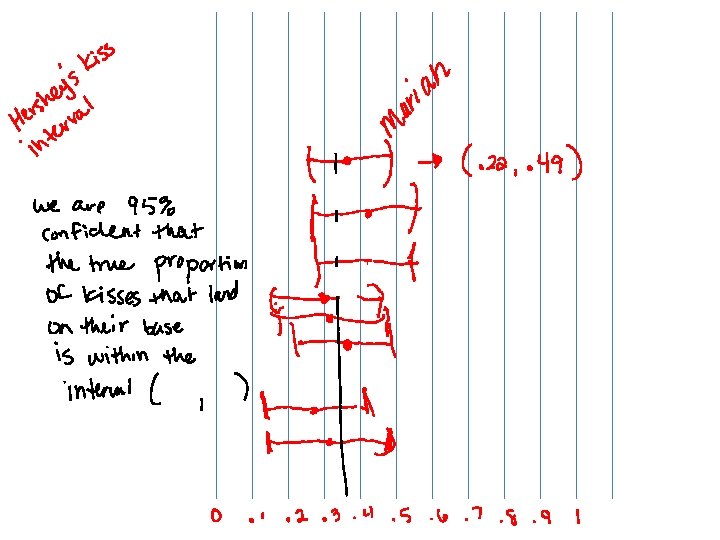
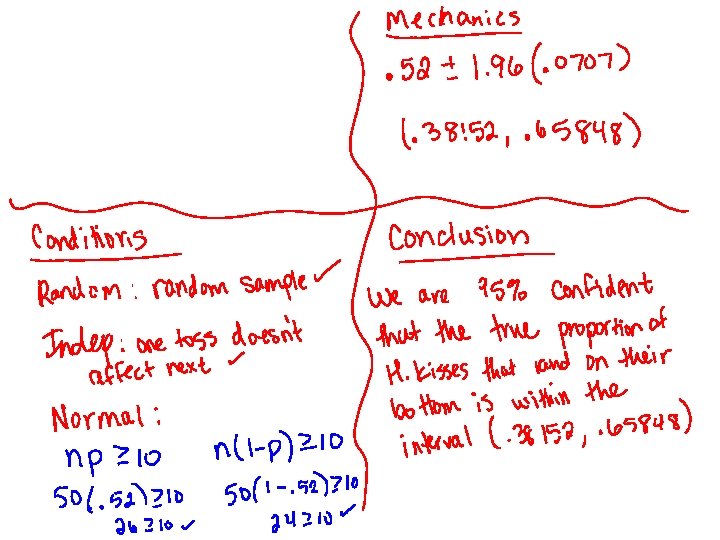
Hershey Kiss • Finish the worksheet- 10 minutes • The true proportion of Hershey kisses that land on their base is. 33 • Determine if your interval captures the true proportion • Write your interval on either green or pink paper (green= interval does capture, pink=interval does not capture) • Tape your paper to the board
Critical Values • • Find Z* for 90% 85% 92%
Demo of CI in Price is Right (sort of) • http: //www. teachpsychscience. org/files/pdf/ 13201425907 PM_1. PDF
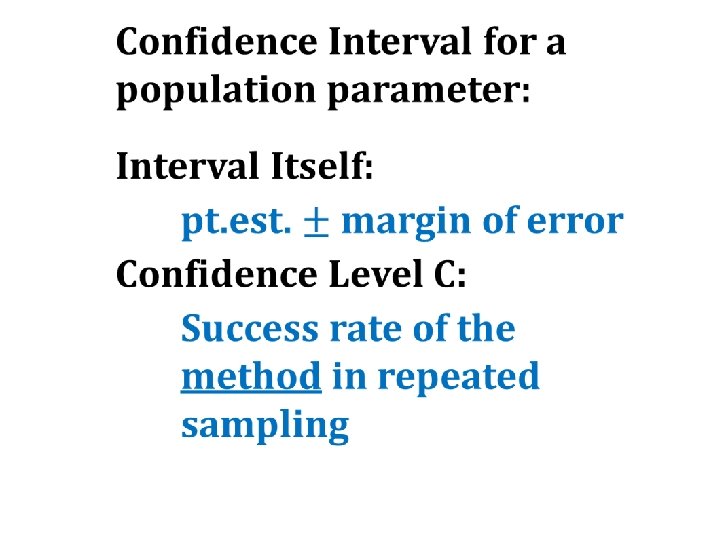
Interpreting!! Confidence Level How likely is our method to produce an interval that captures a parameter if we use it many times? Confidence Interval A set of plausible values for the pop. parameter
Our confidence level and the type of statistic determines this value
One-Sample z-interval for a Population Proportion The approximate conf int for p is
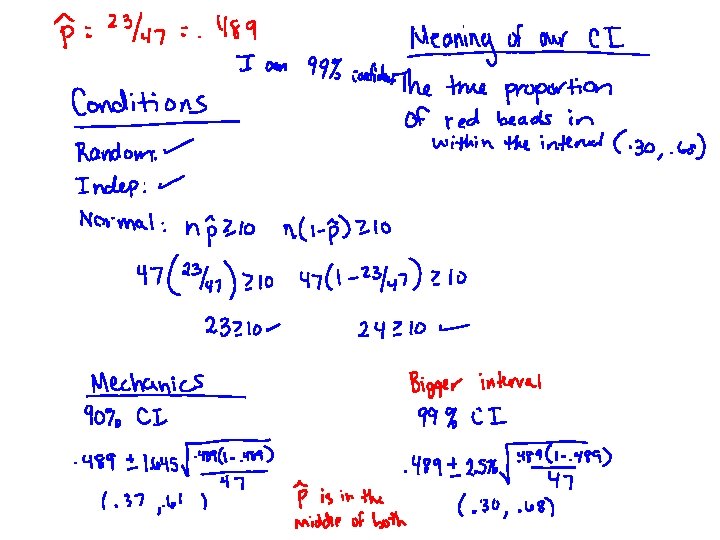
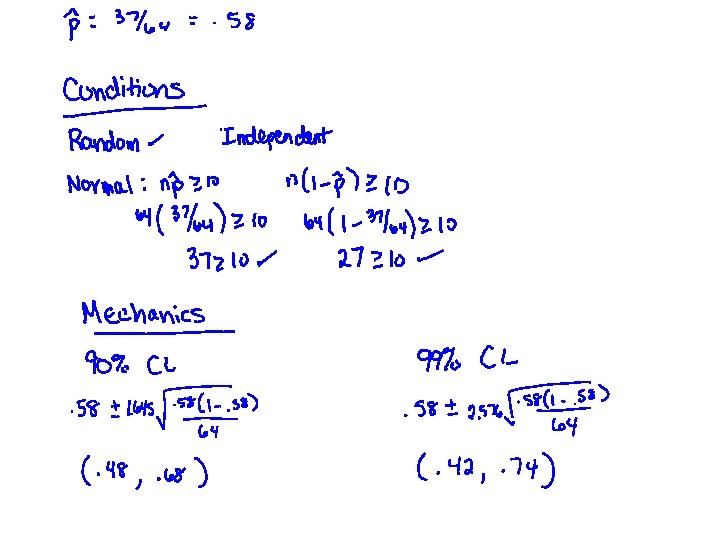
Conditions for constructing a confidence interval: ØRandom ØIndependent ØNormal (b/c sample size is large enough)
Create a 90% and 99% confidence interval for the proportion of red beads in the jar using your sample
Recap of Confidence Intervals To estimate a parameter: 1) Determine what you are measuring 2) Check the conditions 3) Create a confidence interval (this gives you the plausible values)
�Using sample results to estimate p Suppose a SRS of 358 beads results in 135 red beads. This is a point estimate for p
Example: In a survey, researchers asked adults aged 35 to 50 years if they used social media. A 90% confidence interval was calculated as being 73%, plus/minus 2. 35%.
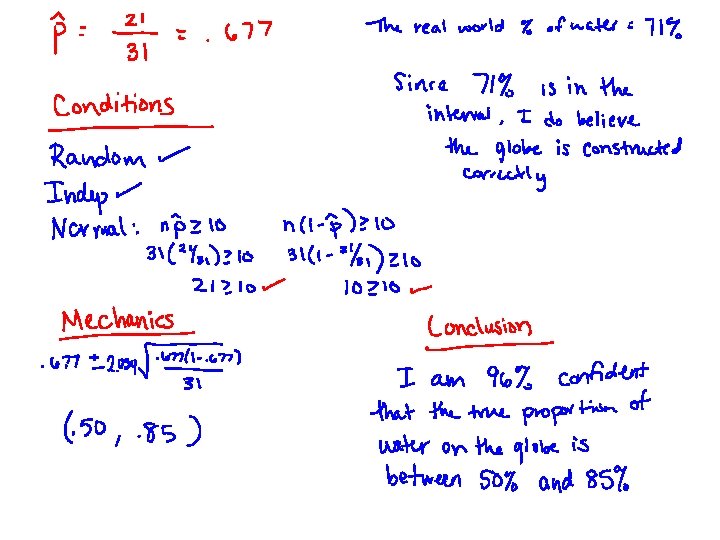
Globe Activity • What % of the time do we land on water with our left thumb? • Check conditions • Construct a 96% confidence interval
200 Test Scores Finding the confidence interval for the mean of these test scores. The population standard deviation is 13. 2. 1. 2. 3. 4. Pick 30 numbers and find the mean of them Check the conditions Calculate a 90% confidence interval Calculate a 95% confidence interval
200 Test Scores The true population mean is 64. 7. 5. If your interval captures the mean, write on green paper. If your interval does not capture the mean, write on pink paper. 6. Tape both intervals in the appropriate spot on the board
Example 1 To check adherence to the speed limit on a particular stretch of road the speed was recorded for a random sample of 37 vehicles. The average was 38. 42 mph with a standard deviation of 5. 01 mph. (BVD 3 e p. 530)
Example 2 How far does a pro drive the golf ball? To estimate this, a random sample of 63 distances was recorded with a mean of 288. 6 yards and a standard deviation of 9. 31 yards. (BVD 3 e p. 558)
Using One-Sample t Procedures: The Normal Condition • Large Samples: The t procedures can be used even for clearly skewed distributions when the sample is large, roughly n ≥ 30 • Small samples: Use t procedures if the data appear close to Normal (roughly symmetric, single peak, no outliers). If the data are clearly skewed or if outliers are present, do not use t.
Example 3 In 1998 Nabisco Foods advertised that each 18 -oz bag of Chips Ahoy cookies contained at least 1000 chocolate chips. Air Force Academy statistics students purchased randomly selected bags of cookies and counted the chocolate chips. (BVD 3 e p. 558)
Example 3 1219 1419 1244 1191 (BVD 3 e p. 558) 1214 1121 1258 1270 1087 1325 1356 1295 1200 1345 1132 1135
Example 4 A researcher tests a maze on several rats, collecting time to complete in minutes. (BVD 3 e p. 558) 38. 4 62. 8 55. 5 93. 8 46. 2 33. 9 60. 1 49. 5 47. 9 62. 5 50. 4 55. 1 40. 9 69. 2 38. 0 35. 0 57. 6 44. 3 46. 2