
Introduction to GWAS analysis Analysis of linkage patterns

- Slides: 15
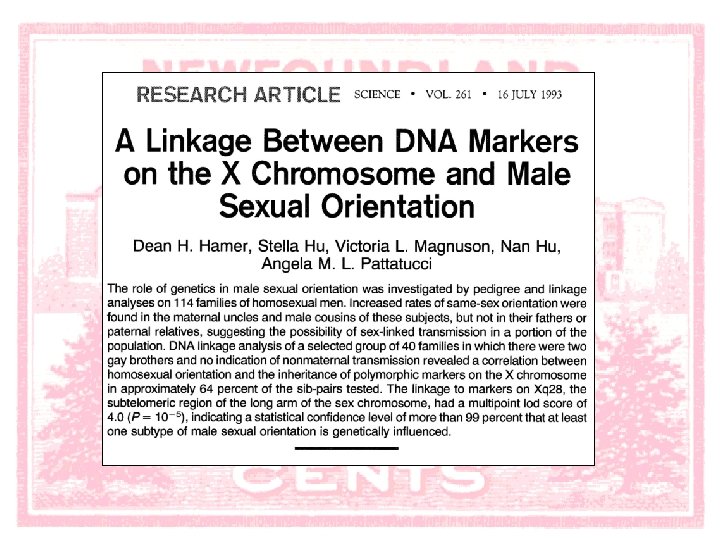
Introduction to GWAS analysis Analysis of linkage patterns among chromosome-specific genetic markers to infer genotype / phenotype correlations Based on DH Hamer et al. (1993) Science 261: 321 Disclaimer: The study and data are presented as a conceptual framework for understanding linkage and LOD analysis. No opinion is expressed as to any inferences from the results of that study. Steven M. Carr Dept of Biology Memorial University of Newfoundland St John’s NL A 1 B 3 X 9
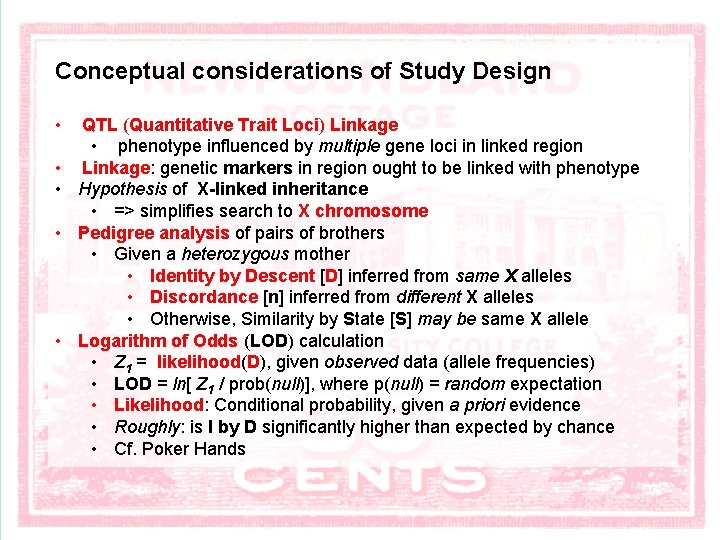
Conceptual considerations of Study Design • • • QTL (Quantitative Trait Loci) Linkage • phenotype influenced by multiple gene loci in linked region Linkage: genetic markers in region ought to be linked with phenotype Hypothesis of X-linked inheritance • => simplifies search to X chromosome Pedigree analysis of pairs of brothers • Given a heterozygous mother • Identity by Descent [D] inferred from same X alleles • Discordance [n] inferred from different X alleles • Otherwise, Similarity by State [S] may be same X allele Logarithm of Odds (LOD) calculation • Z 1 = likelihood(D), given observed data (allele frequencies) • LOD = ln[ Z 1 / prob(null)], where p(null) = random expectation • Likelihood: Conditional probability, given a priori evidence • Roughly: is I by D significantly higher than expected by chance • Cf. Poker Hands
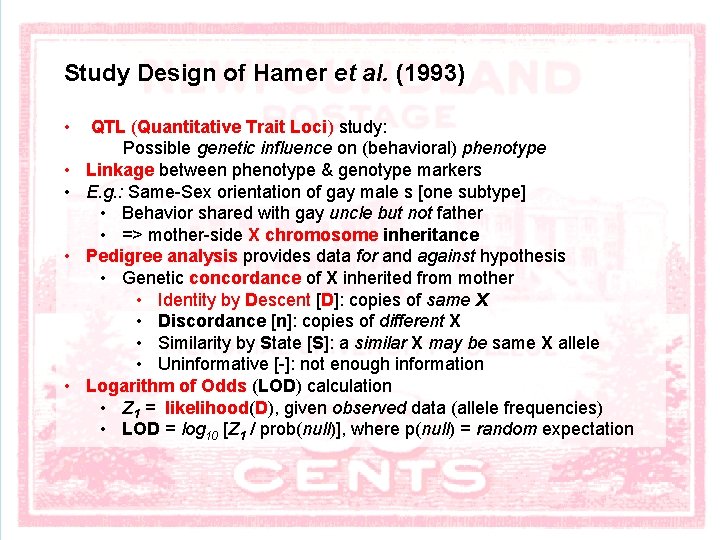
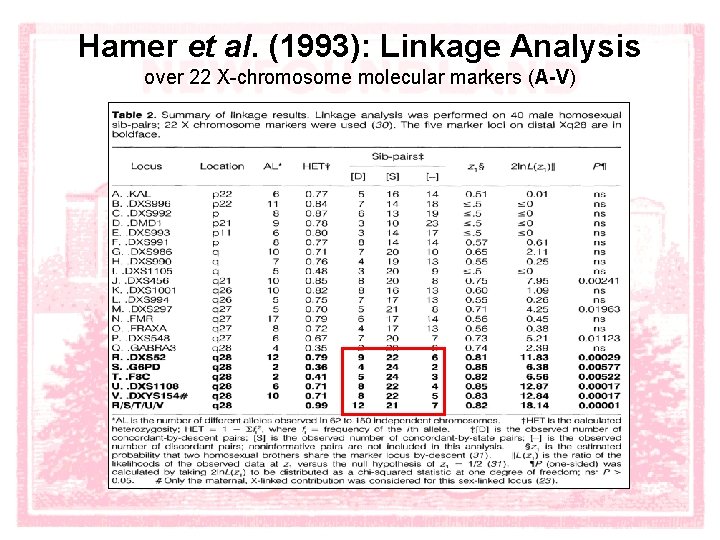
Study Design of Hamer et al. (1993) • • • QTL (Quantitative Trait Loci) study: Possible genetic influence on (behavioral) phenotype Linkage between phenotype & genotype markers E. g. : Same-Sex orientation of gay male s [one subtype] • Behavior shared with gay uncle but not father • => mother-side X chromosome inheritance Pedigree analysis provides data for and against hypothesis • Genetic concordance of X inherited from mother • Identity by Descent [D]: copies of same X • Discordance [n]: copies of different X • Similarity by State [S]: a similar X may be same X allele • Uninformative [-]: not enough information Logarithm of Odds (LOD) calculation • Z 1 = likelihood(D), given observed data (allele frequencies) • LOD = log 10 [Z 1 / prob(null)], where p(null) = random expectation
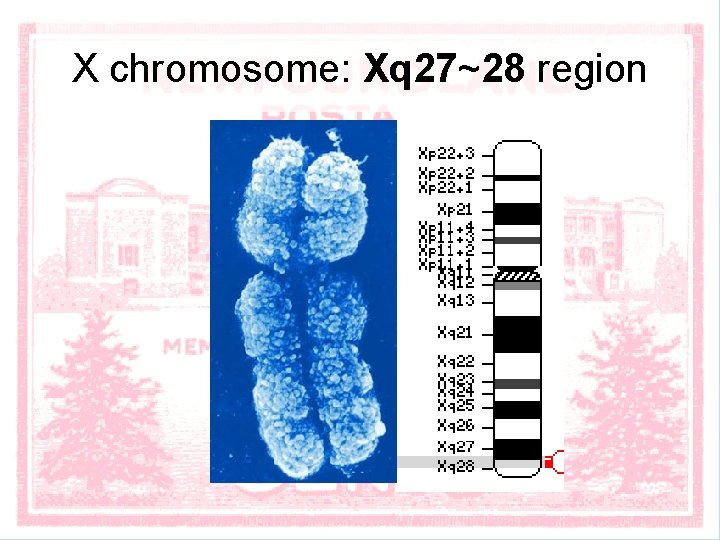
X chromosome: Xq 27~28 region
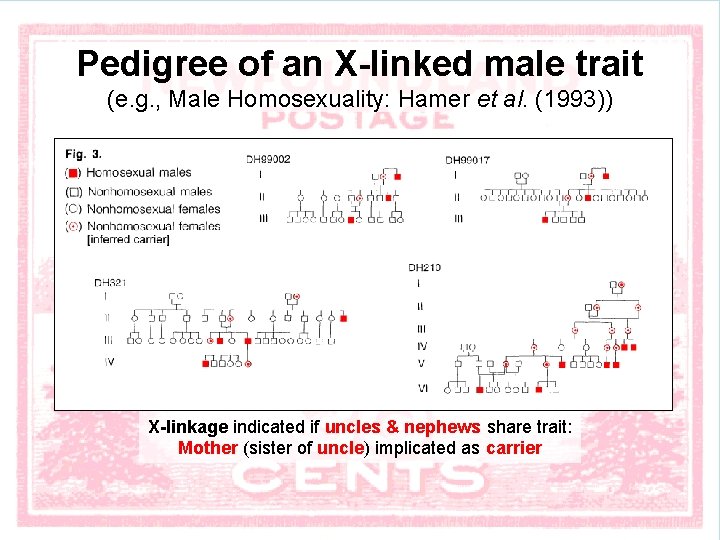
Pedigree of an X-linked male trait (e. g. , Male Homosexuality: Hamer et al. (1993)) X-linkage indicated if uncles & nephews share trait: Mother (sister of uncle) implicated as carrier
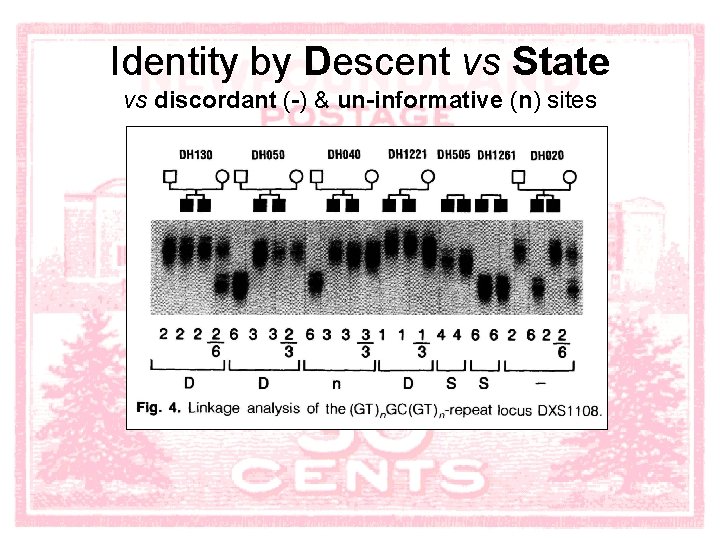
Identity by Descent vs State vs discordant (-) & un-informative (n) sites
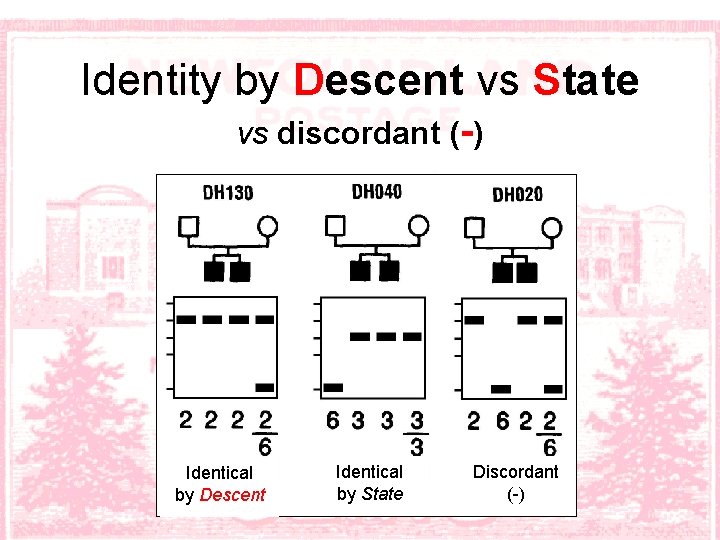
Identity by Descent vs State vs discordant (-) Identical by Descent Identical by State Discordant (-)
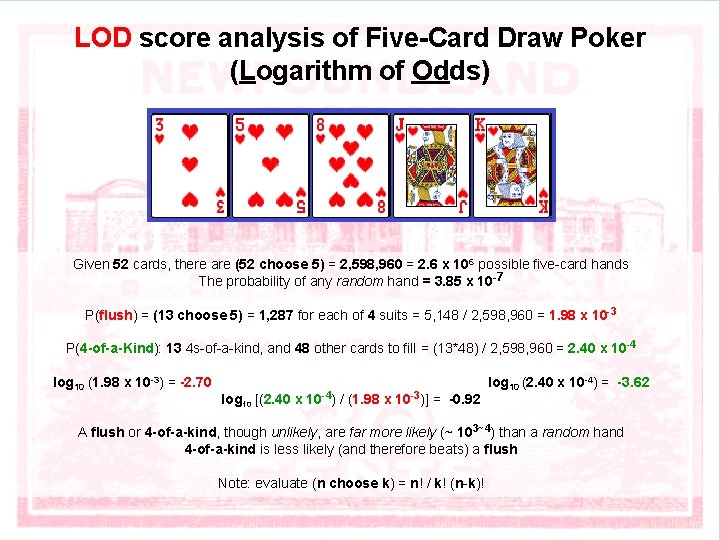
LOD score analysis of Five-Card Draw Poker (Logarithm of Odds) Given 52 cards, there are (52 choose 5) = 2, 598, 960 = 2. 6 x 10⁶ possible five-card hands The probability of any random hand = 3. 85 x 10 -7 P(flush) = (13 choose 5) = 1, 287 for each of 4 suits = 5, 148 / 2, 598, 960 = 1. 98 x 10 -3 P(4 -of-a-Kind): 13 4 s-of-a-kind, and 48 other cards to fill = (13*48) / 2, 598, 960 = 2. 40 x 10 -4 log 10 (1. 98 x 10 -3) = -2. 70 log 10 [(2. 40 x 10 -4) / (1. 98 x 10 -3)] = -0. 92 log 10 (2. 40 x 10 -4) = -3. 62 A flush or 4 -of-a-kind, though unlikely, are far more likely (~ 103~4) than a random hand 4 -of-a-kind is less likely (and therefore beats) a flush Note: evaluate (n choose k) = n! / k! (n-k)!
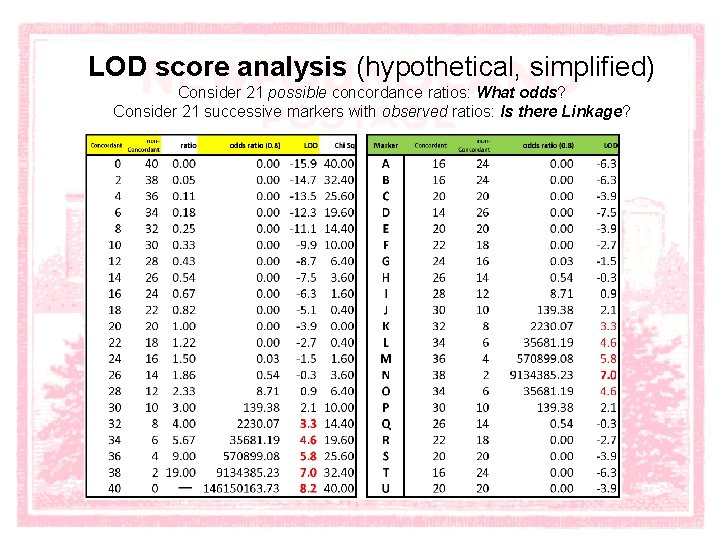
LOD score analysis (hypothetical, simplified) Consider 21 possible concordance ratios: What odds? Consider 21 successive markers with observed ratios: Is there Linkage?
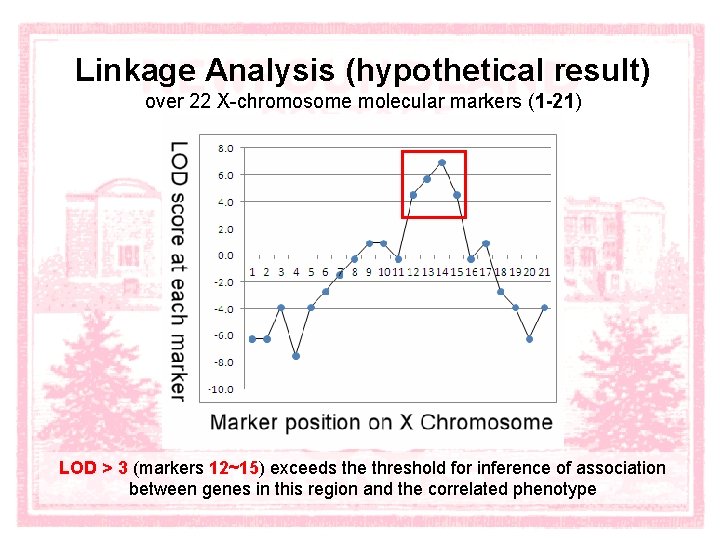
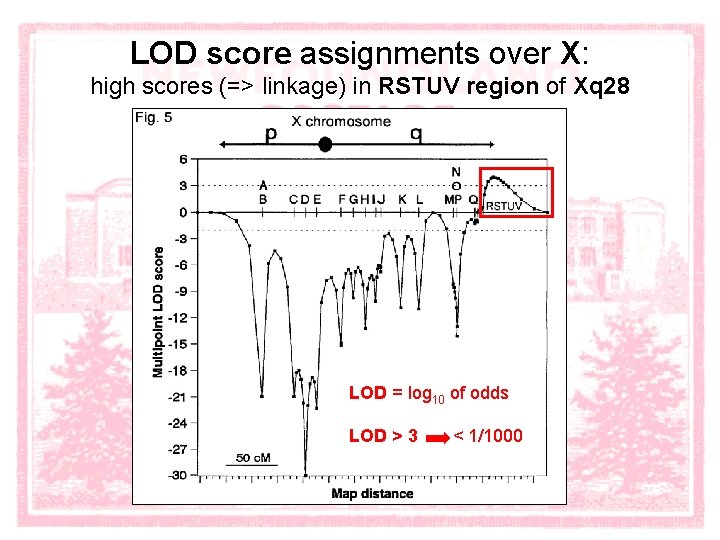
Linkage Analysis (hypothetical result) over 22 X-chromosome molecular markers (1 -21) LOD > 3 (markers 12~15) exceeds the threshold for inference of association between genes in this region and the correlated phenotype
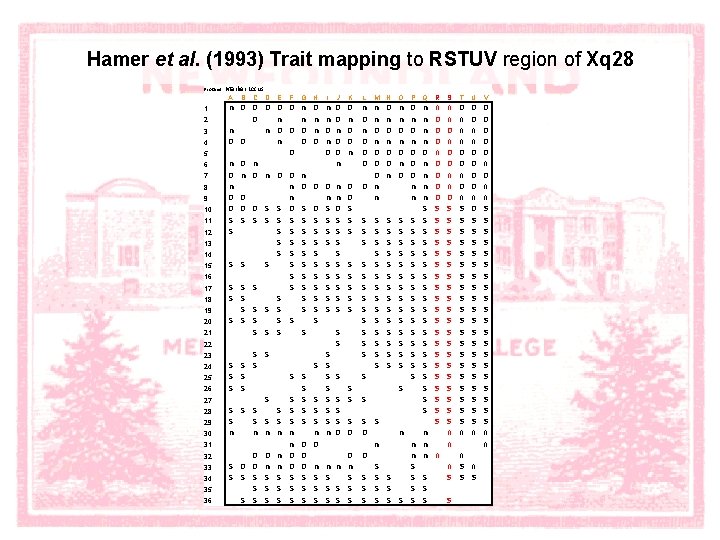
Hamer et al. (1993) Trait mapping to RSTUV region of Xq 28 Proband 1 2 3 4 5 6 7 8 9 10 11 12 13 14 15 16 17 18 19 20 21 Marker Locus A B C D E F G H I J K M N O P Q R S T U V n n D D D n D S S S S S n n D S S S S S D n n n D D D n n D D D D n S S S S S S S S S S S S S S S S S D n D D D n n n D n n S S S S S n n D D n n D S S S S S n n D n n n D D n S S S S S n D D n D S S S S S n D D D n n S S S S S n n n D D D n D n D n D D n n n D D D S S S S S S S S S S S S S D n n D S S S S S S n n n D D n D S D D n n D S S S S S S S n n D S S 22 23 24 25 26 27 28 29 30 31 32 33 34 35 36 S S S D D D S S S n S S L S S S D D D n n S S S S S S S S n n S S n D D D D S S S S S n n S S S S
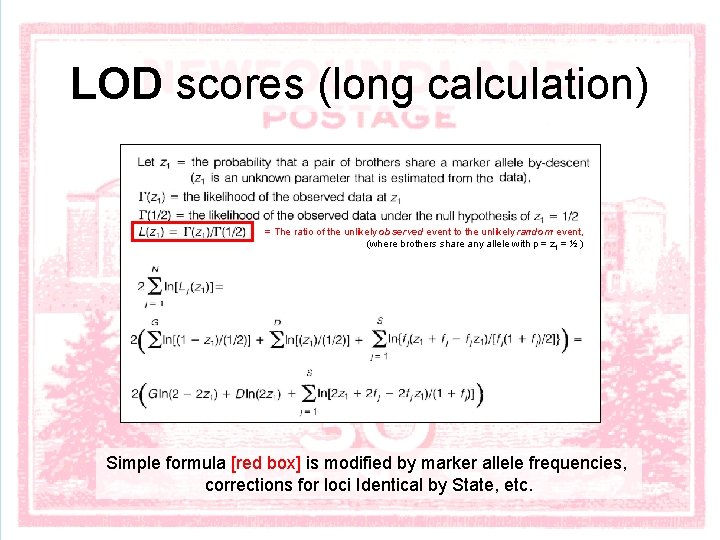
LOD scores (long calculation) = The ratio of the unlikely observed event to the unlikely random event, (where brothers share any allele with p = z 1 = ½ ) Simple formula [red box] is modified by marker allele frequencies, corrections for loci Identical by State, etc.
Hamer et al. (1993): Linkage Analysis over 22 X-chromosome molecular markers (A-V)
LOD score assignments over X: high scores (=> linkage) in RSTUV region of Xq 28 LOD = log 10 of odds LOD > 3 < 1/1000