Introduction to EViews What is Eviews Econometrics Views

 ? EViews is an easy-to-use statistical, econometric, and economic")


- Slides: 51
Introduction to EViews
What is Eviews (Econometrics Views) ? EViews is an easy-to-use statistical, econometric, and economic modeling package, which provides data analysis, regression and forecasting tools: • Useful for many different analyses • Very user-friendly (like Windows) • Excellent help function In this introduction, we will introduce two different ways to work in EViews: • Graphical user interface (using mouse and menus/dialogs). • Single commands (using the command window).
Getting Start
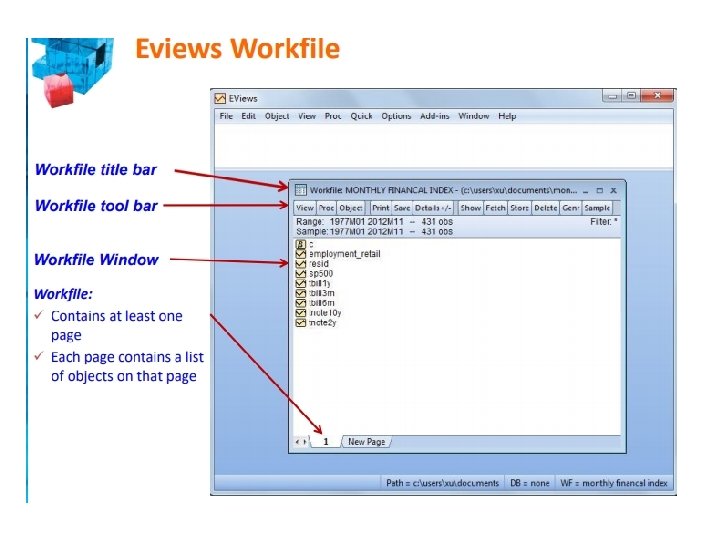
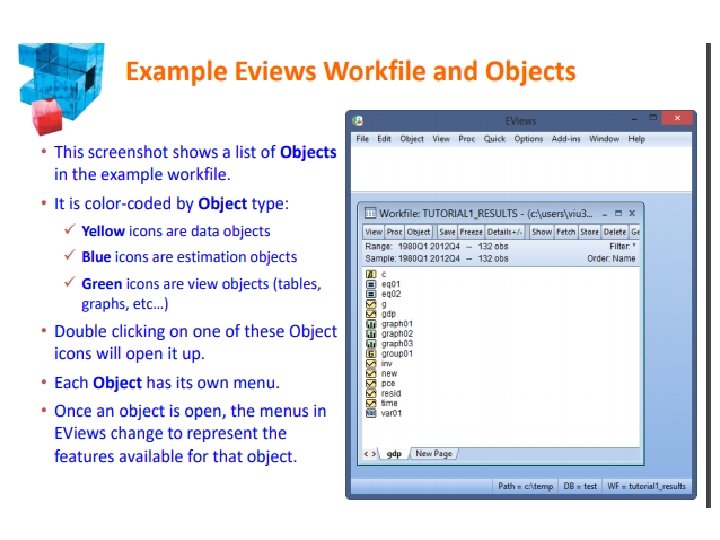
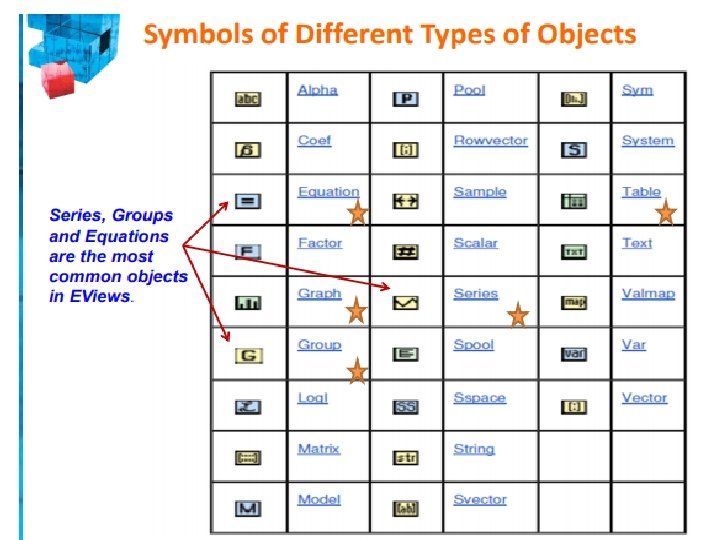
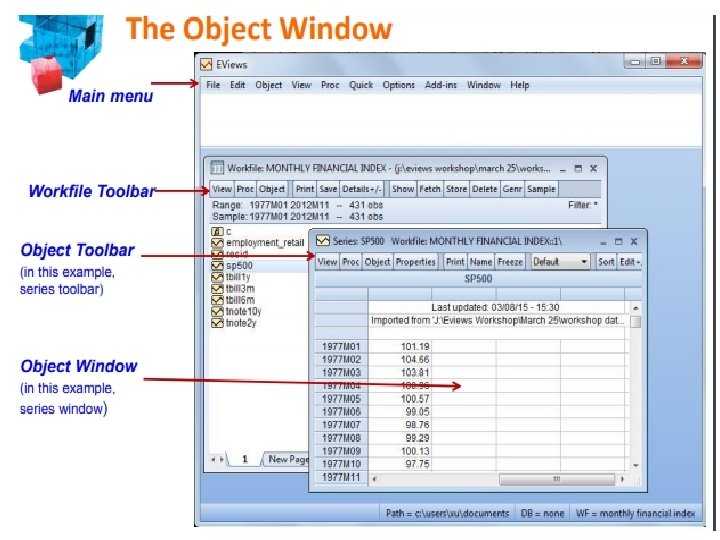
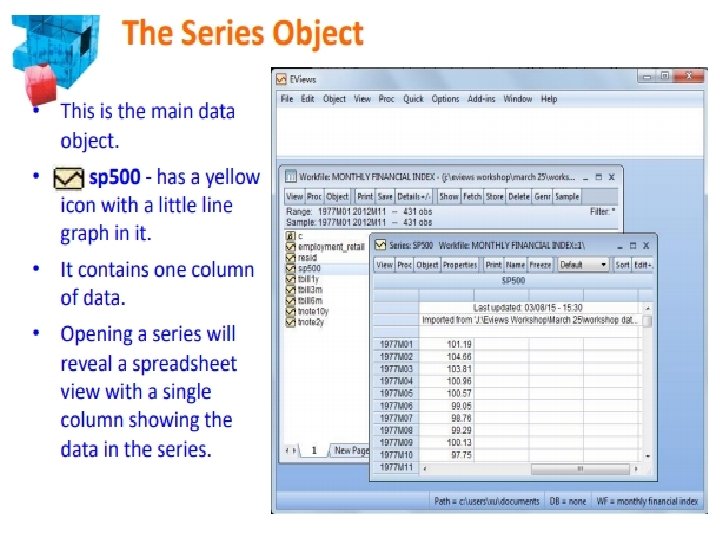
Workfiles and Objects • EViews does NOT open up with a “blank” generic document (unlike Word ®, Excel ®, etc. ). • EViews documents (“workfiles”) need to be created and are not generic (they will contain information about your data, etc. ). • EViews is an “object”- oriented program. Objects are collections of information related to a particular analysis (series, groups, equations, graphs, tables). • Workfiles are holders of these “objects”, it is the central place to keep all of your work.
Workfiles Operations • Any work in EViews is created in workfiles – which are placeholders of EViews objects. • Unlike other types of programs, an EViews workfile must be created. • Every workfile contains one or more workfile pages, each with its own objects. • To set-up a workfile, you can either: Create a “blank” workfile (this requires structuring); Create a workfile by reading from a foreign source.
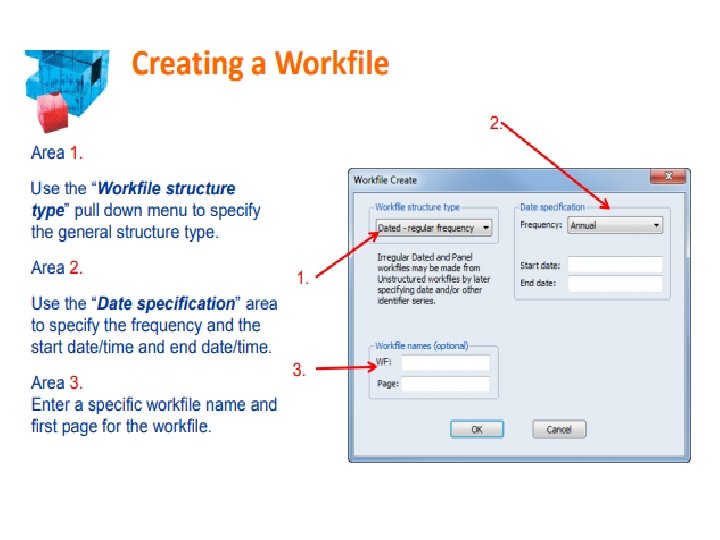
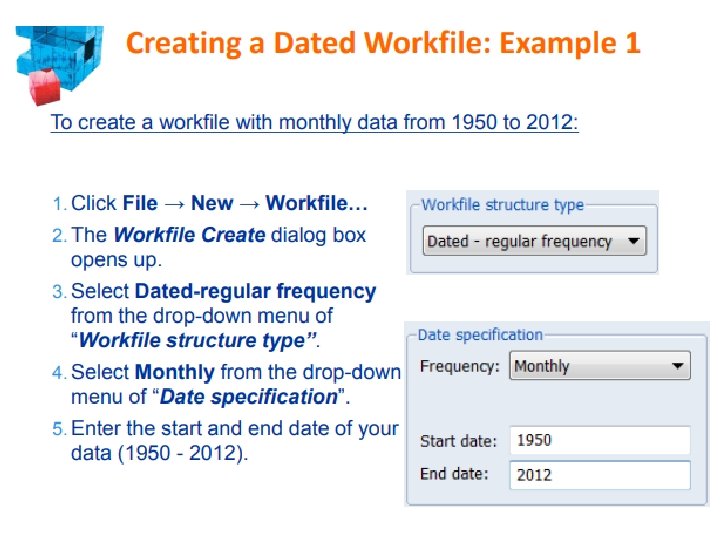
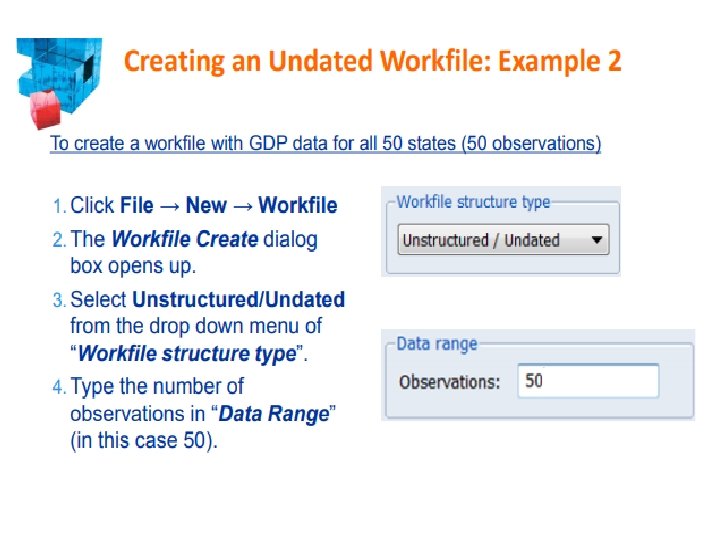
Creating a Workfile • Creating a ‘’blank’’ workfile – Main menu → File→ New → Workfile • Data Structure (Frequency, start/end dates, etc. ) The structure determines how many observations (i. e. rows) every series in the workfile page contains. There are three general types of workfile structure: 1. Time Series → Dated/Regular → Frequency + Date Range 2. Cross-Sectional → Undated/Unstructured → Range of observations 3. Balanced Panel (panel data) • Save & Name
Creating Workfiles Using Commands Example 1 Enter the following command into the command window, then press Enter wfcreate(wf=monthly, page=dated) m 1950 2012 The new workfile is named MONTHLY containing a single page named DATED, structured as a monthly workfile from 1950 -2012. Example 2 Enter the following command into the command window, then press Enter wfcreate(wf=undated, page=state) u 50 The new workfile is named UNDATED containing a single page named STATE, structured as undated workfile with 50 observations. Example 3 Enter the following command into the command window, then press Enter wfcreate(wf=panel, page=country) q 1950 2010 100 The new workfile is named PANEL containing a single page named COUNTRY structured as a panel workfile with 100 cross-sections of quarterly data from 1950 - 2010.
Creating Workfiles from foreign data source • EViews can create a new workfile by opening data from a variety of formats (Excel ®, HTML, CSV, ASCII, RATS, Stata, SPSS, SAS, etc…). • EViews automatically recognizes the format and structure of files. • Simply open the file in EViews and let the application do the rest. • There a number of ways to open a file in EViews: a) Click File → Open → Foreign Data as Workfile. b) Copy/Paste as New Workfile in EViews desktop.
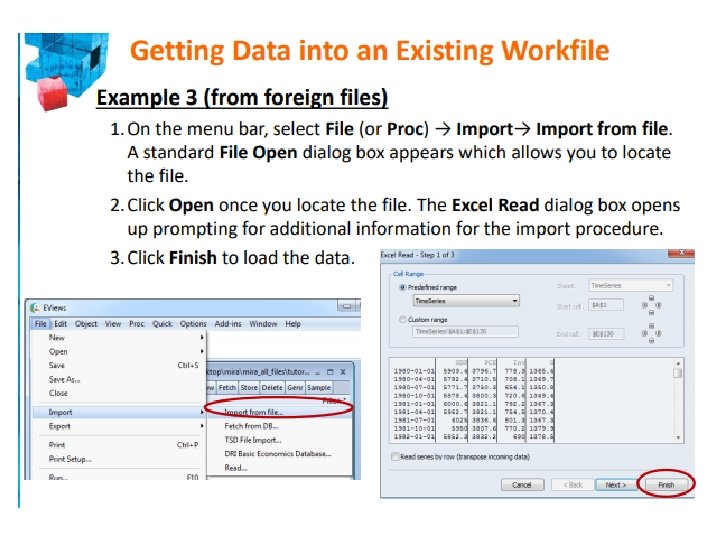
Importing Data: Example 1 1. Click File → Open → Foreign Data as Workfile. 2. Select the directory where data is stored and open file. 3. The Excel Read dialogue appears again. 4. Click Finish to load the data.
Copy/Paste: Example 2 1. Copy the source file (in this case the range of Excel rows). 2. Right-click anywhere on the EViews desktop. 3. Select Paste as New Workfile. 4. The Excel Read dialog appears; click Finish to load the data.
Importing Data by Command You can just as easily open a foreign source file in EViews by typing in the command window. 1. Enter the following command into the command window, then press Enter wfopen(page=test) ‘’c: test. xls’’ This creates a new workfile page named ‘’test’’. The second part of the command instructs Eviews where the file is located. 2. The Excel Read dialog appears again, then click Finish to load the data.
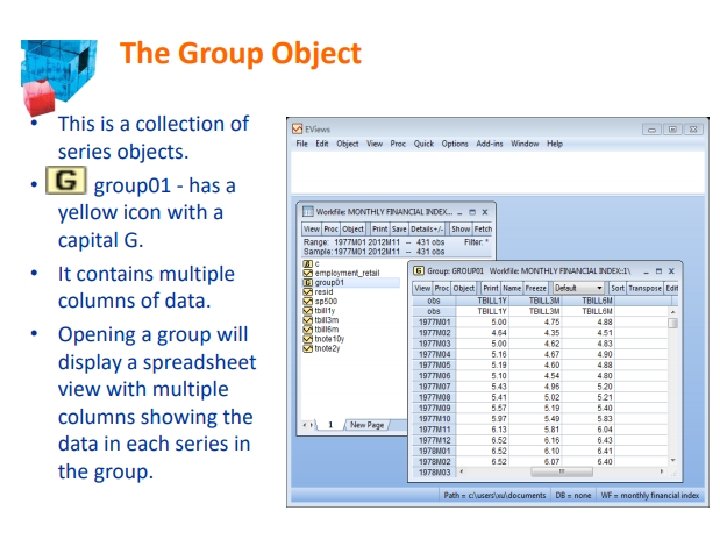
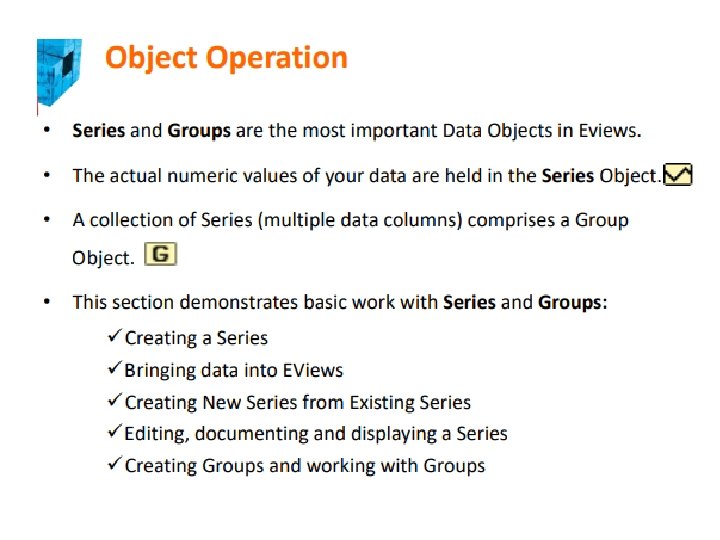
Groups • Groups help you work with multiple series. • A Group is a list of series names (and potentially mathematical expressions) that provides access to all the data in that list. • Once you create a Group Object, you can use the group name in many places to refer to all the series contained in that group. • A few features of groups: • A group is a “live” feed and is NOT a copy of each individual series. This means that if the data in one of the series changes, these changes will also be reflected in the group containing the series. • If a series is deleted from a workfile, the series identifier will be maintained. In the group spreadsheet the deleted series will contain NA values. • Renaming a series changes the reference in every group containing the series.
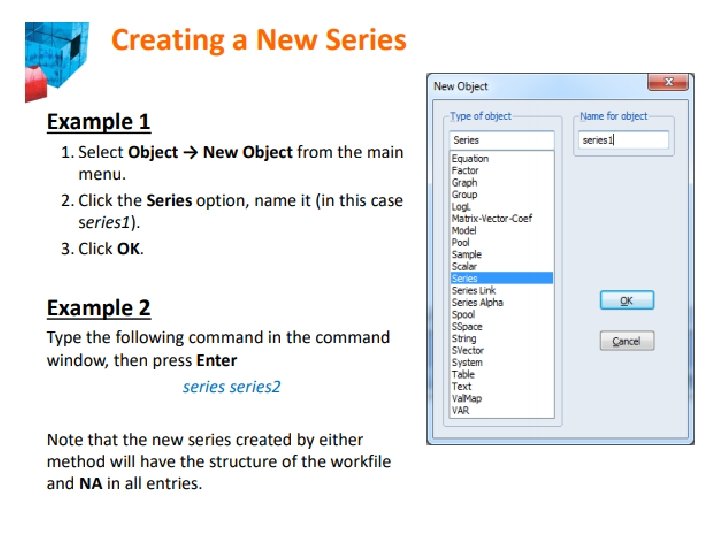
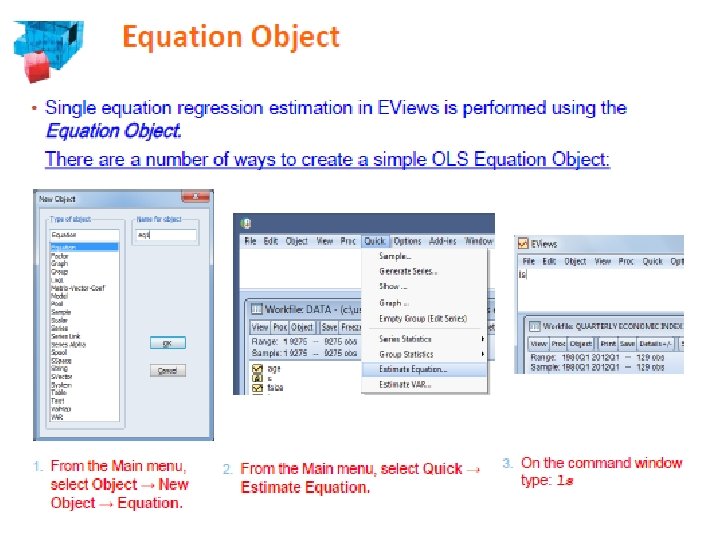
Creating Groups Example 1 1. Select Object → New Object from the main menu. 2. The New Object box opens up. Select the Group option. 3. You can name your group under the section Name for object (in this case, we named it group 01), then press OK. 4. The Series List window appears. Enter the series names you wish to include in the group (separated by spaces). Example 2 1. Select Quick → Show from the main menu (or Show from the workfile menu). 2. The Show window appears. Type here the names of the series you wish to include in the group 3. Press OK 4. Click Name button to save the group. 5. The Object Name box opens up, name the group here.
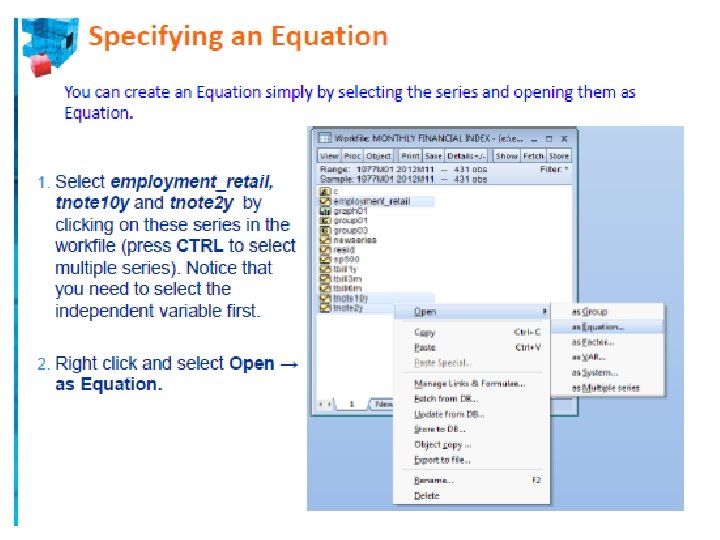
Creating Groups Example 3 1. Highlight the series you wish to group together. 2. Right click and select: Open → as Group 3. As before, Click Name button to save the group. 4. The Object Name box opens up, name the group. Example 4 Type the following command in the command window, then press Enter group 03 tbill 1 y tbill 3 m tbill 6 m This produces a group named ‘’group 03’’, which includes series tbill 1 y, tbill 3 m and tbill 6 m.
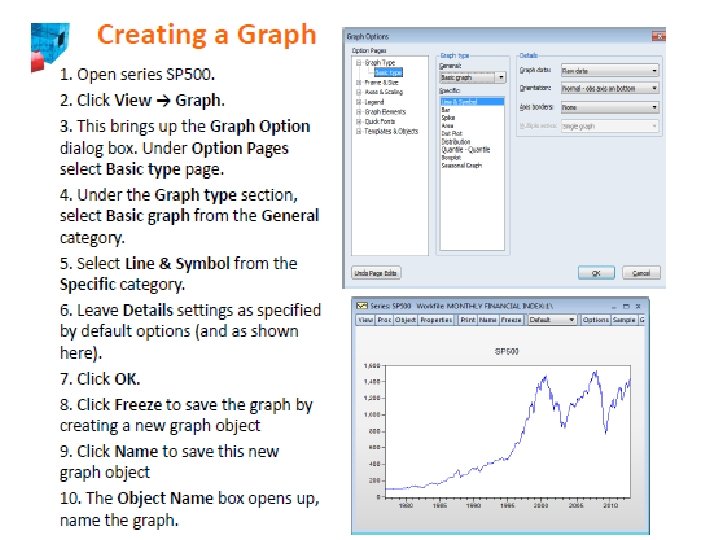
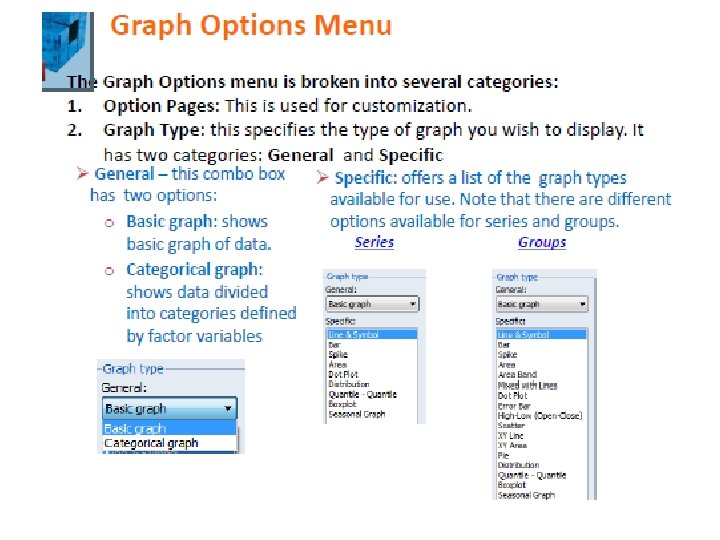
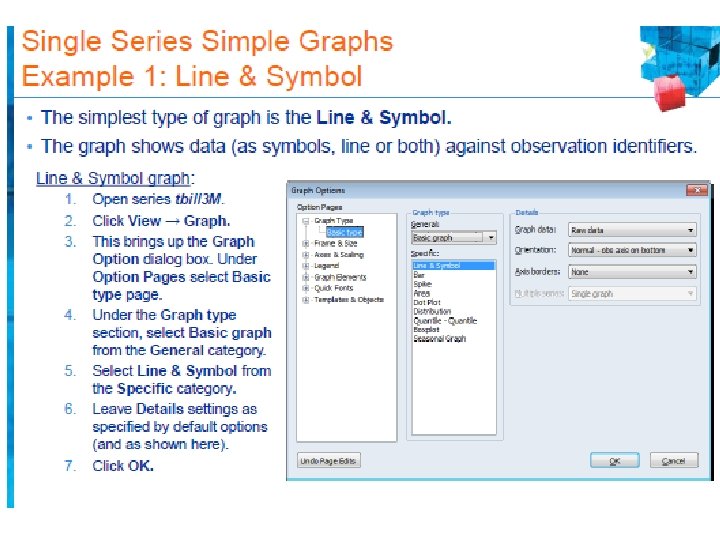
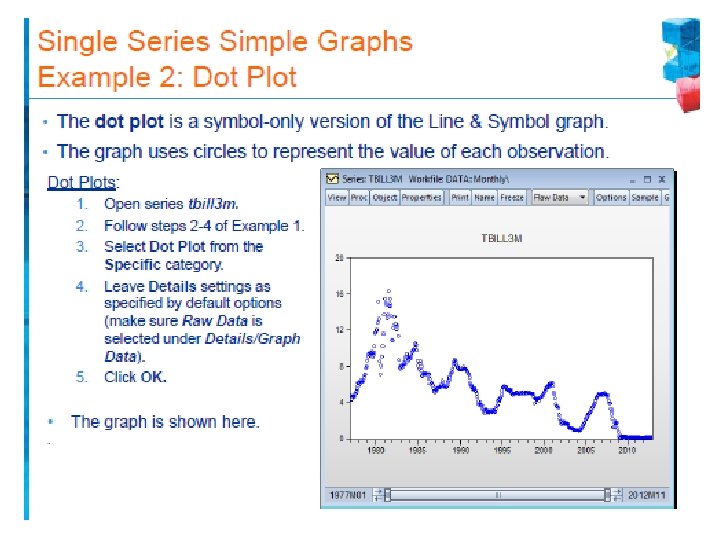
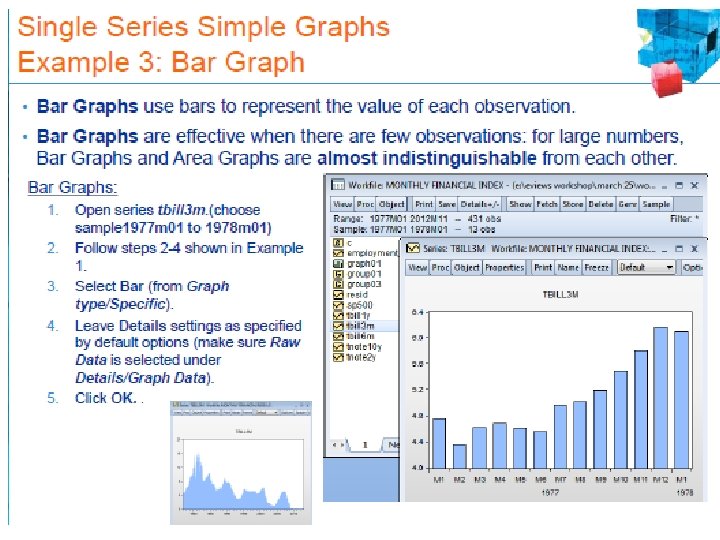
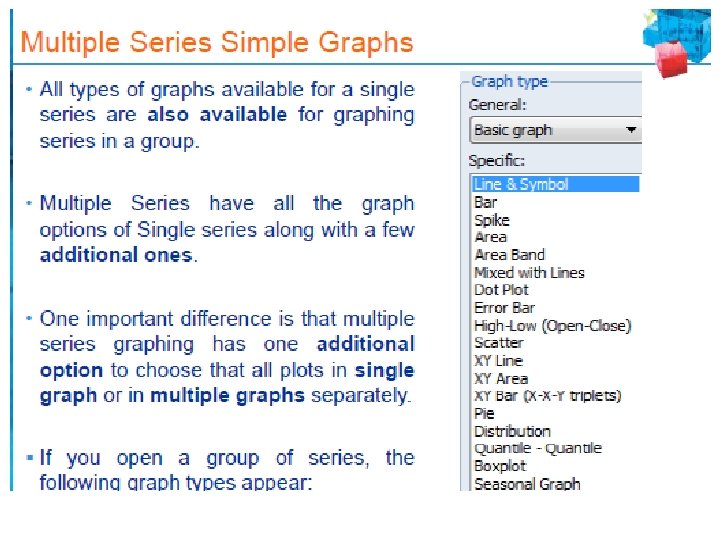
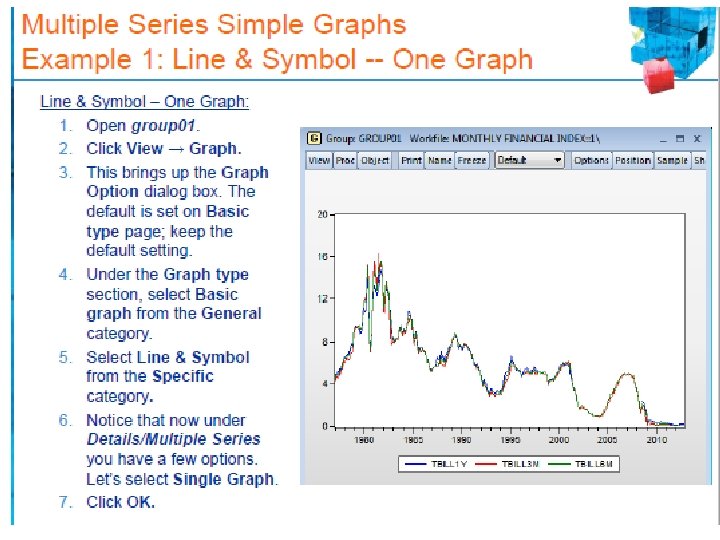
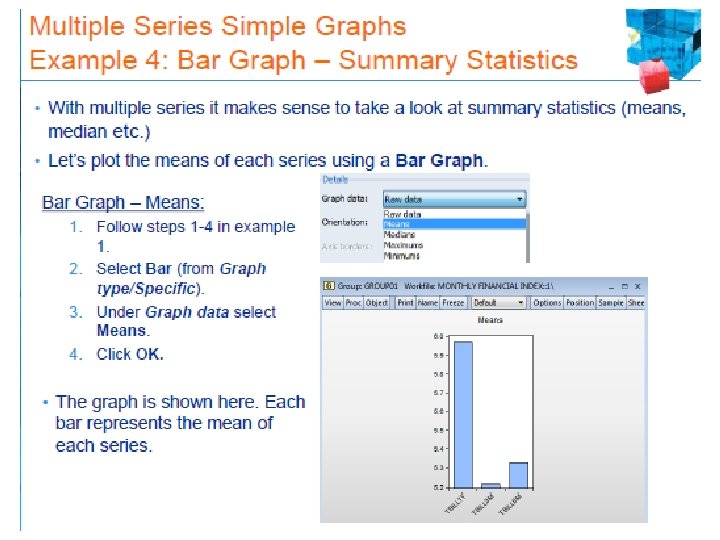
Graphing in Eviews • Graphing is an important part of the process of data analysis and presentation. • EViews provides a powerful, user friendly, full featured set of tools that will aid you in graphically displaying your information. • Today we focus only on basic graphing in EViews. The main topics are: • Graph Options and Graph Objects • Graphing Single Series • Graphing Multiple Series