
Introduction to Computer Science Lecture 6 MATLAB 5
Introduction to Computer Science Lecture 6 MATLAB (5) Graphics 1
CONTENTS 1. 3 D-Graph Dr. Eng. O. Bahbouh 2
![1. 3 D-GRAPH: : meshz & surfc ﺗﻌﻠﻴﻤﺔ ﺍﻟﺮﺳﻢ [X, Y] = meshgrid(-8: .](http://slidetodoc.com/presentation_image_h2/9bcf8b4c9d967ac45b318ca2a102143e/image-9.jpg "1. 3 D-GRAPH: : meshz & surfc ﺗﻌﻠﻴﻤﺔ ﺍﻟﺮﺳﻢ [X, Y] = meshgrid(-8: .")
1. 3 D-GRAPH: : meshz & surfc ﺗﻌﻠﻴﻤﺔ ﺍﻟﺮﺳﻢ [X, Y] = meshgrid(-8: . 5: 8); R = sqrt(X. ^2 + Y. ^2) + eps; meshc ﺃﻴﻀ ﺗﻌﻠﻴﻤﺔ . surfz ﻻ ﻳﻮﺟﺪ ﺗﻌﻠﻴﻤﺔ Z = sin(R). /R; ﻳﻮﺟﺪ ﻟﻜﻦ subplot(221); mesh(X, Y, Z) subplot(222); meshz(X, Y, Z) subplot(223); surf(X, Y, Z) subplot(224); surfc(X, Y, Z) Dr. Eng. O. Bahbouh 9
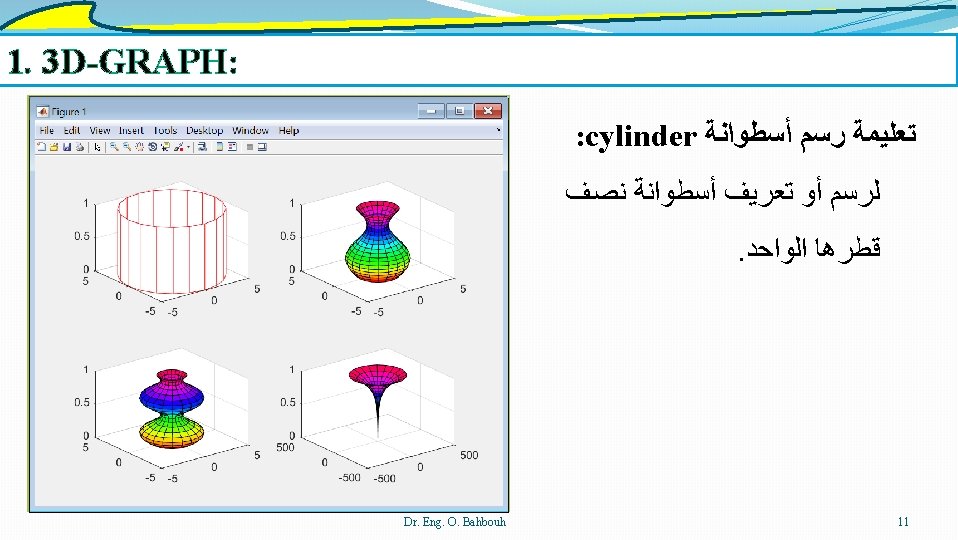
1. 3 D-GRAPH: : cylinder ﺗﻌﻠﻴﻤﺔ ﺭﺳﻢ ﺃﺴﻄﻮﺍﻧﺔ t = 0: pi/10: 2*pi; ﻟﺮﺳﻢ ﺃﻮ ﺗﻌﺮﻳﻒ ﺃﺴﻄﻮﺍﻧﺔ ﻧﺼﻒ [x, y, z] = cylinder(5); . ﻗﻄﺮﻫﺎ ﺍﻟﻮﺍﺣﺪ colormap hsv; subplot(221); mesh(x, y, z) subplot(222); cylinder(2+sin(t)); subplot(223); cylinder(2+sin(1. 9*t)); subplot(224); cylinder(sinh(t)); Dr. Eng. O. Bahbouh 11
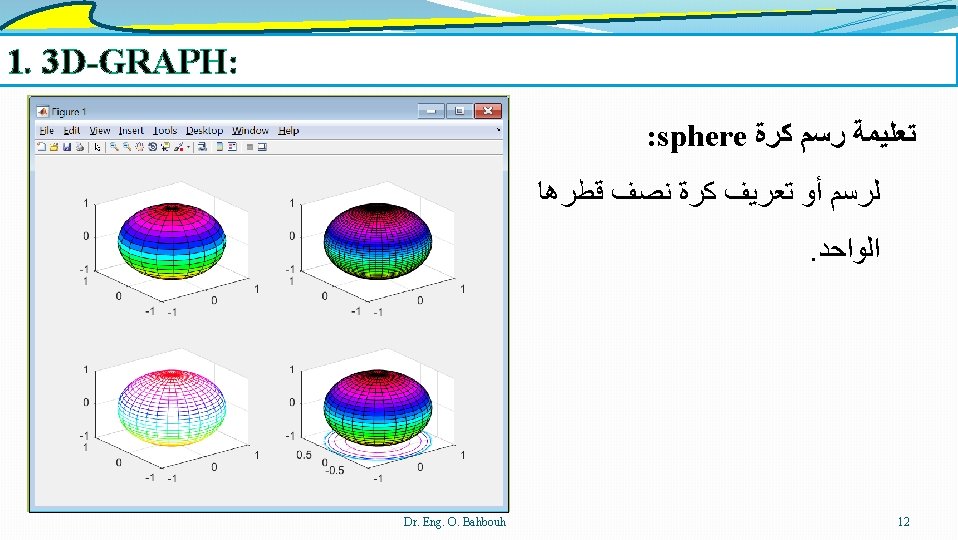
1. 3 D-GRAPH: : sphere ﺗﻌﻠﻴﻤﺔ ﺭﺳﻢ ﻛﺮﺓ colormap hsv; ﻟﺮﺳﻢ ﺃﻮ ﺗﻌﺮﻳﻒ ﻛﺮﺓ ﻧﺼﻒ ﻗﻄﺮﻫﺎ subplot(221); sphere; . ﺍﻟﻮﺍﺣﺪ subplot(222); sphere(50); [x, y, z] = sphere(30); subplot(223); mesh(x, y, z); subplot(224); surfc(x, y, z); Dr. Eng. O. Bahbouh 12
Dr. Eng. O. Bahbouh 13
- Slides: 13