
Introduction to Clustering Carla Brodley Tufts University Clustering
Introduction to Clustering Carla Brodley Tufts University
Clustering (Unsupervised Learning) Given: Examples: < x 1 , x 2 , … x n > Find: A natural clustering (grouping) of the data Example Applications: Identify similar energy use customer profiles <x> = time series of energy usage Identify anomalies in user behavior for computer security <x> = sequences of user commands
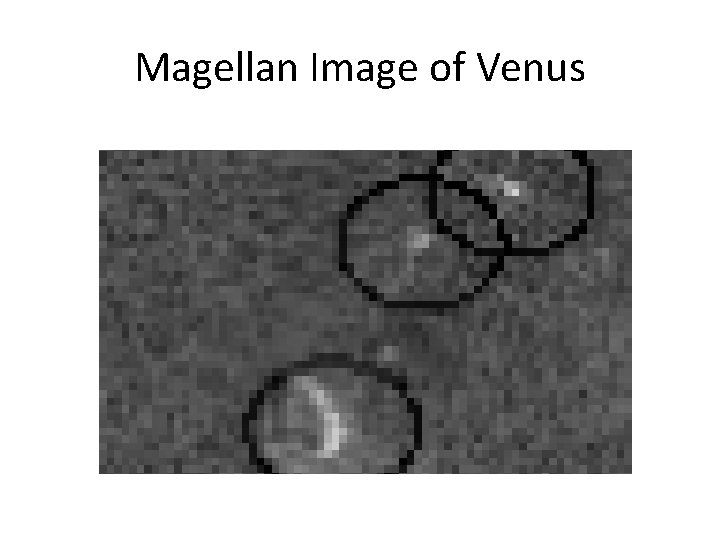
Magellan Image of Venus

Prototype Volcanoes
Why cluster? • Labeling is expensive • Gain insight into the structure of the data • Find prototypes in the data
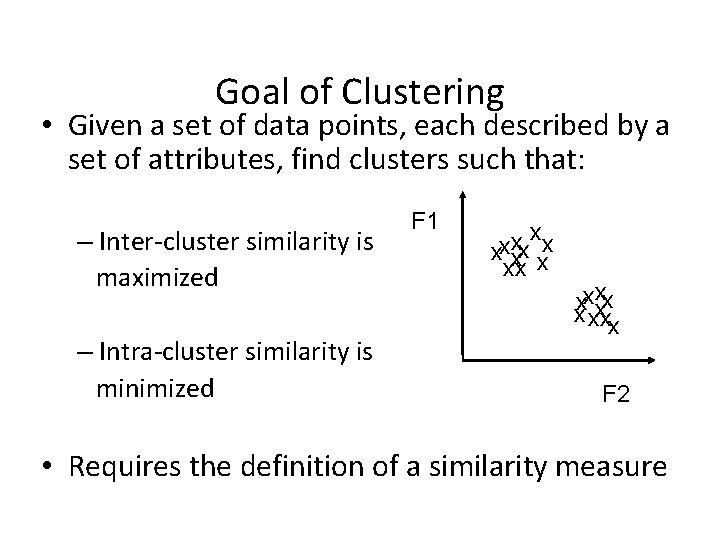
Goal of Clustering • Given a set of data points, each described by a set of attributes, find clusters such that: – Inter-cluster similarity is maximized – Intra-cluster similarity is minimized F 1 xx x xx x x x xx x F 2 • Requires the definition of a similarity measure
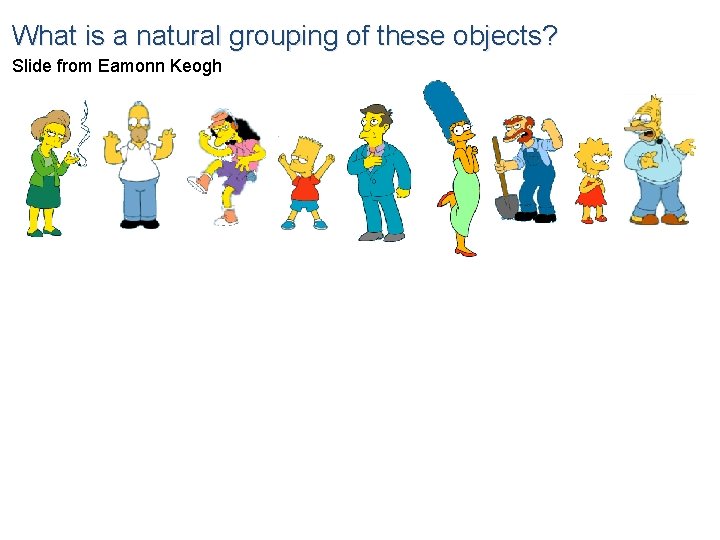
What is a natural grouping of these objects? Slide from Eamonn Keogh
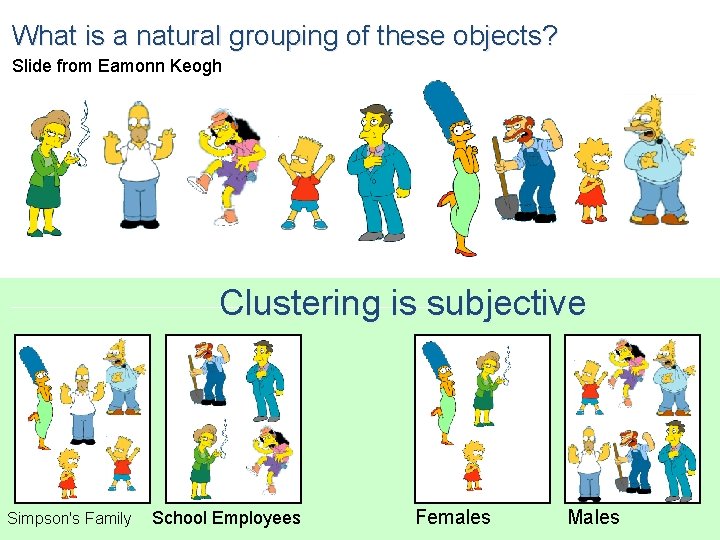
What is a natural grouping of these objects? Slide from Eamonn Keogh Clustering is subjective Simpson's Family School Employees Females Males
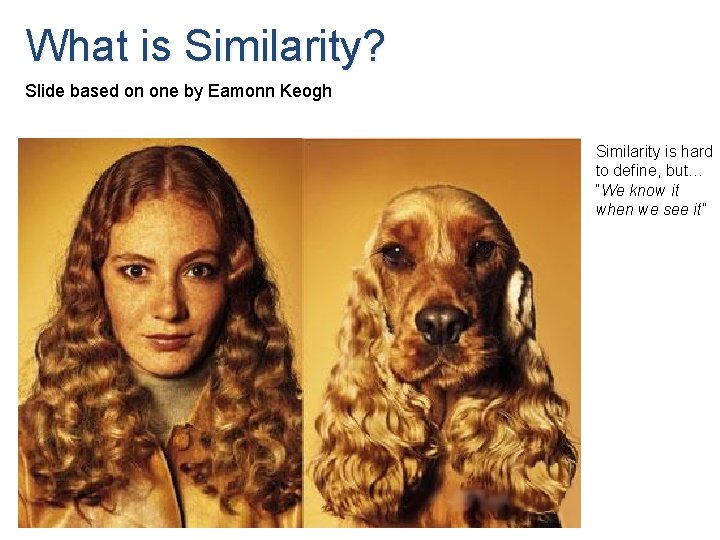
What is Similarity? Slide based on one by Eamonn Keogh Similarity is hard to define, but… “We know it when we see it”
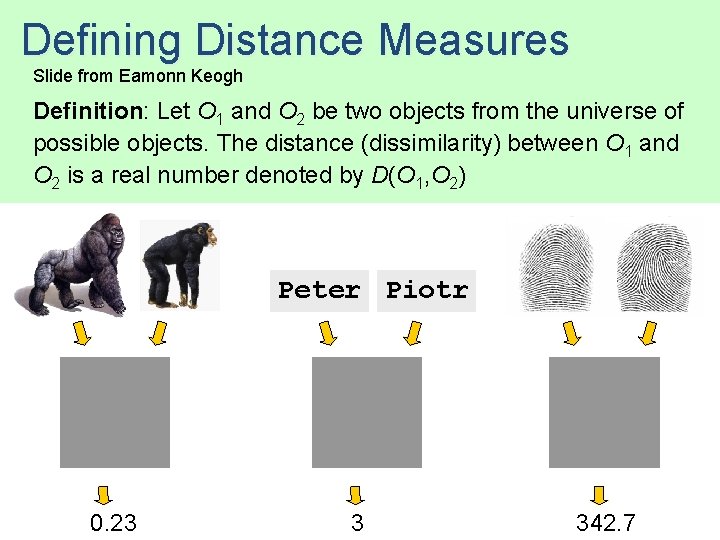
Defining Distance Measures Slide from Eamonn Keogh Definition: Let O 1 and O 2 be two objects from the universe of possible objects. The distance (dissimilarity) between O 1 and O 2 is a real number denoted by D(O 1, O 2) Peter Piotr 0. 23 3 342. 7
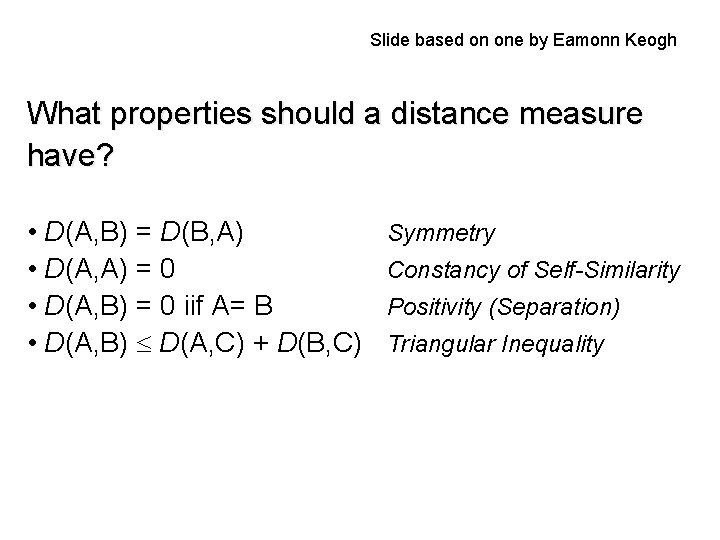
Slide based on one by Eamonn Keogh What properties should a distance measure have? • D(A, B) = D(B, A) • D(A, A) = 0 • D(A, B) = 0 iif A= B • D(A, B) D(A, C) + D(B, C) Symmetry Constancy of Self-Similarity Positivity (Separation) Triangular Inequality
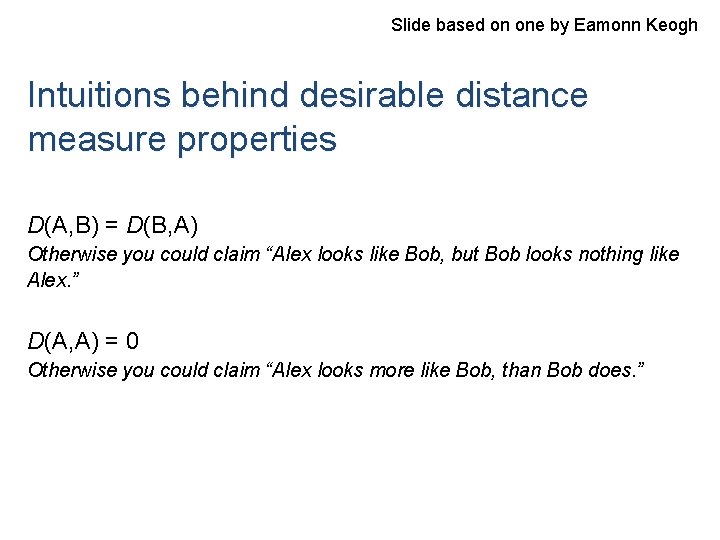
Slide based on one by Eamonn Keogh Intuitions behind desirable distance measure properties D(A, B) = D(B, A) Otherwise you could claim “Alex looks like Bob, but Bob looks nothing like Alex. ” D(A, A) = 0 Otherwise you could claim “Alex looks more like Bob, than Bob does. ”
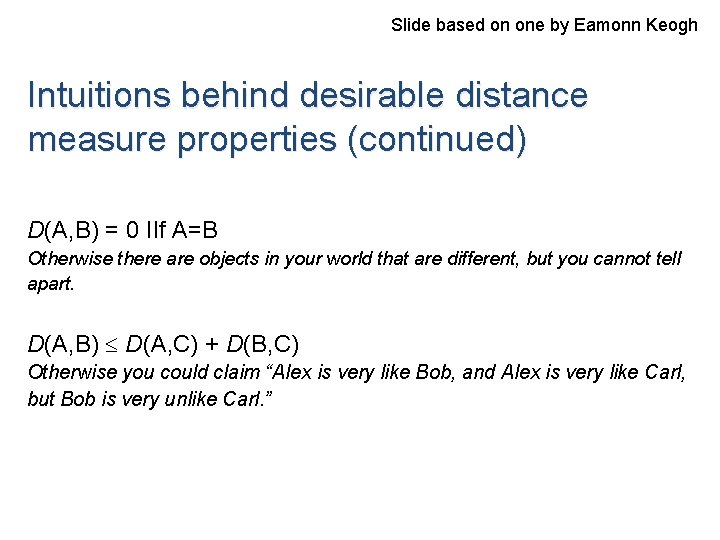
Slide based on one by Eamonn Keogh Intuitions behind desirable distance measure properties (continued) D(A, B) = 0 IIf A=B Otherwise there are objects in your world that are different, but you cannot tell apart. D(A, B) D(A, C) + D(B, C) Otherwise you could claim “Alex is very like Bob, and Alex is very like Carl, but Bob is very unlike Carl. ”
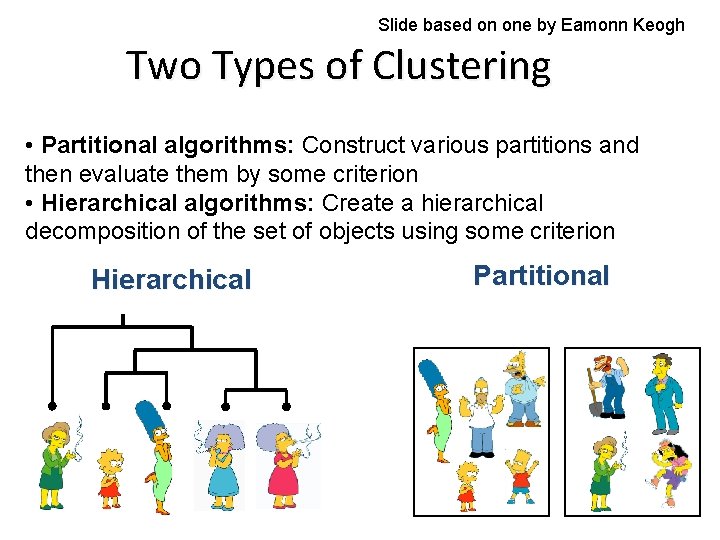
Slide based on one by Eamonn Keogh Two Types of Clustering • Partitional algorithms: Construct various partitions and then evaluate them by some criterion • Hierarchical algorithms: Create a hierarchical decomposition of the set of objects using some criterion Hierarchical Partitional
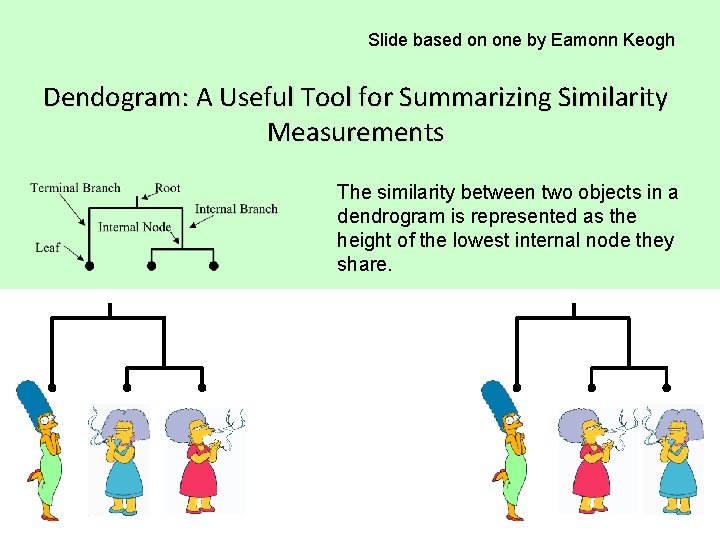
Slide based on one by Eamonn Keogh Dendogram: A Useful Tool for Summarizing Similarity Measurements The similarity between two objects in a dendrogram is represented as the height of the lowest internal node they share.
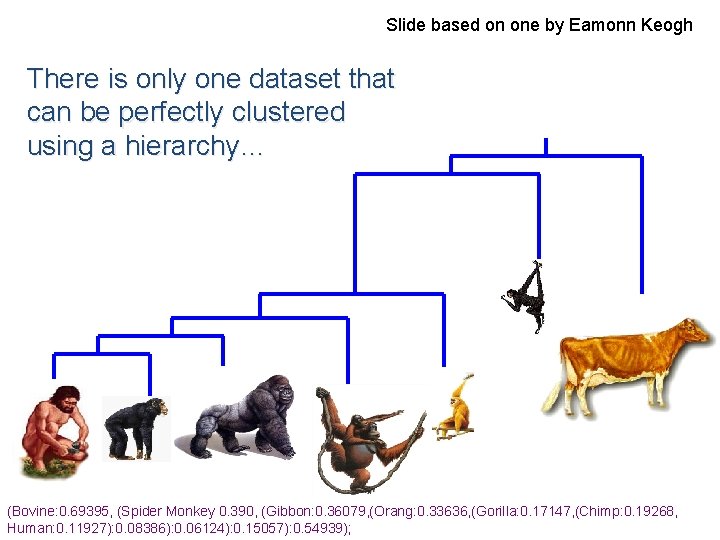
Slide based on one by Eamonn Keogh There is only one dataset that can be perfectly clustered using a hierarchy… (Bovine: 0. 69395, (Spider Monkey 0. 390, (Gibbon: 0. 36079, (Orang: 0. 33636, (Gorilla: 0. 17147, (Chimp: 0. 19268, Human: 0. 11927): 0. 08386): 0. 06124): 0. 15057): 0. 54939);
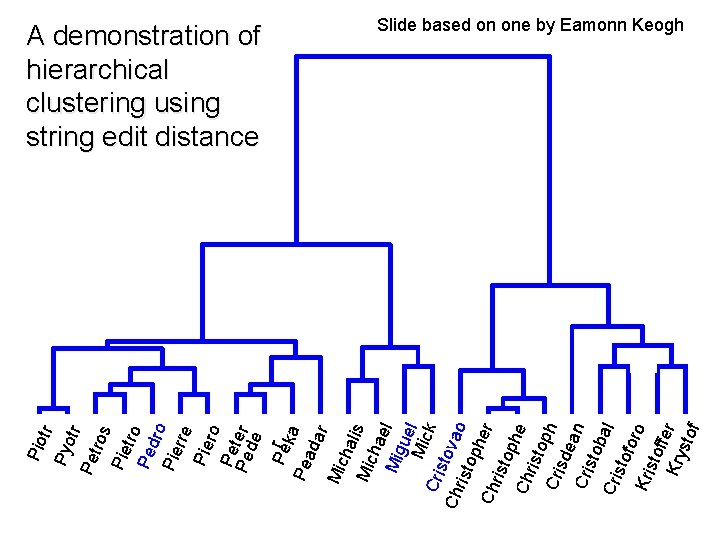
Pio tr Pyo tr Pe tros Pie tro Pe dro Pie rre Pie ro Pe Pedter e Per k Pe a ada r Mic hal Mic is hae Mig l uel Mic k Cri sto Ch v rist ao oph er Ch rist oph e Ch rist o Cri ph sde Cri an sto bal Cri sto foro Kri sto ff Kry er sto f A demonstration of hierarchical clustering using string edit distance Slide based on one by Eamonn Keogh
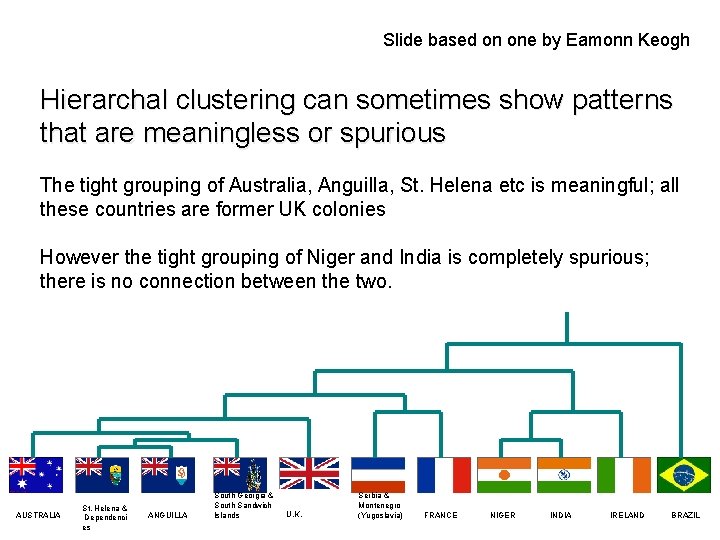
Slide based on one by Eamonn Keogh Hierarchal clustering can sometimes show patterns that are meaningless or spurious The tight grouping of Australia, Anguilla, St. Helena etc is meaningful; all these countries are former UK colonies However the tight grouping of Niger and India is completely spurious; there is no connection between the two. AUSTRALIA St. Helena & Dependenci es ANGUILLA South Georgia & South Sandwich Islands U. K. Serbia & Montenegro (Yugoslavia) FRANCE NIGER INDIA IRELAND BRAZIL
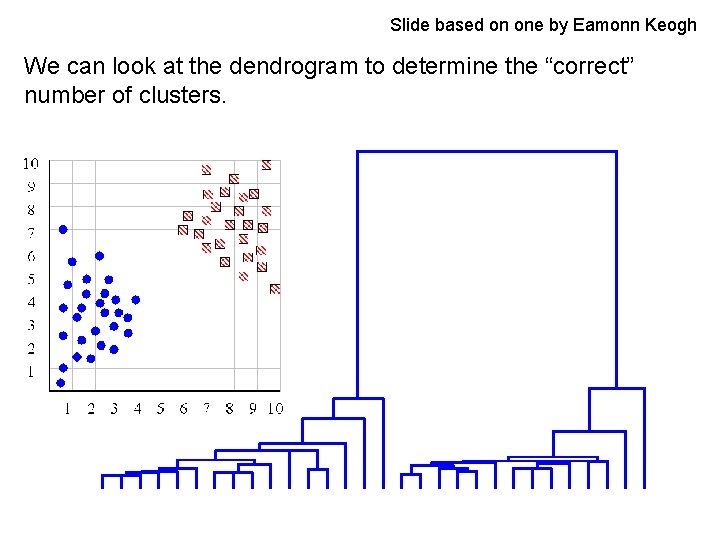
Slide based on one by Eamonn Keogh We can look at the dendrogram to determine the “correct” number of clusters.
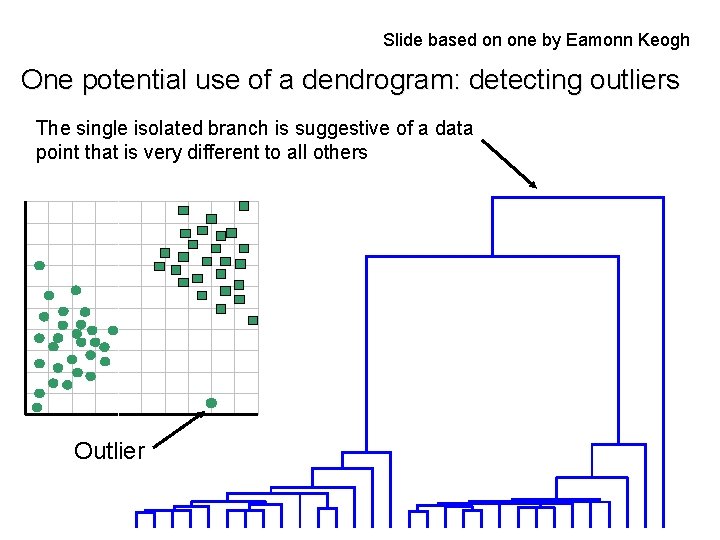
Slide based on one by Eamonn Keogh One potential use of a dendrogram: detecting outliers The single isolated branch is suggestive of a data point that is very different to all others Outlier
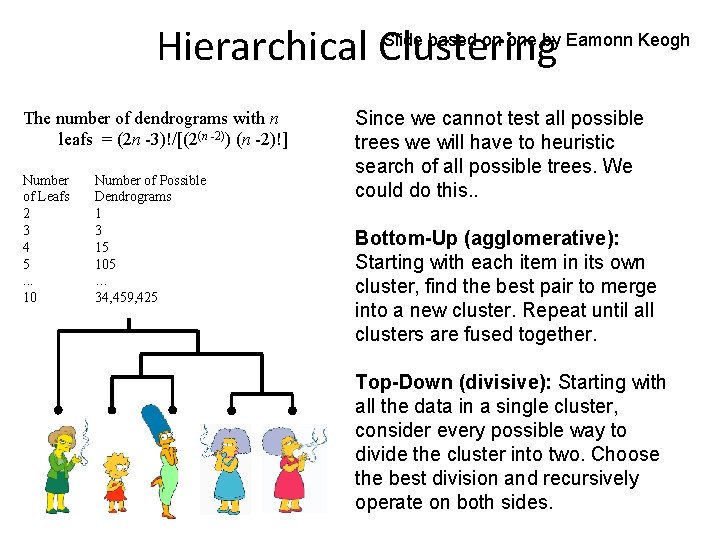
Slide based on one by Eamonn Keogh Hierarchical Clustering The number of dendrograms with n leafs = (2 n -3)!/[(2(n -2)) (n -2)!] Number of Leafs 2 3 4 5. . . 10 Number of Possible Dendrograms 1 3 15 105 … 34, 459, 425 Since we cannot test all possible trees we will have to heuristic search of all possible trees. We could do this. . Bottom-Up (agglomerative): Starting with each item in its own cluster, find the best pair to merge into a new cluster. Repeat until all clusters are fused together. Top-Down (divisive): Starting with all the data in a single cluster, consider every possible way to divide the cluster into two. Choose the best division and recursively operate on both sides.
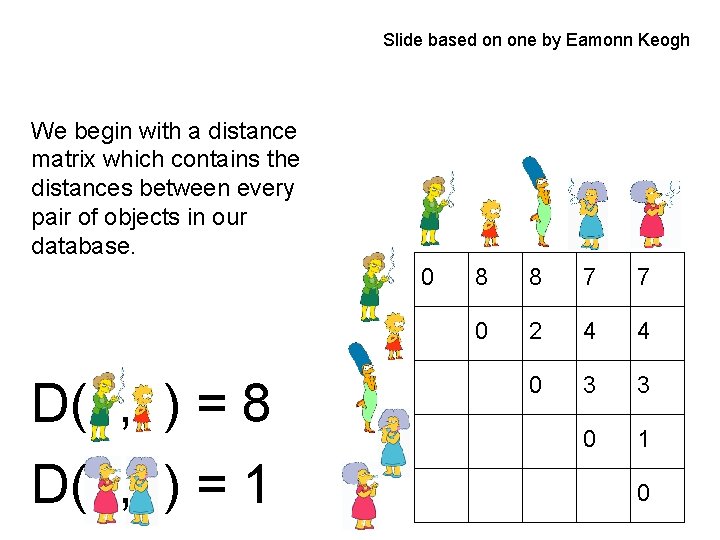
Slide based on one by Eamonn Keogh We begin with a distance matrix which contains the distances between every pair of objects in our database. 0 D( , ) = 8 D( , ) = 1 8 8 7 7 0 2 4 4 0 3 3 0 1 0
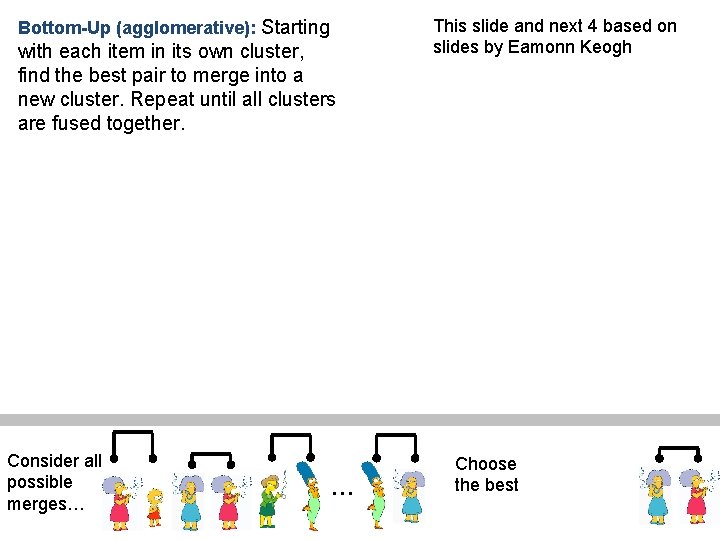
Bottom-Up (agglomerative): Starting with each item in its own cluster, find the best pair to merge into a new cluster. Repeat until all clusters are fused together. Consider all possible merges… … This slide and next 4 based on slides by Eamonn Keogh Choose the best
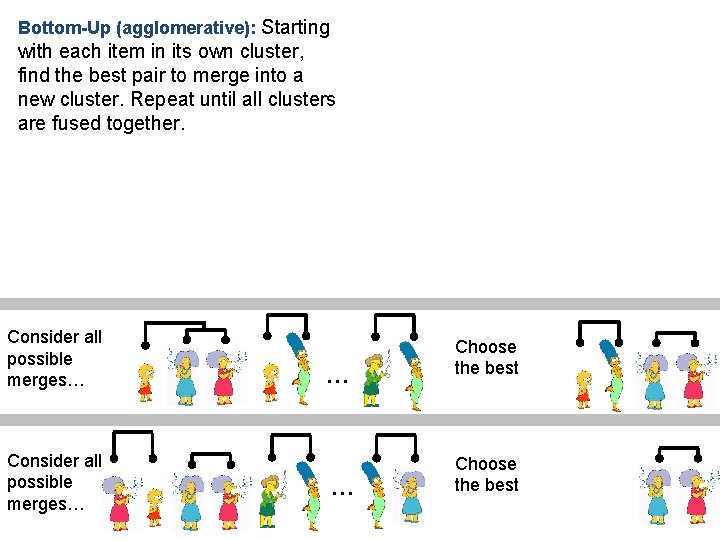
Bottom-Up (agglomerative): Starting with each item in its own cluster, find the best pair to merge into a new cluster. Repeat until all clusters are fused together. Consider all possible merges… … … Choose the best
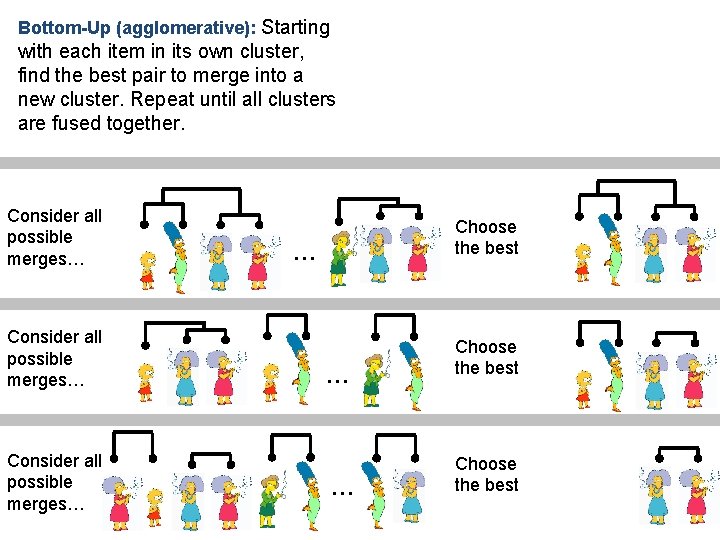
Bottom-Up (agglomerative): Starting with each item in its own cluster, find the best pair to merge into a new cluster. Repeat until all clusters are fused together. Consider all possible merges… Choose the best … … … Choose the best
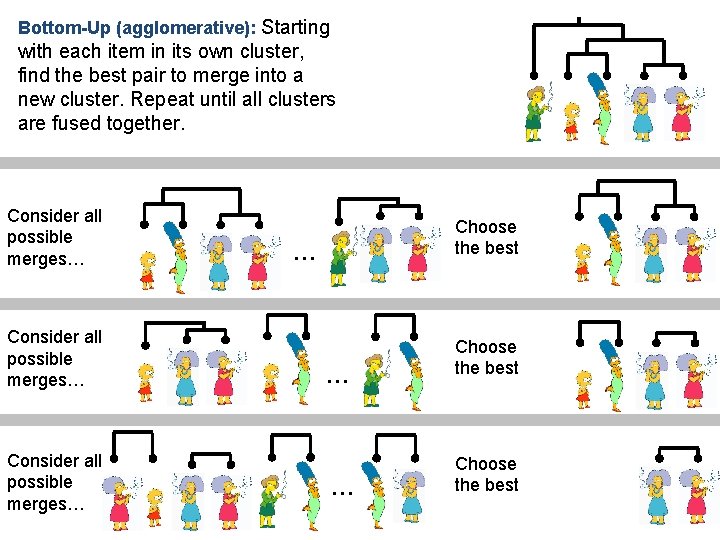
Bottom-Up (agglomerative): Starting with each item in its own cluster, find the best pair to merge into a new cluster. Repeat until all clusters are fused together. Consider all possible merges… Choose the best … … … Choose the best
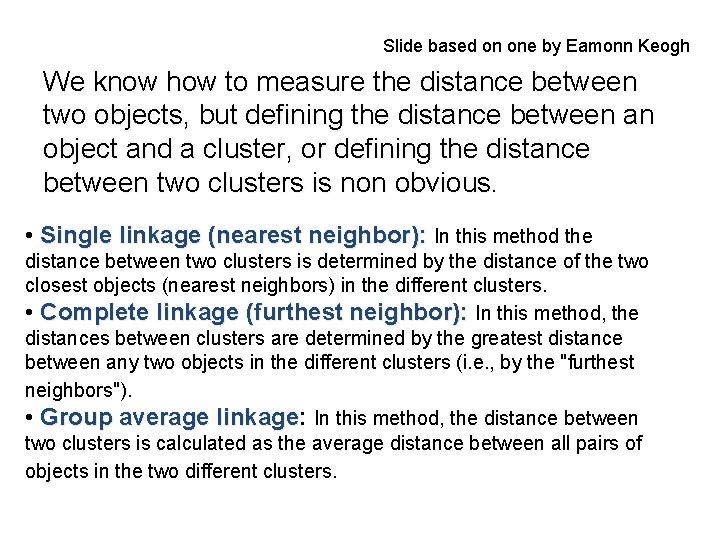
Slide based on one by Eamonn Keogh We know how to measure the distance between two objects, but defining the distance between an object and a cluster, or defining the distance between two clusters is non obvious. • Single linkage (nearest neighbor): In this method the distance between two clusters is determined by the distance of the two closest objects (nearest neighbors) in the different clusters. • Complete linkage (furthest neighbor): In this method, the distances between clusters are determined by the greatest distance between any two objects in the different clusters (i. e. , by the "furthest neighbors"). • Group average linkage: linkage In this method, the distance between two clusters is calculated as the average distance between all pairs of objects in the two different clusters.
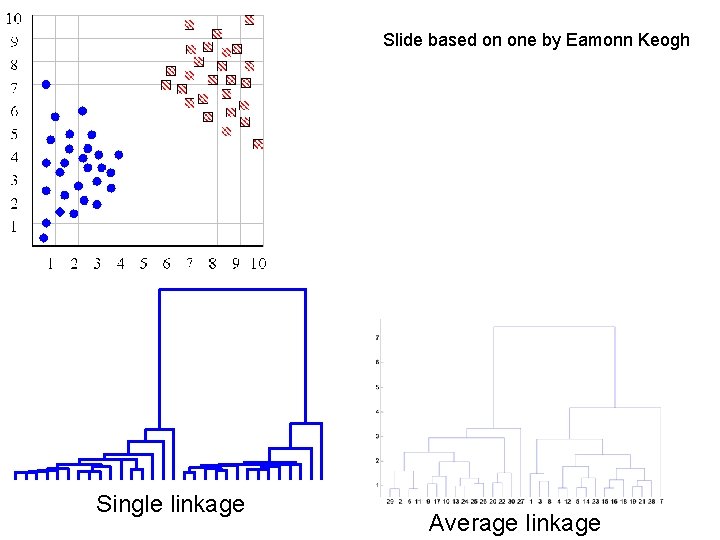
Slide based on one by Eamonn Keogh Single linkage Average linkage
Slide based on one by Eamonn Keogh Hierarchal Clustering Methods Summary § § § No need to specify the number of clusters in advance Hierarchal nature maps nicely onto human intuition for some domains They do not scale well: time complexity of at least O(n 2), where n is the number of total objects Like any heuristic search algorithms, local optima are a problem Interpretation of results is (very) subjective
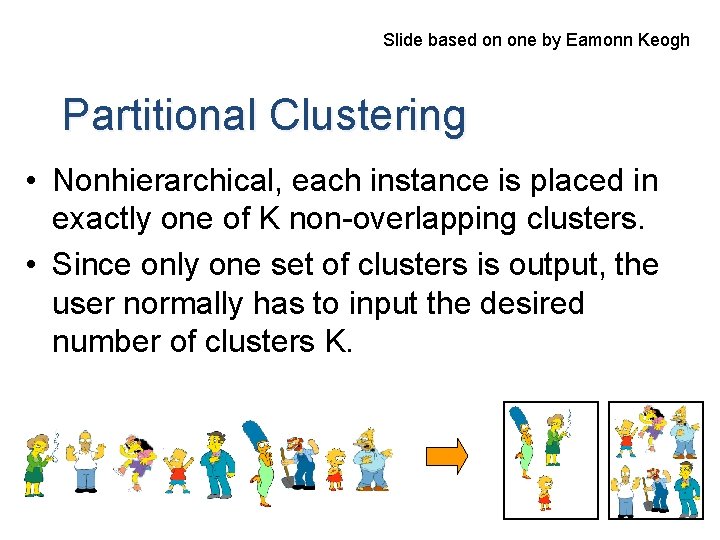
Slide based on one by Eamonn Keogh Partitional Clustering • Nonhierarchical, each instance is placed in exactly one of K non-overlapping clusters. • Since only one set of clusters is output, the user normally has to input the desired number of clusters K.
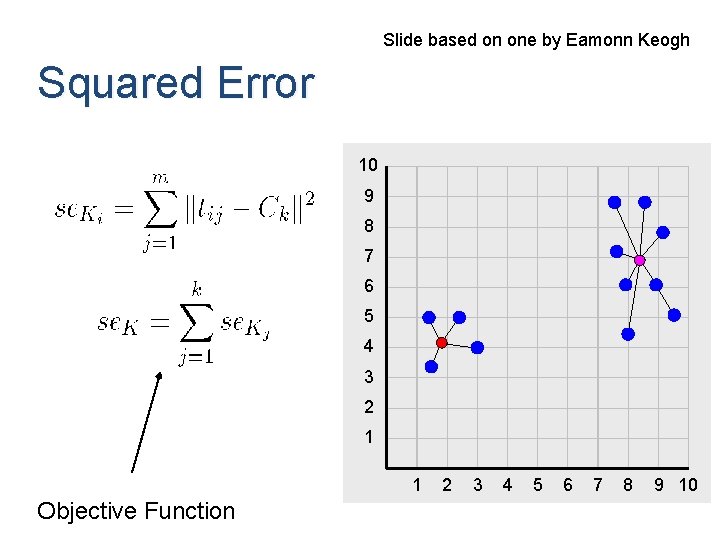
Slide based on one by Eamonn Keogh Squared Error 10 9 8 7 6 5 4 3 2 1 1 Objective Function 2 3 4 5 6 7 8 9 10
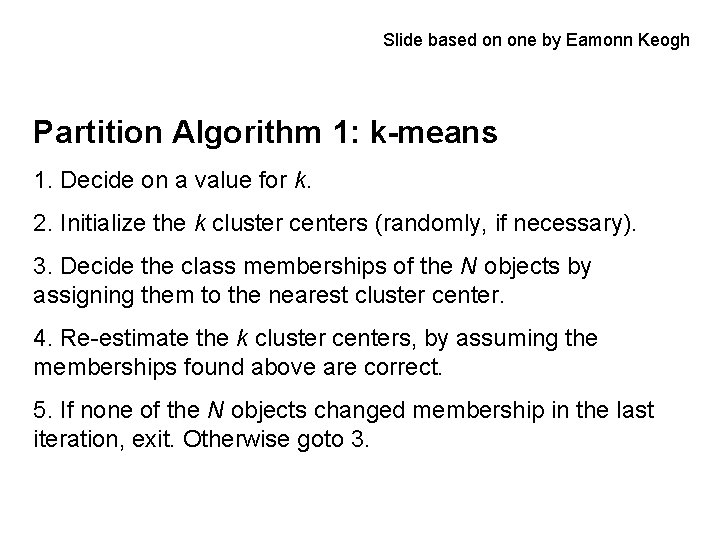
Slide based on one by Eamonn Keogh Partition Algorithm 1: k-means 1. Decide on a value for k. 2. Initialize the k cluster centers (randomly, if necessary). 3. Decide the class memberships of the N objects by assigning them to the nearest cluster center. 4. Re-estimate the k cluster centers, by assuming the memberships found above are correct. 5. If none of the N objects changed membership in the last iteration, exit. Otherwise goto 3.
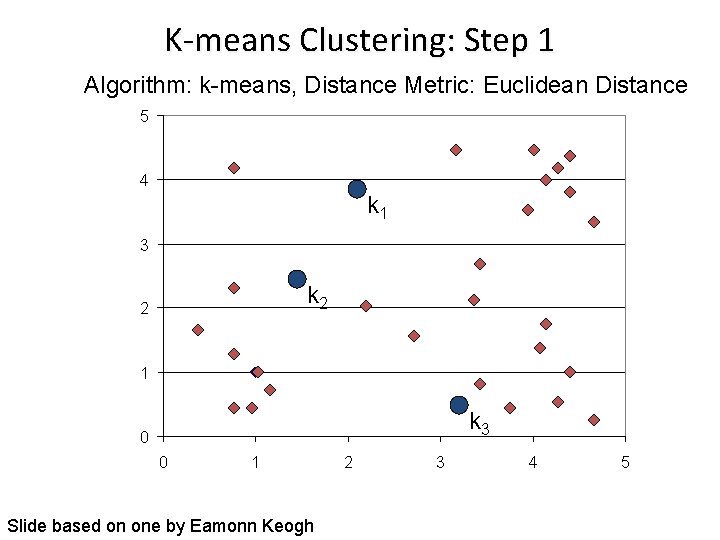
K-means Clustering: Step 1 Algorithm: k-means, Distance Metric: Euclidean Distance 5 4 k 1 3 k 2 2 1 k 3 0 0 1 Slide based on one by Eamonn Keogh 2 3 4 5
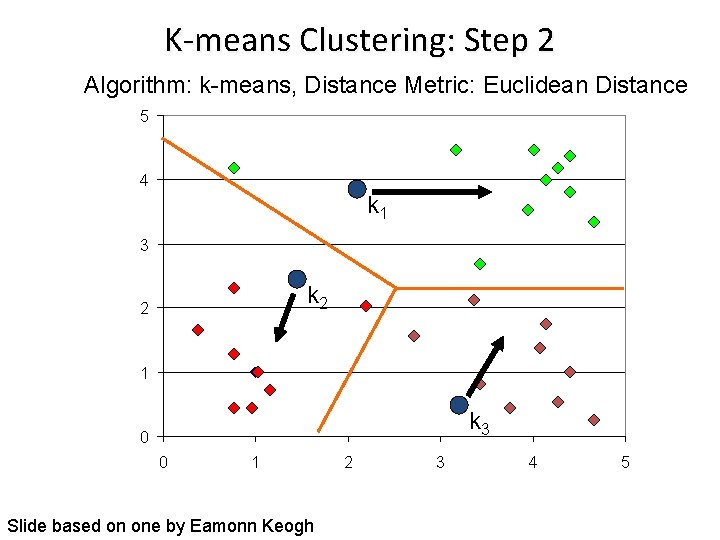
K-means Clustering: Step 2 Algorithm: k-means, Distance Metric: Euclidean Distance 5 4 k 1 3 k 2 2 1 k 3 0 0 1 Slide based on one by Eamonn Keogh 2 3 4 5
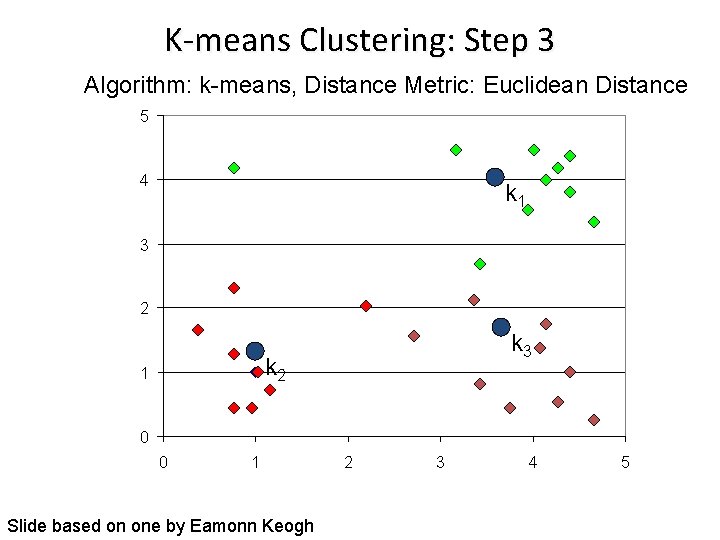
K-means Clustering: Step 3 Algorithm: k-means, Distance Metric: Euclidean Distance 5 4 k 1 3 2 k 3 k 2 1 0 0 1 Slide based on one by Eamonn Keogh 2 3 4 5
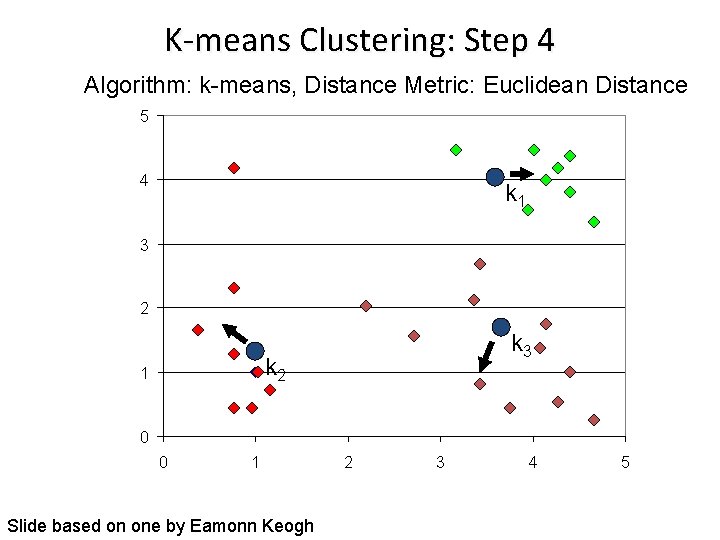
K-means Clustering: Step 4 Algorithm: k-means, Distance Metric: Euclidean Distance 5 4 k 1 3 2 k 3 k 2 1 0 0 1 Slide based on one by Eamonn Keogh 2 3 4 5
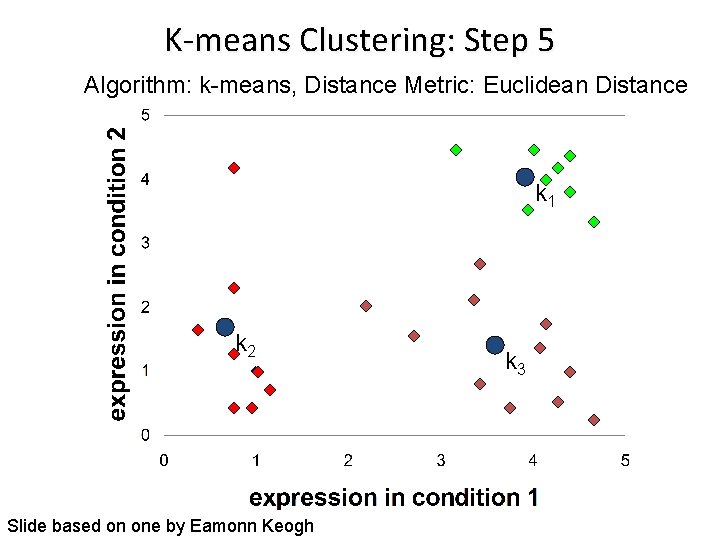
K-means Clustering: Step 5 Algorithm: k-means, Distance Metric: Euclidean Distance k 1 k 2 Slide based on one by Eamonn Keogh k 3
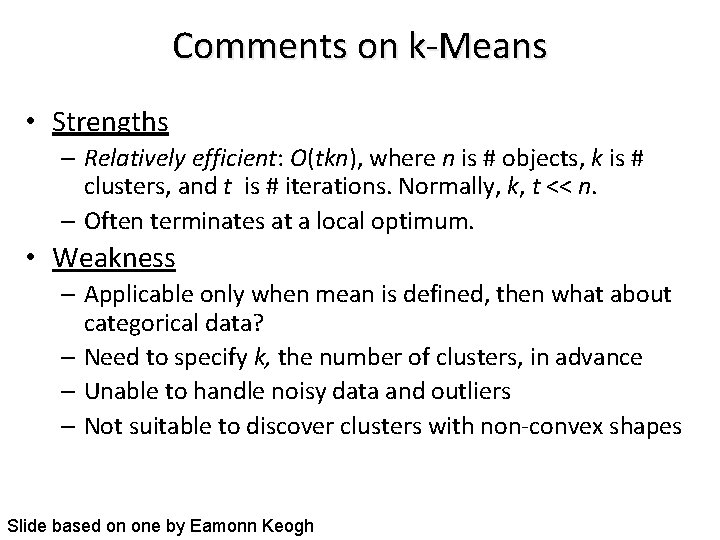
Comments on k-Means • Strengths – Relatively efficient: O(tkn), where n is # objects, k is # clusters, and t is # iterations. Normally, k, t << n. – Often terminates at a local optimum. • Weakness – Applicable only when mean is defined, then what about categorical data? – Need to specify k, the number of clusters, in advance – Unable to handle noisy data and outliers – Not suitable to discover clusters with non-convex shapes Slide based on one by Eamonn Keogh
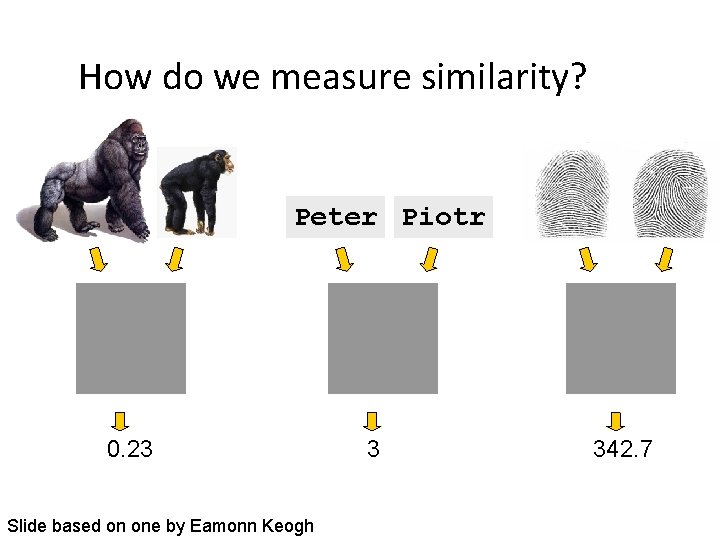
How do we measure similarity? Peter Piotr 0. 23 Slide based on one by Eamonn Keogh 3 342. 7
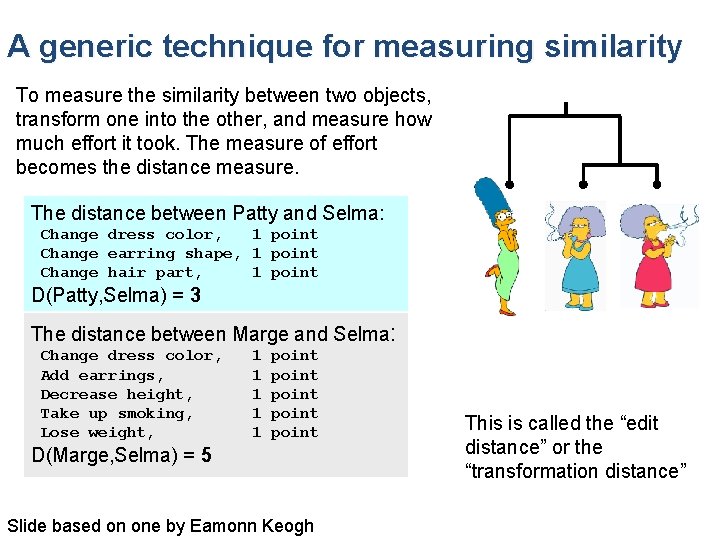
A generic technique for measuring similarity To measure the similarity between two objects, transform one into the other, and measure how much effort it took. The measure of effort becomes the distance measure. The distance between Patty and Selma: Change dress color, 1 point Change earring shape, 1 point Change hair part, 1 point D(Patty, Selma) = 3 The distance between Marge and Selma: Change dress color, Add earrings, Decrease height, Take up smoking, Lose weight, 1 1 1 point point D(Marge, Selma) = 5 Slide based on one by Eamonn Keogh This is called the “edit distance” or the “transformation distance”
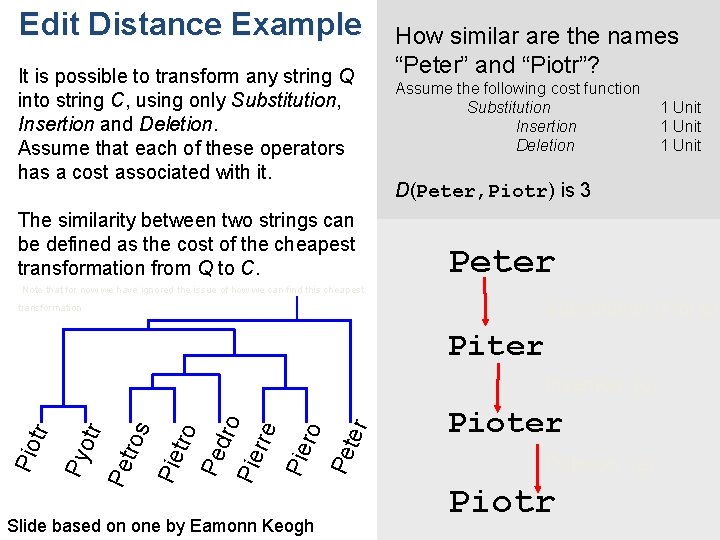
Edit Distance Example It is possible to transform any string Q into string C, using only Substitution, Insertion and Deletion. Assume that each of these operators has a cost associated with it. The similarity between two strings can be defined as the cost of the cheapest transformation from Q to C. How similar are the names “Peter” and “Piotr”? Assume the following cost function Substitution Insertion Deletion 1 Unit D(Peter, Piotr) is 3 Peter Note that for now we have ignored the issue of how we can find this cheapest Substitution (i for e) transformation Piter Slide based on one by Eamonn Keogh Pe ter tro Pe dro Pie rre Pie ro Pie Pe tros tr Pyo Pio tr Insertion (o) Pioter Deletion (e) Piotr
What distance metric did k-means use? What assumptions is it making about the data?
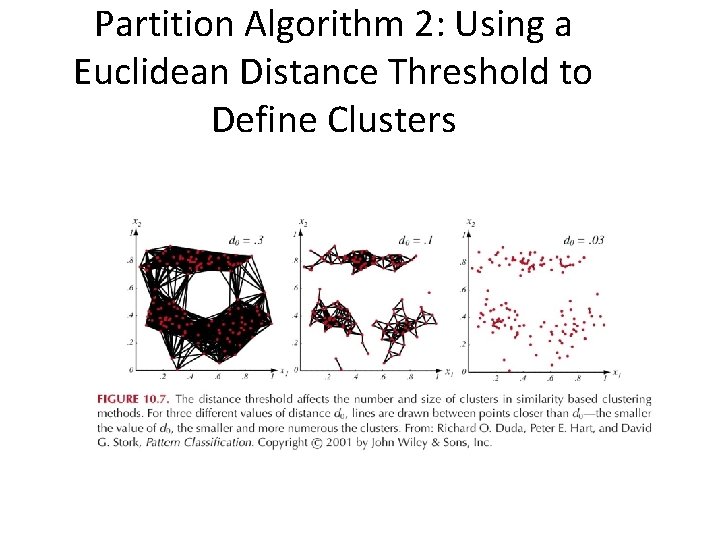
Partition Algorithm 2: Using a Euclidean Distance Threshold to Define Clusters
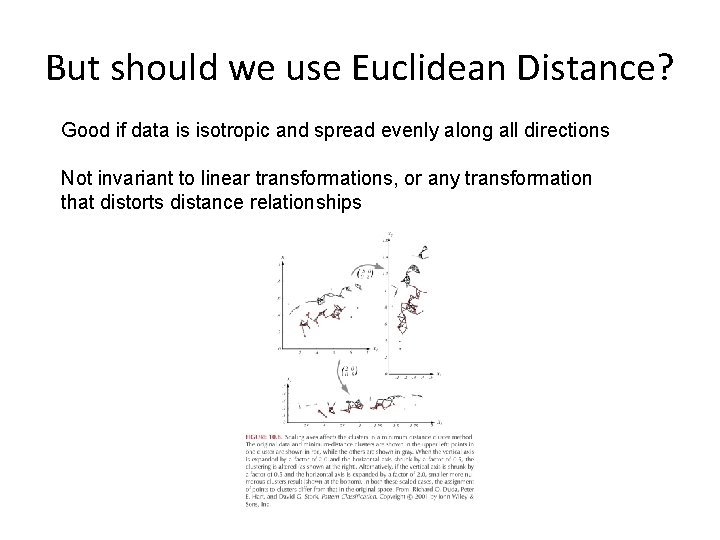
But should we use Euclidean Distance? Good if data is isotropic and spread evenly along all directions Not invariant to linear transformations, or any transformation that distorts distance relationships
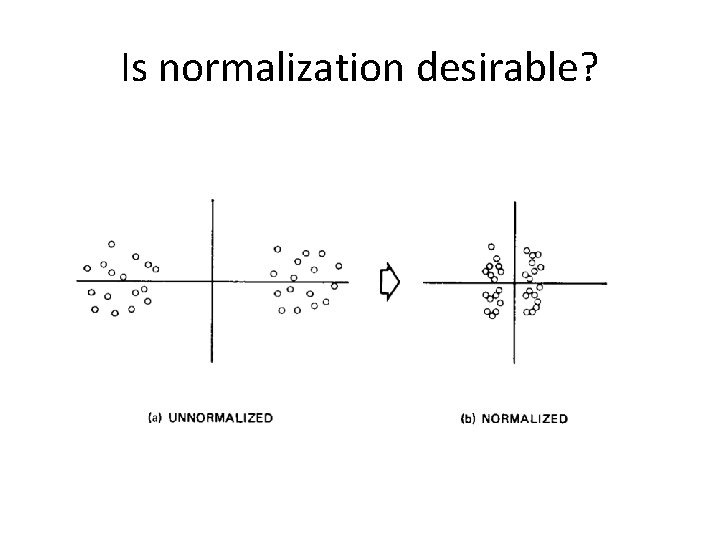
Is normalization desirable?
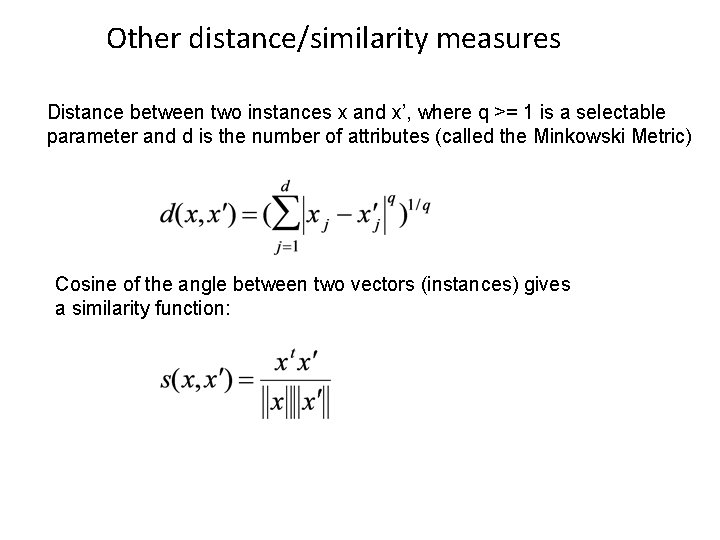
Other distance/similarity measures Distance between two instances x and x’, where q >= 1 is a selectable parameter and d is the number of attributes (called the Minkowski Metric) Cosine of the angle between two vectors (instances) gives a similarity function:
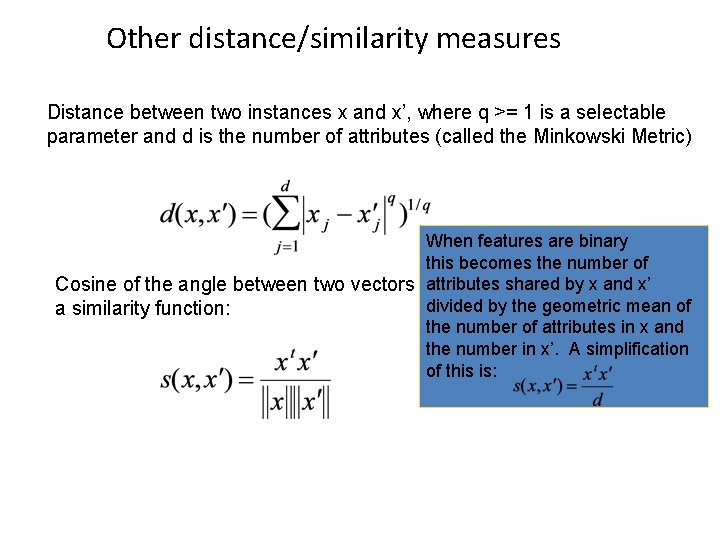
Other distance/similarity measures Distance between two instances x and x’, where q >= 1 is a selectable parameter and d is the number of attributes (called the Minkowski Metric) When features are binary this becomes the number of attributes shared Cosine of the angle between two vectors (instances) givesby x and x’ divided by the geometric mean of a similarity function: the number of attributes in x and the number in x’. A simplification of this is:
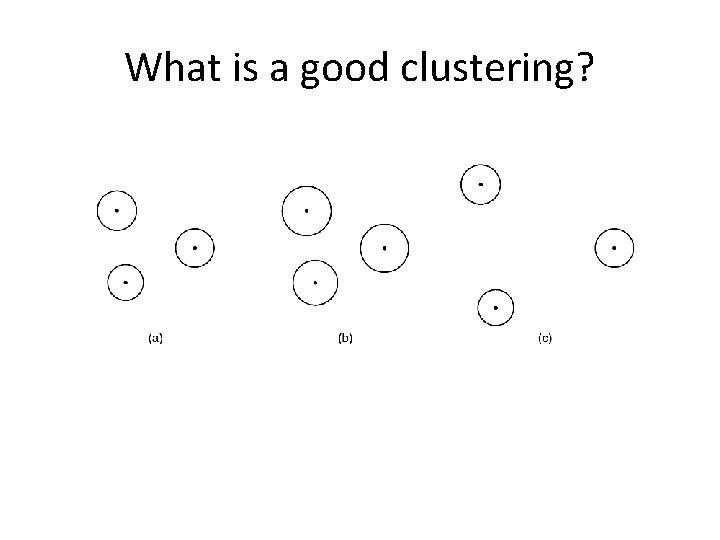
What is a good clustering?
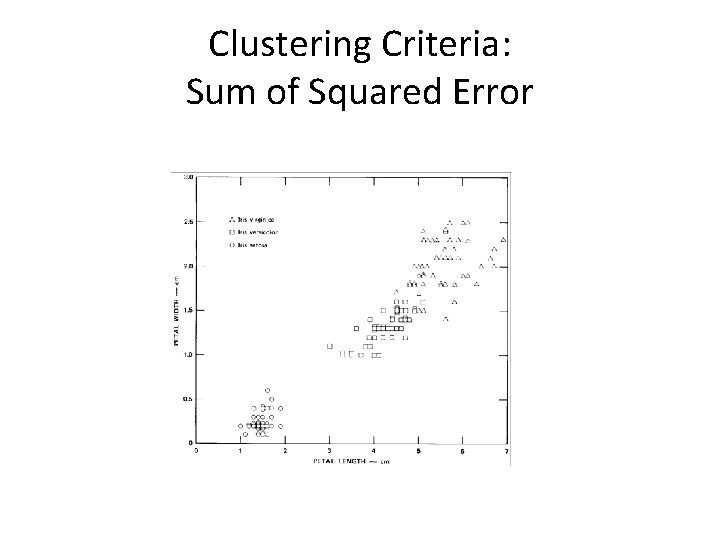
Clustering Criteria: Sum of Squared Error
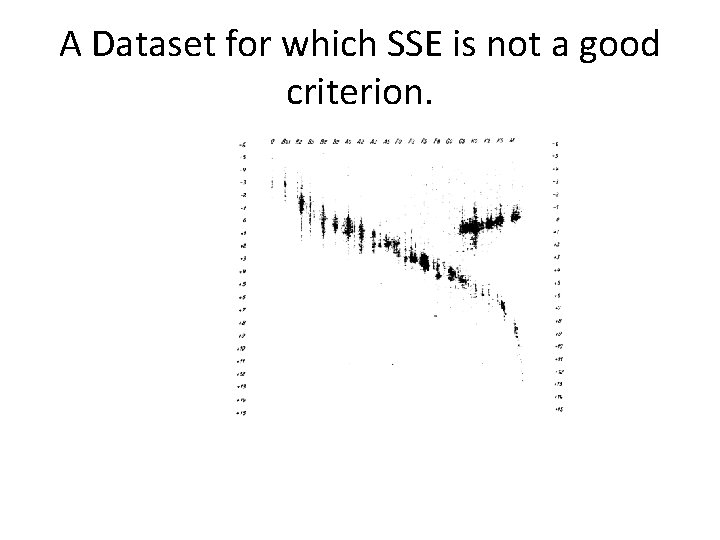
A Dataset for which SSE is not a good criterion.
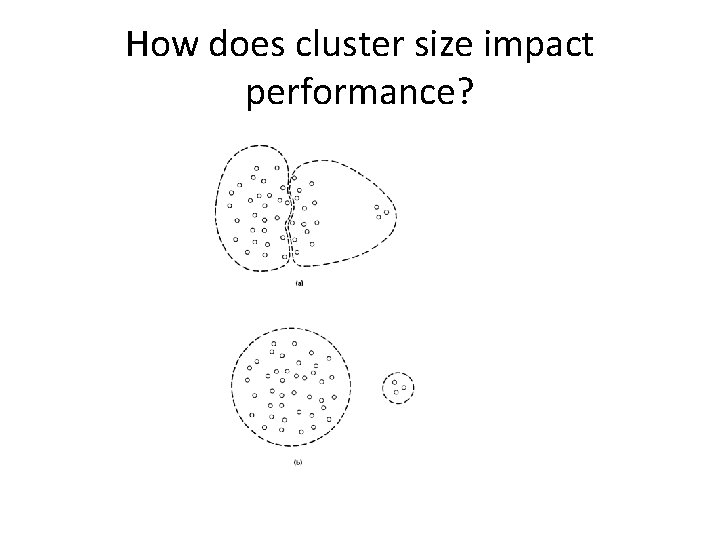
How does cluster size impact performance?
Scattering Criteria – on board
To apply partitional clustering we need to: § Select features to characterize the data § Collect representative data § Choose a clustering algorithm § Specify the number of clusters
Um, what about k? • Idea 1: Use our new trick of cross validation to select k – What should we optimize? SSE? Trace? – Problem? • Idea 2: Let our domain expert look at the clustering and decide if they like it – How should we show this to them? – Problem? • Idea 3: The “knee” solution
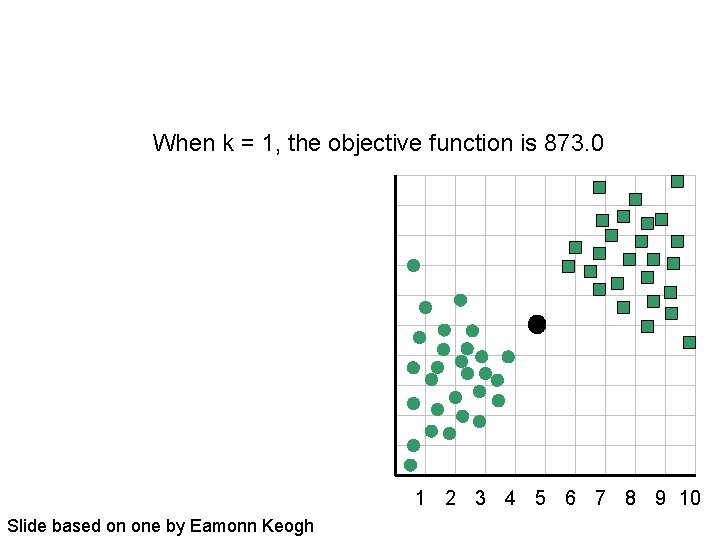
When k = 1, the objective function is 873. 0 1 2 3 4 5 6 7 8 9 10 Slide based on one by Eamonn Keogh
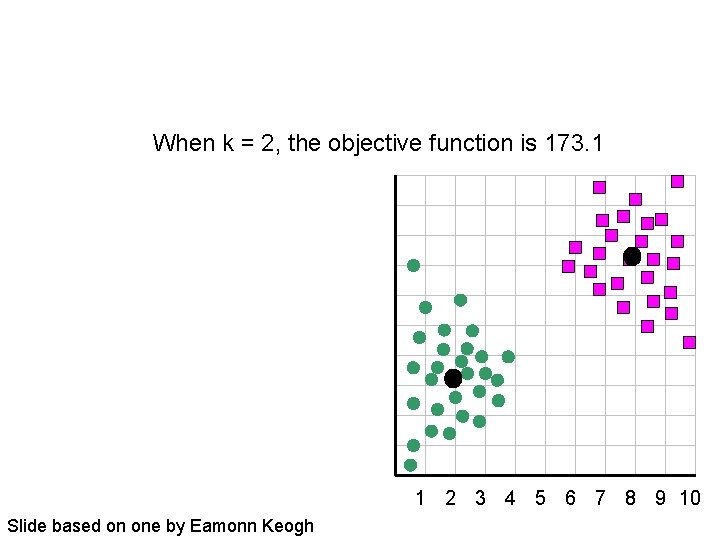
When k = 2, the objective function is 173. 1 1 2 3 4 5 6 7 8 9 10 Slide based on one by Eamonn Keogh
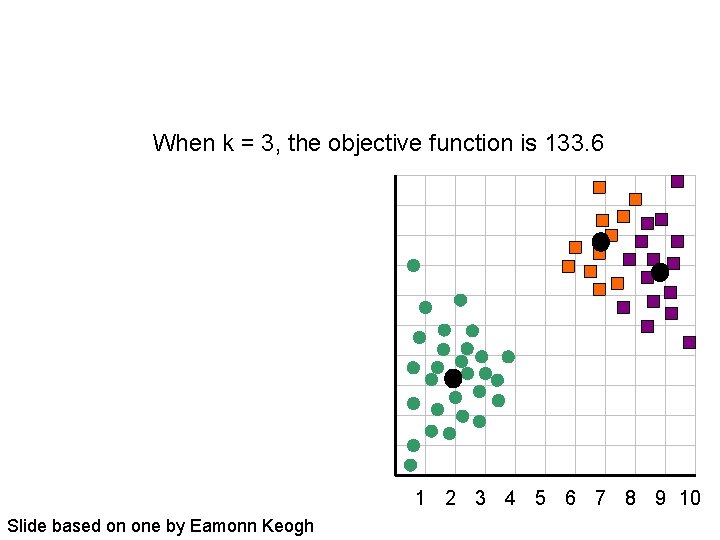
When k = 3, the objective function is 133. 6 1 2 3 4 5 6 7 8 9 10 Slide based on one by Eamonn Keogh
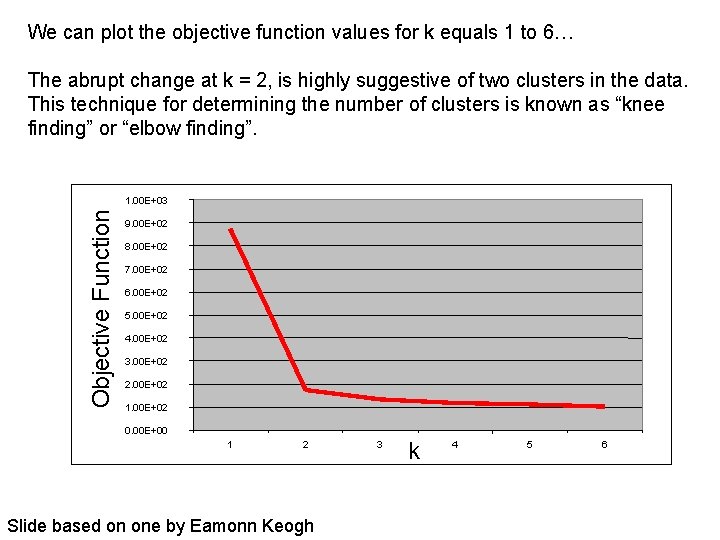
We can plot the objective function values for k equals 1 to 6… The abrupt change at k = 2, is highly suggestive of two clusters in the data. This technique for determining the number of clusters is known as “knee finding” or “elbow finding”. Objective Function 1. 00 E+03 9. 00 E+02 8. 00 E+02 7. 00 E+02 6. 00 E+02 5. 00 E+02 4. 00 E+02 3. 00 E+02 2. 00 E+02 1. 00 E+02 0. 00 E+00 1 2 Slide based on one by Eamonn Keogh 3 k 4 5 6
High-Dimensional Data poses Problems for Clustering • Difficult to find true clusters – Irrelevant and redundant features – All points are equally close • Solutions: Dimension Reduction – Feature subset selection – Cluster ensembles using random projection (in a later lecture…. )
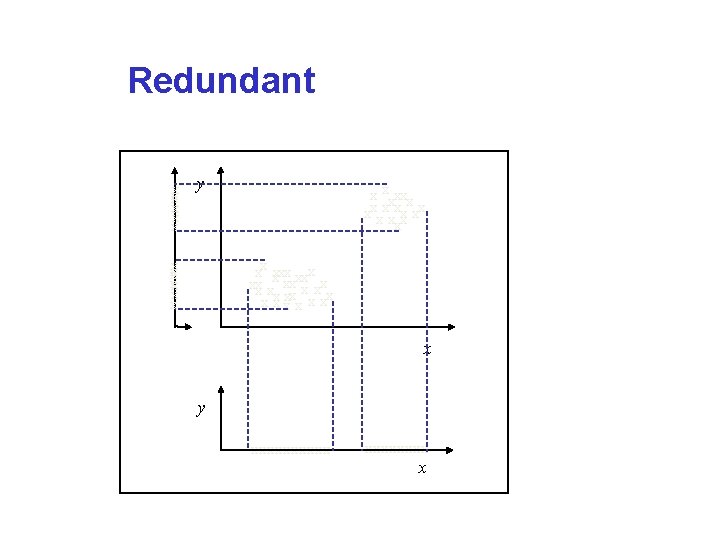
Redundant x xx x y x xx x x xxxxxxxx xxx x xx xxxx x y xxxxx x
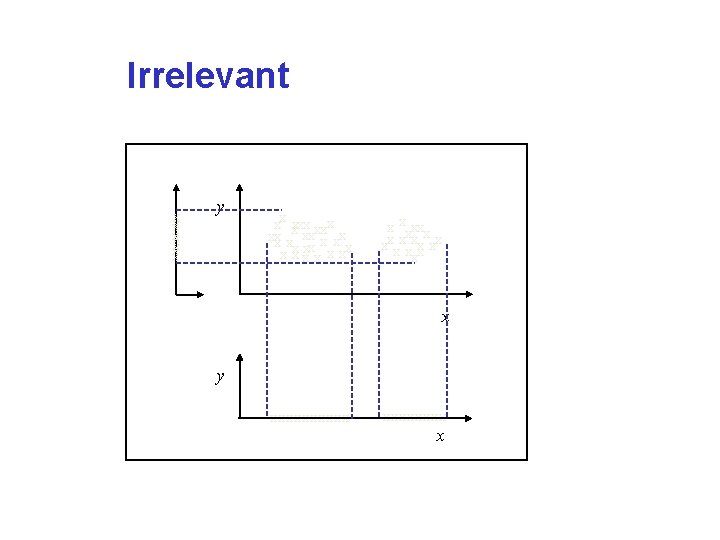
Irrelevant x xxx y xx xxx xxx x xx xxxxx xxxx xx x x y xxxxx x
Curse of Dimensionality 100 observations cover the 1 -D unit interval [0, 1] well Consider the 10 -D unit hypersquare, 100 observations are now isolated points in a vast empty space.
Consequence of the Curse • Suppose the number of samples given to us in the total sample space is fixed • Let the dimension increase • Then the distance of the k nearest neighbors of any point increases
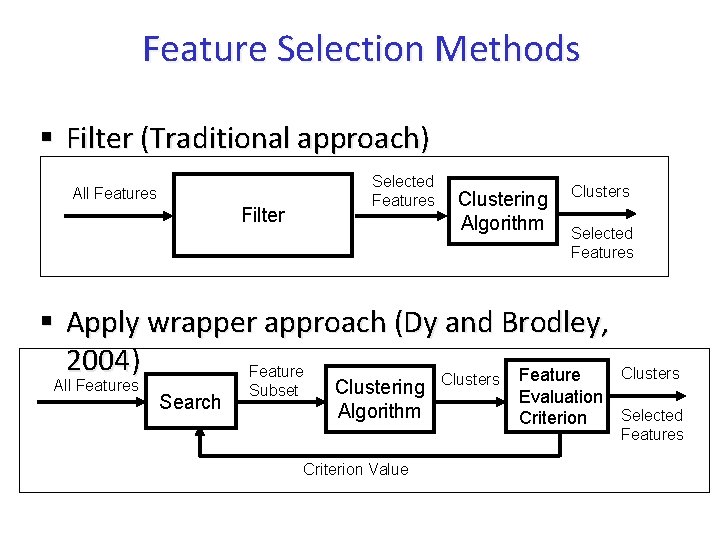
Feature Selection Methods § Filter (Traditional approach) All Features Filter Selected Features Clustering Algorithm Clusters Selected Features § Apply wrapper approach (Dy and Brodley, 2004) Feature Clusters Feature All Features Search Subset Clustering Algorithm Clusters Evaluation Selected Criterion Features Criterion Value
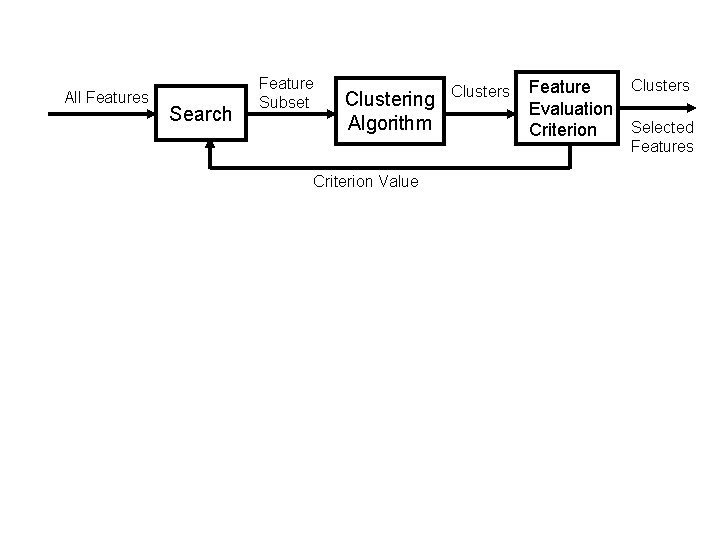
All Features Search Feature Subset Clustering Algorithm Clusters Feature Evaluation Selected Criterion Features Criterion Value
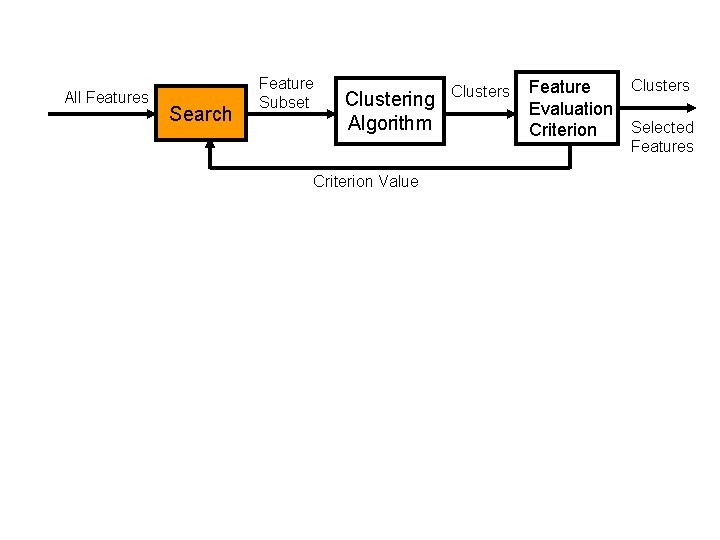
All Features Search Feature Subset Clustering Algorithm Clusters Feature Evaluation Selected Criterion Features Criterion Value
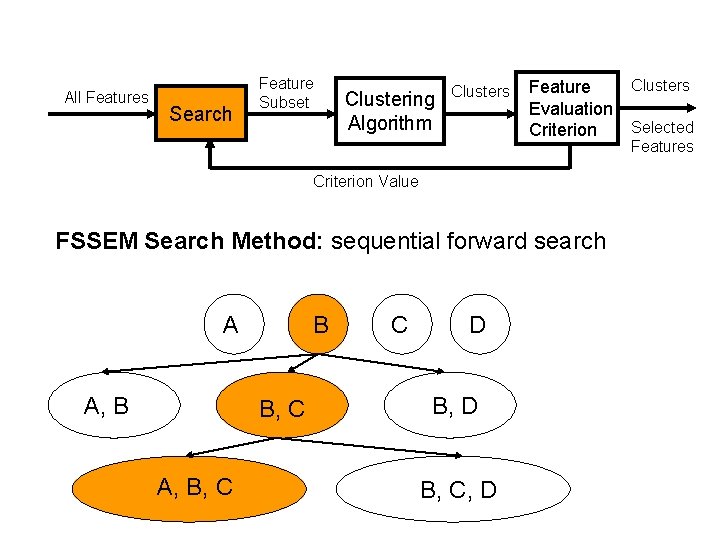
All Features Search Feature Subset Clustering Algorithm Clusters Feature Evaluation Selected Criterion Features Criterion Value FSSEM Search Method: sequential forward search A A, B B B, C A, B, C C D B, C, D
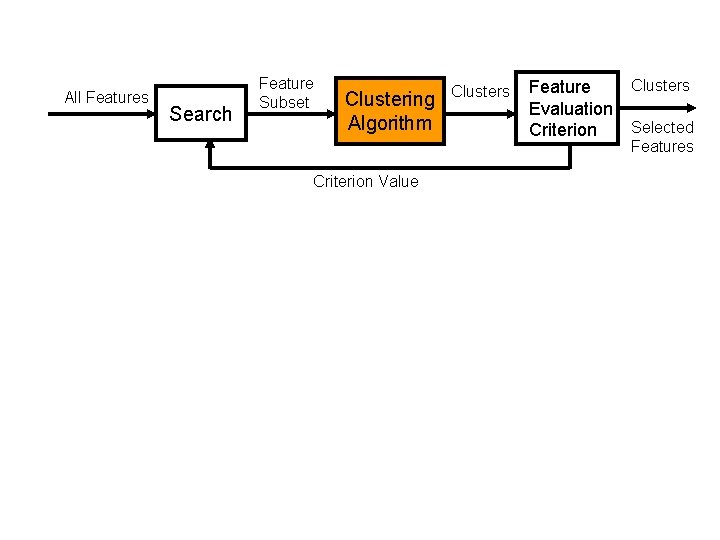
All Features Search Feature Subset Clustering Algorithm Clusters Feature Evaluation Selected Criterion Features Criterion Value
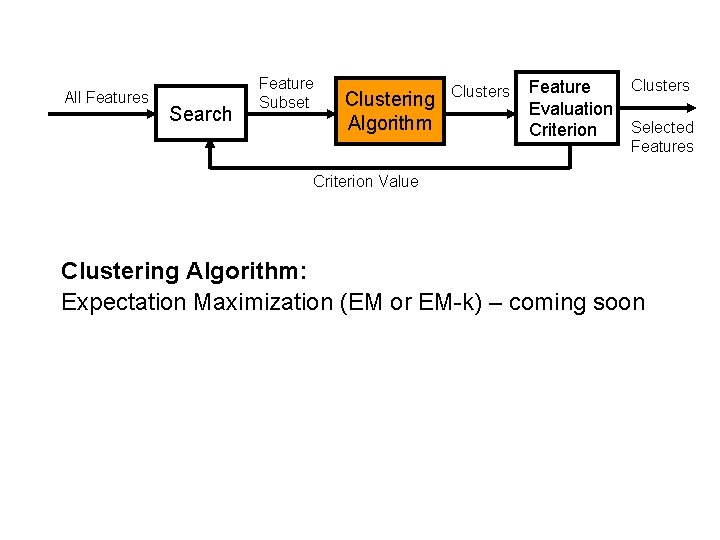
All Features Search Feature Subset Clustering Algorithm Clusters Feature Evaluation Selected Criterion Features Criterion Value Clustering Algorithm: Expectation Maximization (EM or EM-k) – coming soon
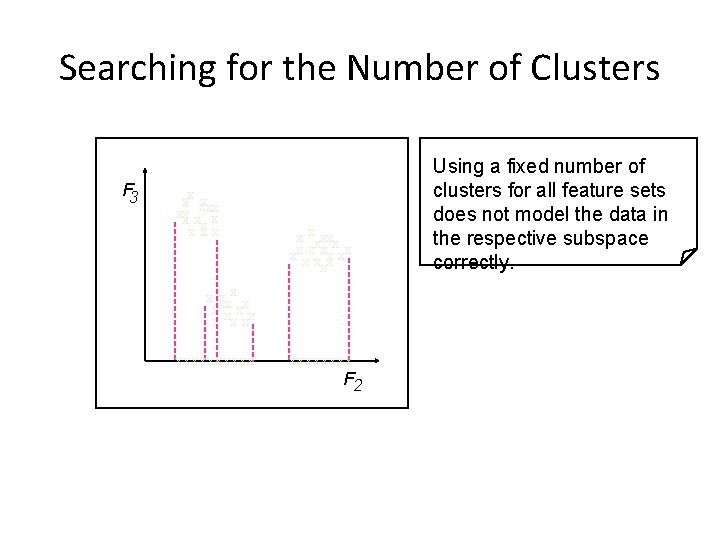
Searching for the Number of Clusters F 3 xx xxx x x xxxxxxxx xx x x xxxx xxxxxxxx F 2 Using a fixed number of clusters for all feature sets does not model the data in the respective subspace correctly.
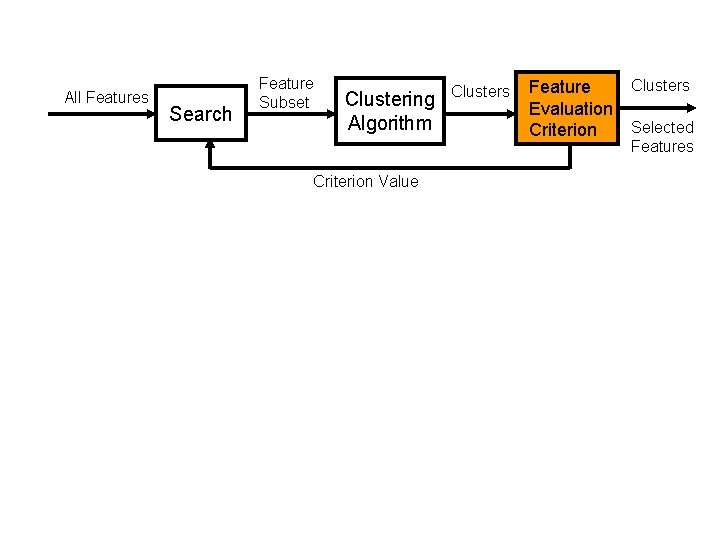
All Features Search Feature Subset Clustering Algorithm Clusters Feature Evaluation Selected Criterion Features Criterion Value
- Slides: 71