Introduction to Biostatistics with SPSS Application Osama A


Introduction to Biostatistics with SPSS Application Osama A Samarkandi, Ph. D

Session II

* Welcome Back * Day 2

Univariate Descriptive Statistics Univariate Examination: of two frequency distribution, central tendency, and variability. Bivariate: Examination: of two variables simultaneously. "Is SES related to intelligence? Do SAT scores have anything to do with how well one does in college? The question, is Do these variables correlate, or, covary?
 The correlation coefficient is bivariate statistic that measures the degree")
The correlation coefficient (Pearson) The correlation coefficient is bivariate statistic that measures the degree of linear association between 2 variables. (Pearson Product Moment correlation coefficient)

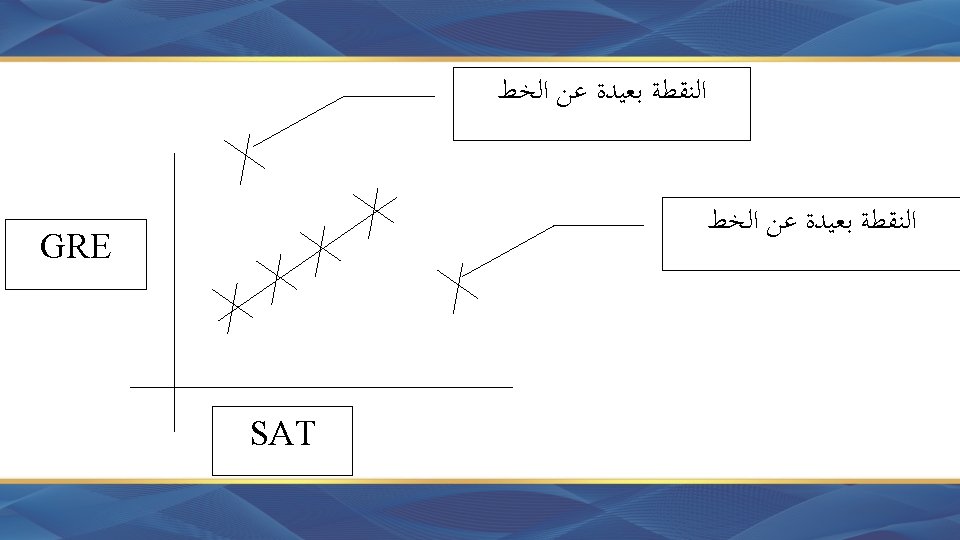
Scatterplot • Reveals the presence of association between 2 variables. The-stronger the relationship, the more the data points cluster along an imaginary line. • Indicates the direction of the relationship. • Reveals the presence of outliers, ﺍﻟﻨﻘﻄﺔ ﺑﻌﻴﺪﺓ ﻋﻦ ﺍﻟﺨﻂ GRE SAT

Covariance Examining the scatterplot is not enough. A single number can represent the degree and direction of the linear relation between two variables.

The Logic of the Covariance • What does it mean for two variables to be positively associated? • Where there is a positive association between two variables, scores above the mean OR X tend to be associated with scores above the-mean OR Y and scores below the mean on X tend to be accompanied by scores below the mean of Y. (Note: For this reason deviation score is an Important part of Covarince)
 r is metric-independent, r -reflects the-direction of the relationship,")
Properties of the Pearson (r) r is metric-independent, r -reflects the-direction of the relationship, r-reflects the magnitude of the relationship. Variance The Strength of association (r 2) = Coefficient of determination. Practical Significant 1 -r 2 = Coefficient of non-determination.

Example 1 The following data are representing both GRE & SAT score for a random selection of (12) students. Find the Covariance, and the correlation coefficient for the distribution and give a clear interpretation. Students A B C D E F G H I J K L Y (GPA) 1. 6 2. 0 2. 2 2. 8 2. 6 3. 2 2. 0 2. 4 3. 4 2. 8 3. 0 X (SAT) 400 350 500 450 550 600 650 700 750

Solution •
 A B Dependent Variable (Certain Outcome) Independent Variable (predictor)")
Coefficient of determination (r 2) A B Dependent Variable (Certain Outcome) Independent Variable (predictor) • Using depending variable to predict the independent variable; 25% of the variability of A & B are common, • 25% of variability of A (Dependent Variable), is explained by B (Independent Variable).

SPSS Practice

SPSS Out put

Example 2 • What does it mean for two variables to be positively associated? • Where there is a positive association between two variables, scores above the mean OR X tend to be associated with scores above the-mean OR Y and scores below the mean on X tend to be accompanied by scores below the mean of Y. (Note: For this reason deviation score is an Important part of Covarince)
 X (SAT) A B C D E F G H")
Solution Students Y (GPA) X (SAT) A B C D E F G H I J K L Sum: 1. 6 2. 0 2. 2 2. 8 2. 6 3. 2 2. 0 2. 4 3. 4 2. 8 3. 0 30. 8 400 350 500 450 550 600 650 700 750 6, 550 Mean : 2. 57 545. 80 SD (σ): -0. 97 -0. 57 -0. 37 0. 23 0. 03 0. 63 -0. 57 -0. 17 0. 83 0. 23 0. 43 -0. 04 0. 94 0. 32 0. 14 0. 053 0. 0009 0. 40 0. 32 0. 03 0. 69 0. 053 0. 185 3. 1849 -145. 8 -195. 8 -45. 8 -145. 8 -95. 8 4. 2 54. 2 104. 2 154. 2 204. 2 0. 4 21, 257. 64 38, 337. 64 2, 097. 64 21, 257. 64 9, 177. 64 17. 64 2, 937. 64 10, 857. 64 23, 777. 64 41, 697. 64 182, 291. 68 141. 43 111. 61 16. 95 -33. 53 -22. 03 0. 13 2. 65 -30. 89 -17. 71 86. 49 35. 47 87. 8 378. 37


* Break *
- Slides: 20