Introduction to Big Data ECE 693 Big Data
")
Introduction to Big Data (ECE 693 Big Data Security)
 10% Homework (~7 of them)")
Syllabus 20% Labs 20% 4 quizzes (each 15 minutes) 10% Homework (~7 of them) 40% 50 -min in-class closed-book exams (4 of them; every 3 -4 weeks) 10%: A self-chosen project on big data system security needs to be demonstrated.

What’s Big Data? No single definition; here is from Wikipedia: • Big data is the term for a collection of data sets so large and complex that it becomes difficult to process using on-hand database management tools or traditional data processing applications. • The challenges include capture, curation, storage, search, sharing, transfer, analysis, and visualization. • The trend to larger data sets is due to the additional information derivable from analysis of a single large set of related data, as compared to separate smaller sets with the same total amount of data, allowing correlations to be found to "spot business trends, determine quality of research, prevent diseases, link legal citations, combat crime, and determine real-time roadway traffic conditions. ” 3

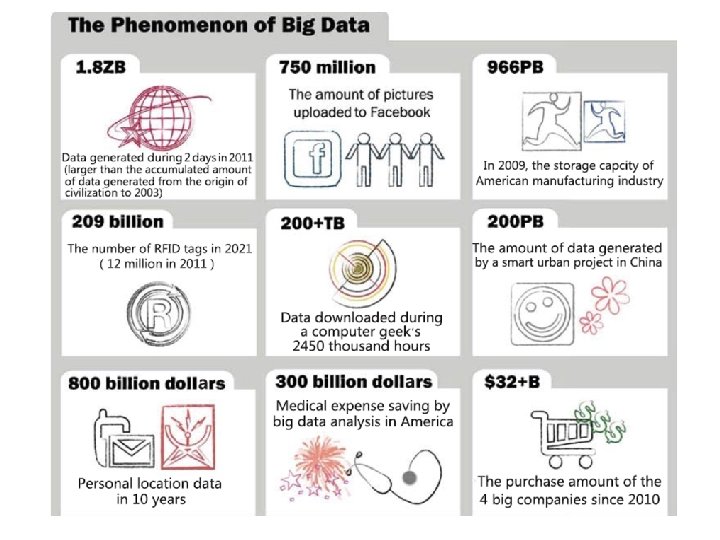
Big data is 21 st century oil Mc. Kinsey summarized the values that big data could create: if big data could be creatively and effectively utilized to improve efficiency and quality, the potential value of the U. S medical industry gained through data may surpass USD 300 billion, thus reducing the expenditure for the U. S. healthcare by over 8 %; retailers that fully utilize big data may improve their profit by more than 60 %; big data may also be utilized to improve the efficiency of government operations, such that the developed economies in Europe could save over EUR 100 billion (which excludes the effect of reduced frauds, errors, and tax difference).

Google handles BD well The Mc. Kinsey report is regarded as prospective and predictive, while the following facts may validate the values of big data. During the 2009 flu pandemic, Google obtained timely information by analyzing big data, which even provided more valuable information that provided by disease prevention centers. Nearly all countries required hospitals inform agencies such as disease prevention centers of the new type of influenza cases.

Data, Data In 2008, Microsoft purchased Farecast, a sci-tech venture company in the U. S. Farecast has an airline ticket forecast system that predicts the trends and rising/dropping ranges of airline ticket price. The system has been incorporated into the Bing search engine of Microsoft. By 2012, the system has saved nearly USD 50 per ticket per passenger, with the forecasted accuracy as high as 75 %.

Big data may come from Io. T

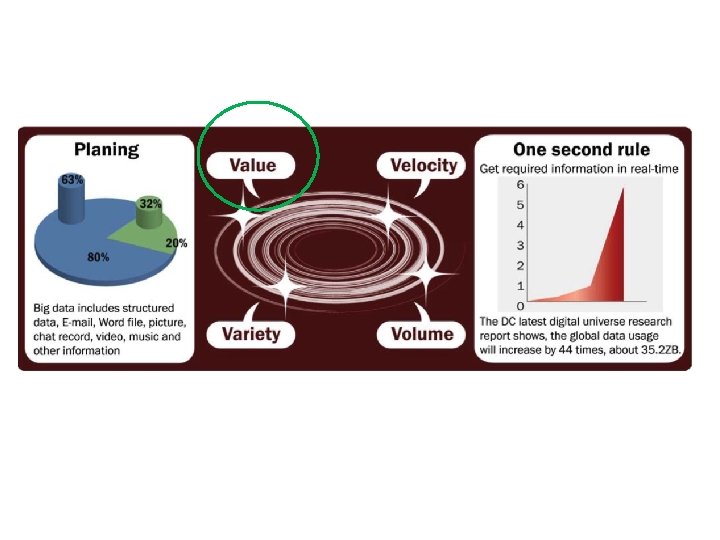
Big Data: 3 V’s 8
 • Data Volume – 44 x increase from 2009 to 2020 –")
Volume (Scale) • Data Volume – 44 x increase from 2009 to 2020 – From 0. 8 zettabytes to 35 zb • Data volume is increasing exponentially Exponential increase in collected/generated data 9

12+ TBs of tweet data every day 30 billion RFID tags today (1. 3 B in 2005) 4. 6 billion camera phones world wide ? TBs of data every day 100 s of millions of GPS enabled devices sold annually 25+ TBs of 2+ billion log data every day 76 million smart meters in 2009… 200 M by 2014 people on the Web by end 2011
 generates 15 PB a year")
Maximilien Brice, © CERN’s Large Hydron Collider (LHC) generates 15 PB a year

The Earthscope • The Earthscope is the world's largest science project. Designed to track North America's geological evolution, this observatory records data over 3. 8 million square miles, amassing 67 terabytes of data. • It analyzes seismic slips in the San Andreas fault, sure, but also the plume of magma underneath Yellowstone and much, much more. (http: //www. msnbc. msn. com/id/44 363598/ns/technology_and_science -future_of_technology/#. Tmet. Od. Q-u. I)
 Log files: For example, web servers")
Big Data collection • 3 common methods: (1) Log files: For example, web servers record in log files number of clicks, click rates, visits, and other property records of web users. (2) Sensors: Sensory data may be classified as sound wave, voice, vibration, automobile, chemical, current, weather, pressure, temperature, etc. (3) Internet traffic data: web crawler, word segmentation system, task system, and index system, etc.
 • • Relational Data (Tables/Transaction/Legacy Data) Text Data (Web) Semi-structured Data (XML)")
Variety (Complexity) • • Relational Data (Tables/Transaction/Legacy Data) Text Data (Web) Semi-structured Data (XML) Graph Data – Social Network, Semantic Web (RDF), … • Streaming Data – You can only scan the data once • A single application can be generating/collecting many types of data • Big Public Data (online, weather, finance, etc) To extract knowledge all these types of data need to linked together 15

A Single View to the Customer Banking Finance Social Media Our Known History Customer Gaming Entertain Purchase
 • Data is generated fast and need to be processed fast •")
Velocity (Speed) • Data is generated fast and need to be processed fast • Online Data Analytics • Late decisions missing opportunities • Examples – E-Promotions: Based on your current location, your purchase history, what you like send promotions right now for store next to you – Healthcare monitoring: sensors monitoring your activities and body any abnormal measurements require immediate reaction 17
 Social media and networks")
Real-time/Fast Data Mobile devices (tracking all objects all the time) Social media and networks (all of us are generating data) Scientific instruments (collecting all sorts of data) Sensor technology and networks (measuring all kinds of data) • • The progress and innovation is no longer hindered by the ability to collect data But, by the ability to manage, analyze, summarize, visualize, and discover knowledge from the collected data in a timely manner and in a scalable fashion 18
? Product Recommendations that are Relevant & Compelling Improving the Marketing Effectiveness")
Why Velocity (Real-Time)? Product Recommendations that are Relevant & Compelling Improving the Marketing Effectiveness of a Promotion while it is still in Play Influence Behavior Learning why Customers Switch to competitors and their offers; in time to Counter Customer Preventing Fraud as it is Occurring & preventing more proactively Friend Invitations to join a Game or Activity that expands business

Big Data storage Various storage systems emerge to meet the demands of massive data. Existing massive storage technologies can be classified as Direct Attached Storage (DAS) and network storage. while network storage can be further classified into Network Attached Storage (NAS) and Storage Area Network (SAN).

Some Make it 4 V’s 21
 OLAP: Online Analytical")
Harnessing Big Data • • • OLTP: Online Transaction Processing (DBMSs) OLAP: Online Analytical Processing (Data Warehousing) RTAP: Real-Time Analytics Processing (Big Data Architecture & technology) 23

The Model Has Changed… • The Model of Generating/Consuming Data has Changed Old Model: Few companies are generating data, all others are consuming data New Model: all of us are generating data, and all of us are consuming data 24

What’s driving Big Data - Optimizations and predictive analytics - Complex statistical analysis - All types of data, and many sources - Very large datasets - More of a real-time - Ad-hoc querying and reporting - Data mining techniques - Structured data, typical sources - Small to mid-size datasets 25

THE EVOLUTION OF BUSINESS INTELLIGENCE Speed BI Reporting OLAP & Dataware house Business Objects, SAS, Informatica, Cognos other SQL Reporting Tools Interactive Business Intelligence & In-memory RDBMS Qliq. View, Tableau, HANA Scale Big Data: Real Time & Single View Graph Databases Big Data: Batch Processing & Distributed Data Store Scale Hadoop/Spark; HBase/Cassandra 1990’s 2000’s 2010’s Speed

Big Data Analytics • Big data is more real-time in nature than traditional DW applications • Traditional DW architectures (e. g. Exadata, Teradata) are not wellsuited for big data apps • massively parallel processing, scale out architectures are well-suited for big data apps 27
![Map. Reduce [Dean et al. , OSDI 2004, CACM Jan 2008, CACM Jan 2010]](http://slidetodoc.com/presentation_image_h/845173a4bc3706382a32d7f5ea5e9ba5/image-28.jpg "Map. Reduce [Dean et al. , OSDI 2004, CACM Jan 2008, CACM Jan 2010]")
Map. Reduce [Dean et al. , OSDI 2004, CACM Jan 2008, CACM Jan 2010] • Overview: – Data-parallel programming model – An associated parallel and distributed implementation for commodity clusters • Pioneered by Google – Processes 20 PB of data per day • Popularized by open-source Hadoop project – Used by Yahoo!, Facebook, Amazon, and the list is growing …

Programming Framework Raw Input: <key, value> MAP <K 2, V 2> REDUCE <K 1, V 1> <K 3, V 3>

Map. Reduce Advantages • Automatic Parallelization: – Depending on the size of RAW INPUT DATA instantiate multiple MAP tasks – Similarly, depending upon the number of intermediate <key, value> partitions instantiate multiple REDUCE tasks • Run-time: – – Data partitioning Task scheduling Handling machine failures Managing inter-machine communication • Completely transparent to the programmer/analyst/user

Map. Reduce Experience • Runs on large commodity clusters: – 1000 s to 10, 000 s of machines • Processes many terabytes of data • Easy to use since run-time complexity hidden from the users • 1000 s of MR jobs/day at Google (circa 2004) • 100 s of MR programs implemented (circa 2004)

The Need • Special-purpose programs to process large amounts of data: crawled documents, Web Query Logs, etc. • At Google and others (Yahoo!, Facebook): – Inverted index – Graph structure of the WEB documents – Summaries of #pages/host, set of frequent queries, etc. – Ad. Optimization – Spam filtering

Map. Reduce Contributions Simple & Powerful Programming Paradigm For Large-scale Data Analysis Run-time System For Large-scale Parallelism & Distribution

Takeaway • Map. Reduce’s data-parallel programming model hides complexity of distribution and fault tolerance • Key philosophy: – Make it scale, so you can throw hardware at problems – Make it cheap, saving hardware, programmer and administration costs (but requiring fault tolerance) • Hive and Pig further simplify programming • Map. Reduce is not suitable for all problems, but when it works, it may save you a lot of time

Map Reduce vs Parallel DBMS [Pavlo et al. , SIGMOD 2009, Stonebraker et al. , CACM 2010, …] Parallel DBMS Map. Reduce Schema Support Not out of the box Indexing Not out of the box Programming Model Declarative (SQL) Imperative (C/C++, Java, …) Extensions through Pig and Hive Optimizations (Compression, Query Optimization) Not out of the box Flexibility Not out of the box Fault Tolerance Coarse grained techniques

Map. Reduce: A step backwards? • Don’t need 1000 nodes to process petabytes: – Parallel DBs do it in fewer than 100 nodes • No support for schema: – Sharing across multiple MR programs difficult • No indexing: – Wasteful access to unnecessary data • Non-declarative programming model: – Requires highly-skilled programmers • No support for JOINs: – Requires multiple MR phases for the analysis

Map. Reduce VS Parallel DB: Our 2¢ • Web application data is inherently distributed on a large number of sites: – Funneling data to DB nodes is a failed strategy • Distributed and parallel programs difficult to develop: – Failures and dynamics in the cloud • Indexing: – Sequential Disk access 10 times faster than random access. – Not clear if indexing is the right strategy. • Complex queries: – DB community needs to JOIN hands with MR
![Hadoop DB – A Hybrid Approach [Abouzeid et al. , VLDB 2009] • An](http://slidetodoc.com/presentation_image_h/845173a4bc3706382a32d7f5ea5e9ba5/image-38.jpg "Hadoop DB – A Hybrid Approach [Abouzeid et al. , VLDB 2009] • An")
Hadoop DB – A Hybrid Approach [Abouzeid et al. , VLDB 2009] • An architectural hybrid of Map. Reduce and DBMS technologies • Use Fault-tolerance and Scale of Map. Reduce framework like Hadoop • Leverage advanced data processing techniques of an RDBMS • Expose a declarative interface to the user • Goal: Leverage from the best of both worlds

Architecture of Hadoop. DB

Hadoop. DB: add more components

Relationship between Hadoop and big data • Presently, Hadoop is widely used in big data applications in the industry, e. g. , spam filtering, network searching, clickstream analysis, and social recommendation. In addition, considerable academic research is now based on Hadoop. • As declared in June 2012, Yahoo runs Hadoop in 42, 000 servers at four data centers to support its products and services, e. g. , searching and spam filtering, etc. • At present, the biggest Hadoop cluster has 4, 000 nodes, but the number of nodes will be increased to 10, 000 with the release of Hadoop 2. 0. • In the same month, Facebook announced that their Hadoop cluster can process 100 PB data, which grew by 0. 5 PB per day as in November 2012. • Some well-known agencies use Hadoop to conduct distributed computation. • In addition, many companies provide Hadoop commercial execution and/or support, including Cloudera, IBM, Map. R, EMC, and Oracle.

Two-way Joins U

BLOG Wisdom • “If you want vast, on-demand scalability, you need a nonrelational database. ” Since scalability requirements: – Can change very quickly and, – Can grow very rapidly. • Difficult to manage with a single in-house RDBMS server. • RDBMS scale well: – When limited to a single node, but – Overwhelming complexity to scale on multiple server nodes.

The “No. SQL” movement • Initially used for: “Open-Source relational database that did not expose SQL interface” • Popularly used for: “non-relational, distributed data stores that often did not attempt to provide ACID guarantees” • Gained widespread popularity through a number of open source projects – HBase, Cassandra, Voldemort, Mong. DB, … • Scale-out, elasticity, flexible data model, high availability
![No. SQL has no relation with SQL - Micheal Stonebraker [CACM Blog] • Term](http://slidetodoc.com/presentation_image_h/845173a4bc3706382a32d7f5ea5e9ba5/image-45.jpg "No. SQL has no relation with SQL - Micheal Stonebraker [CACM Blog] • Term")
No. SQL has no relation with SQL - Micheal Stonebraker [CACM Blog] • Term heavily used (and abused) • Scalability and performance bottleneck not inherent to SQL – Scale-out, auto-partitioning, self-manageability can be achieved with SQL • Different implementations of SQL engine for different application needs • SQL provides flexibility, portability

No-SQL Not Only SQL • Recently renamed • Encompass a broad category of “structured” storage solutions – RDBMS is a subset – Key Value stores – Document stores – Graph database • The debate on appropriate characterization continues

No. SQL is good The database technology has been evolving for more than 30 years. Various database systems are developed to handle datasets at different scales and support various applications. Traditional relational databases cannot meet the challenges on categories and scales brought about by big data. No. SQL databases (i. e. , non traditional relational databases) are becoming more popular for big data storage. No. SQL databases feature flexible modes, support for simple and easy copy, simple API, eventual consistency, and support of large volume data. No. SQL databases are becoming the core technology for of big data.
- Slides: 47