Introduction To Arc Map Arc Ma p Arc


- Slides: 45
Introduction To Arc. Map Arc. Ma p
Arc. Map is a Map-centric GUI tool used to perform map-based tasks • Mapping – Create maps by working geographically and interactively • Display and present – Export or print – Publish on WWW • Edit – Update data – Modify features • Query • Chart • Reporting – Embed maps in reports
Arc. Map is a Map-centric GUI tool used to perform map-based tasks • Analyze –Visualize information • See patterns • Reveal hidden trends • Show relationships between features –Solve problems • Where is • How close • How much • What if • Develop custom mapping applications based on Arc. Map components
Arc. Map • Is both a data editor as well as map generator • Provides two different ways to view a map on the fly – Data view – Layout view
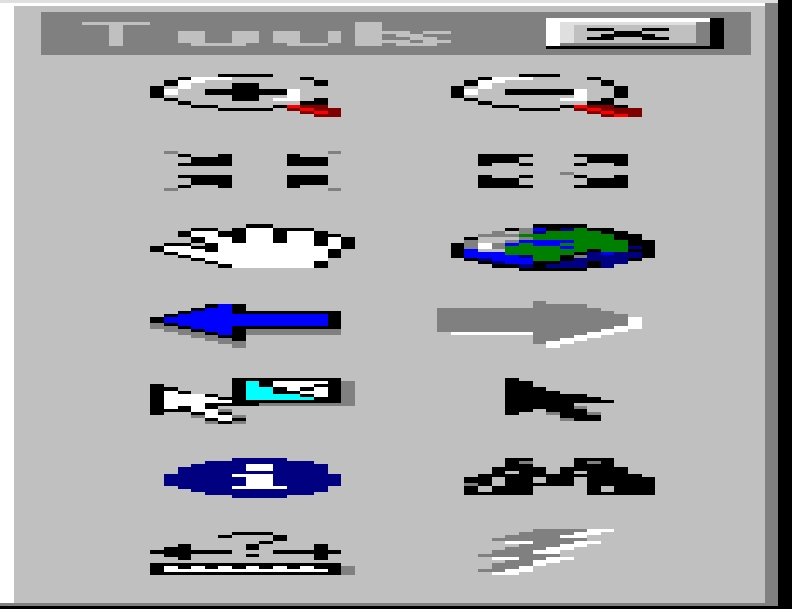
Navigating Around the Map • Main Menu • Toolbars – – – – Standard Tools Drawing Utility Network Analysis Editor Layout Effects Graphs/Reports • Create Spatial Bookmarks • Open magnifier and overview windows • Find Features
Main Menu Standard Toolbar Tools Toolbar Rulers Toggle back and forth between data and layout views Drawing Toolbar
Main Menu Layout Toolbar Utility Network Analysis Toolbar Editor Toolbar Versioning Toolbar Effects Toolbar Graphs/Reports Toolbar
Map Layers & Data Frames • • • Arcinfo 8 maps have layers and data frames Data frames organize layers similar to Arc. Views Data frames have a map extent and a map projection Layers are like Arc. View themes, but persistent Layers represent your geographic data with colors and symbols Layers support – Thematic mapping – Single symbol values – Unique value – Graduated color ramps – Proportional symbols – Look up tables – Pie and bar chart maps
Layers • A layer defines how to display the geographic data it references. • When you add a layer to a map, Arc. Map references the data source the layer is based on. • When a map is saved data references are stored with it. • Maps opened in Arc. Map locate data based on stored references. • As in Arc. View, if the data location has changed you will be prompted to locate the data source yourself, or ignore the reference in which case the layer will not be drawn. • Arc. Map allows storage of relative pathnames to data sources referenced on a map. This allows you to distribute you data and maps in the same directory. The reference on the map would be correct regardless of where they were placed on the disk. • It is very easy to add layers to a map. – All you do is drag the layer from Arc. Catalog to the data frame.
Managing Layers in Arc. Map • In Arc. Map you can… – – – – – Change a layers’s text description Change a layer’s drawing order Copy layers Remove layers from a map Group layers together Access layer properties Display layers at different scales Use data frames to organize layers Save a layer to a disk Repair broken data links
Active Data Frames Layers Table of Contents
Map Data Sources
Inserting Map Elements • Arc. Map makes it easy to add………… – Titles – Legends – North arrows – Scale bars – Scale text – Label text – Pictures
Title Legend North Arrow Text Picture Scale Bar
Labeling Map Features • Labels are text on a map that provides additional information about a feature – Can label on the fly with any or several attributes – Advanced options for label placement and visibility – Labels can be made into annotation layers and stored in geodatabases with relationships to a feature class
Managing Annotation • Annotation refers to the process of automating text placement OR to the text itself • In addition to geometry and location, geographic features can have descriptive text associated with them, e. g. , streets with names • Annotation may also be a geographically located piece of text independent of other features, e. g. , Name of mountain range on map
Geodatabase Annotation • Annotation can be created for feature classes in the geodatabase – Stored in annotation classes (special feature classes) as ESRI annotation features – Annotation classes can be managed in Arc. Catalog the same way as feature classes and tables • Two kinds of annotation in a geodatabase – Feature-linked – annotation class is linked to another feature class in the geodatabase via relationship class • Relationship class is managed as any other relationship class – Nonfeature-linked – geographically placed text stings not associated with geodatabase feature classes • No relationship class linking it to a feature class
Coverage Annotation • Annotation in coverages can be converted to geodatabase annotation classes using Arc. Map • Converted coverage annotation cannot be featurelinked – Relationship classes can be created to link feature classes to converted coverage annotation but the behavior is different than true feature-linked annotation
Relationship Class Annotation Class
Arc. Map Editing • Arc. Map editor has tools to edit …. – Tables. – Shapefiles. – Coverages. – Geodatabases (personal & SDE). • Direct Geodatabase editing (personal & SDE). • Cad-like. • Rule based. • Long transactions. • Un-do, re-do. • Edit many layers at the same time.
Arc. Map Editing • All editing takes place within an edit session • Editing sessions are started and ended from editor menu on editor toolbar • Can edit attributes interactively from Arc. Map • Can edit multiple features in one session • Can copy and paste individual or multiple attribute values from feature to feature
Target Layer Tool Palette for creating a sketch Current Task Edit Session Commands Attributes Button
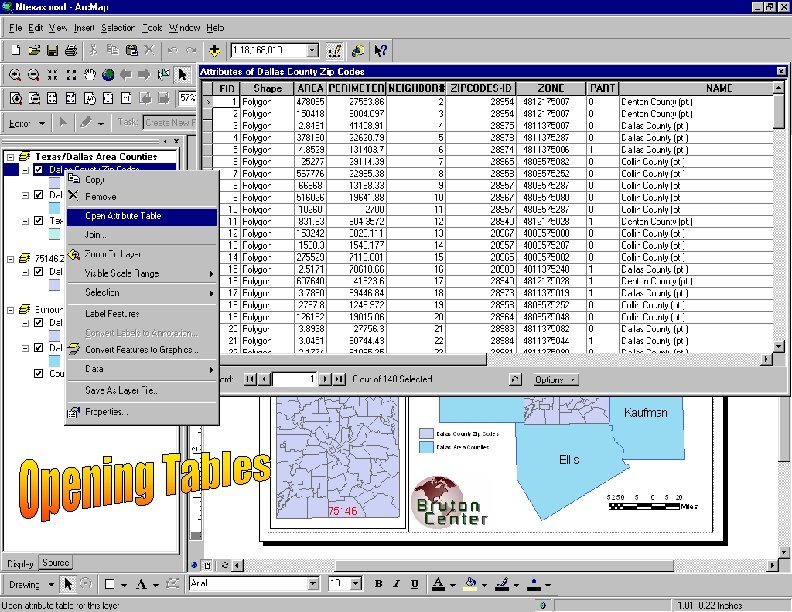
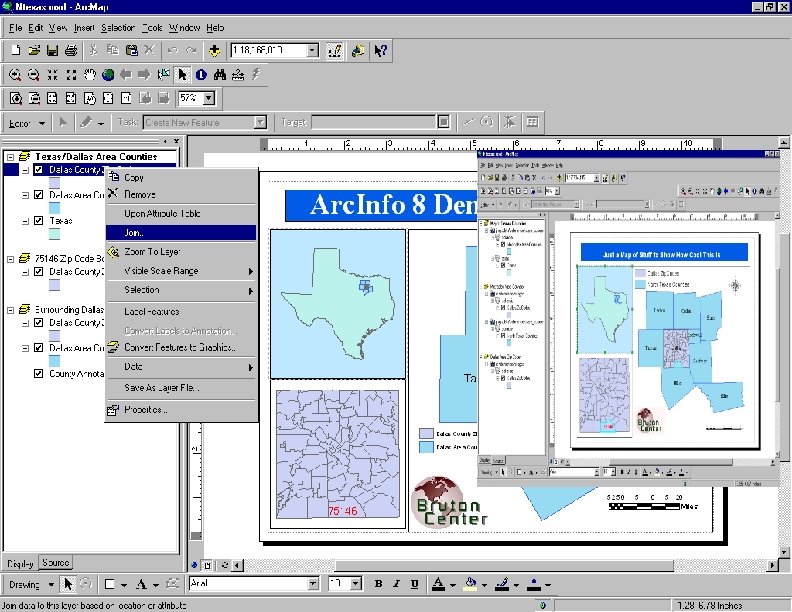
Open Attribute Table
Right-Click & Zoom
Selecting Multiple Features to Edit
Select Multiple Features Open Attribute Table for Selected Features
Spatial Bookmarks • Pan or Zoom to area within Data Frame • From View Menu – Goto Bookmarks – Type in a Name • Can also create from Identify Results dialog box • Can also create from find dialog box
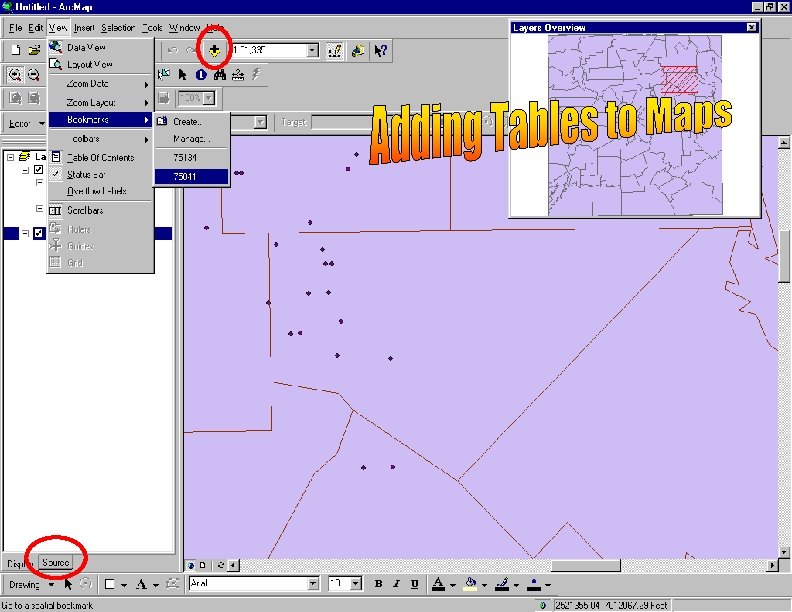
Spatial Bookmarks using View Menu
Spatial Bookmarks using “Find” Tool
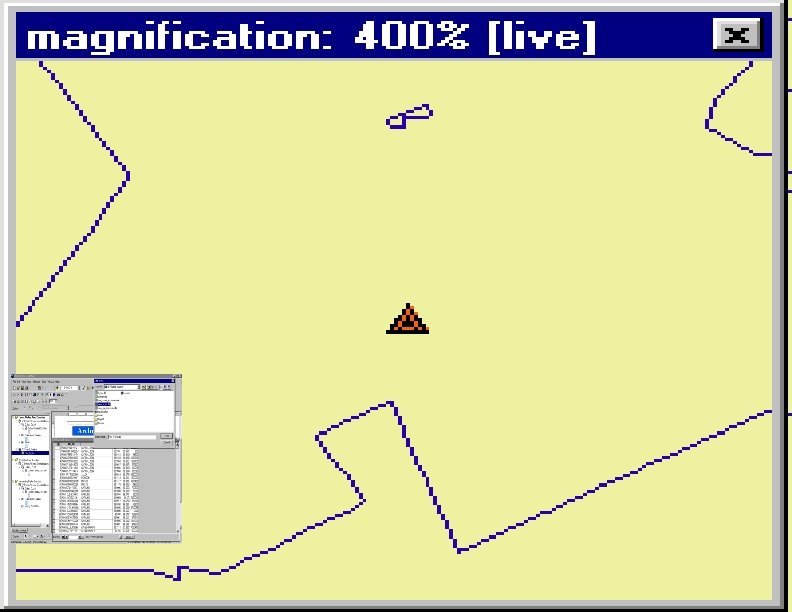
Overview & Magnification Windows • In data view only, instead of repositioning you can open……… – Magnifier window. • Acts like magnifying glass. – Overview window. • Show full extent of the data. • Handy for editing and finding your way about multiple layers.
Working with Tables in Arc. Map • Tables – used in Arc. Map to inspect attributes of geographic features – Rows are records • Records represent geographic features – Example » Parcel » Highway » Lake – Columns are fields • Fields represrent attributes of a feature – Example » Length » Depth » Cost
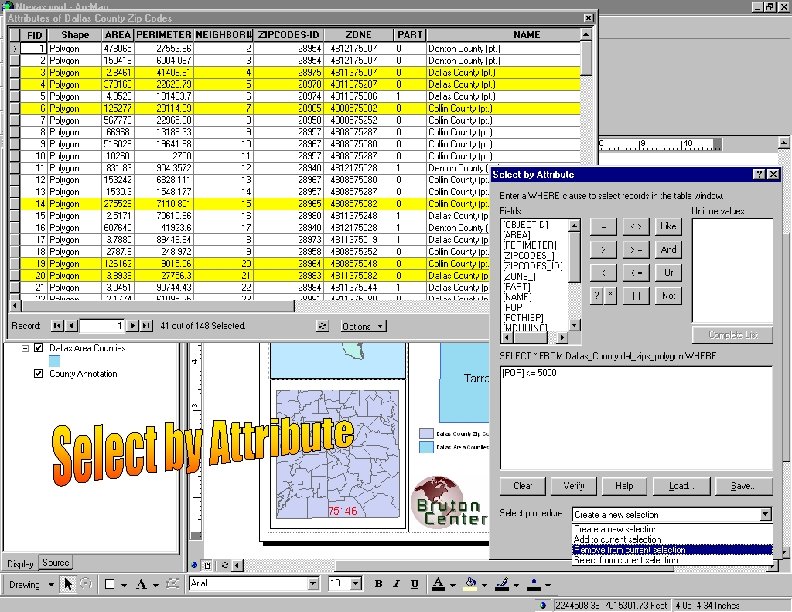
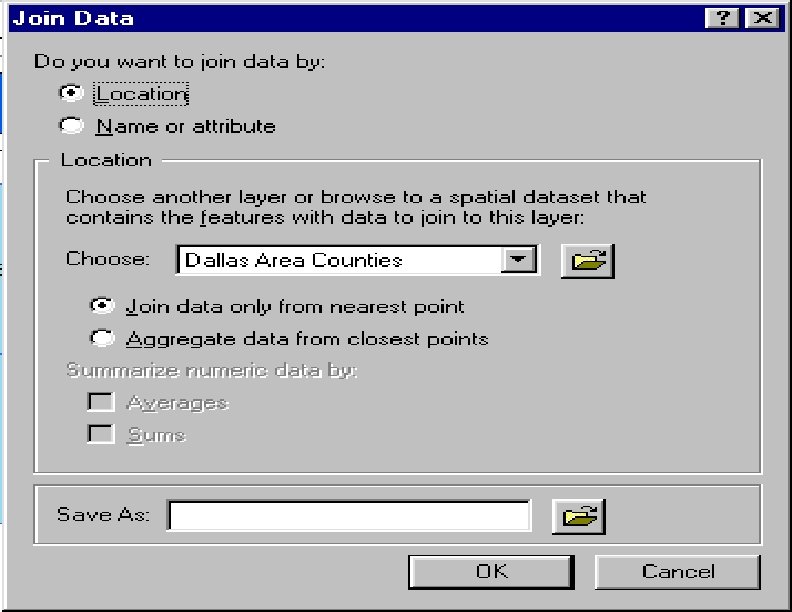
Working with Tables in Arc. Map • Add tables to maps • Organize – Freeze/unfreeze columns – Rearrange & resize columns • Sort records – Ascending & descending – By more than one column • Edit – Add or change records & values – Copy and paste records & values • Query – Find values using “find” tool – Select records interactively or by attribute with query ”wizard” • Make simple or advanced field calculations using “field calculator” &VB scripts • Join – By name or attribute (common values) – By location (spatial join) • Use relationships to query information in a related table
Elements of an Arc. Map Table Rows or Records Columns or Fields Move To Record
Graphs & Reports • Graphs & Reports – Present information about map features and their relationships • Graphs – Present tabular data about map features in graph – Derived from attribute tables – Can include in map layouts – Can save, load or export as graphic file • Reports – Present tabular data about map features in an attractive manner – Derived from attribute tables – Can include in map layouts – Can save, load, or export as PDF, RTF, or TXT
Graphs • • • • Area Bar Box-whisker Bubble Candlestick Gantt High-Low-Close Line Pie Polar Scatter Surface Time Series
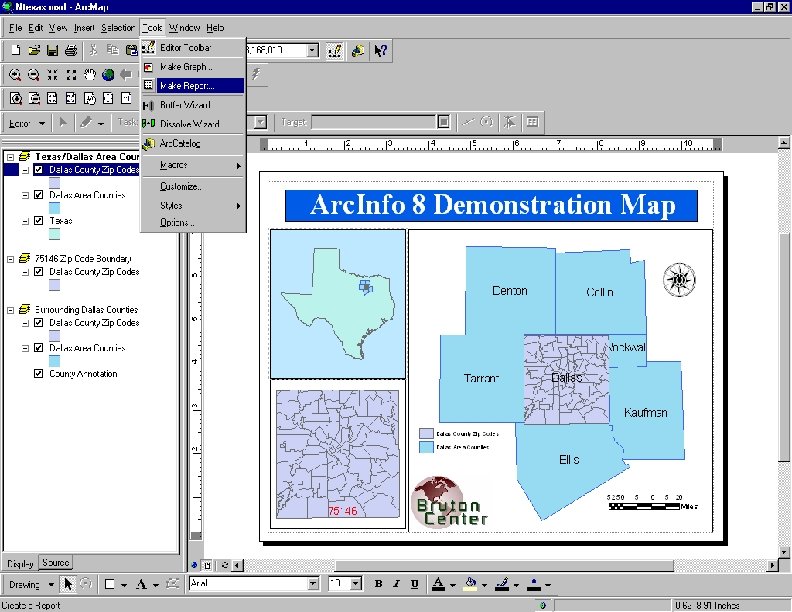
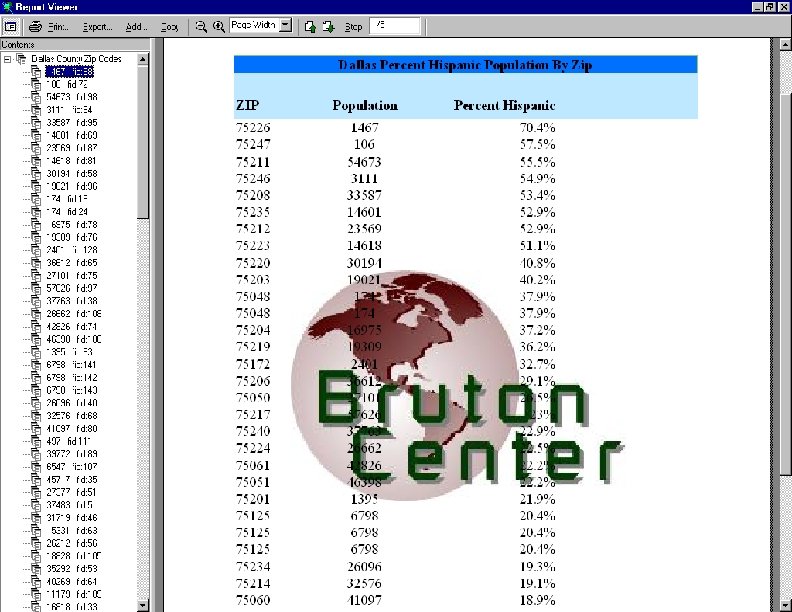
Reports • A report presents tabular information about features on the map formatted in an attractive manner. • Reports are derived from an attribute table on your map. • Report can be placed on your map layout next to your geographic data or Reports can be saved as a file, e. g. *. pdf, for distribution. • You can include a title, page numbers, the current date, summary statistics, and images. • There are different kinds of reports you can create: – Record report where each record is represented by a row in the display. – Columnar report with data organized in a single column, displaying field names and columns vertically.