Introduction Statistics is the science of conducting studies


 2) 3) 4) 5) Asking the research")


 2. Ordinal –")


")


 that are studied.")

- Slides: 23
Introduction � � Statistics is the science of conducting studies to collect organize summarize analyze draw conclusions from data. In social statistics we use statistics to explain and predict human behavior
Objectives for Ch 1 What will you learn? � � Describe the five stages of the research process Define Independent and Dependent variables Distinguish between the two types of data and the four levels of measurement Distinguish between descriptive and inferential statistical procedures
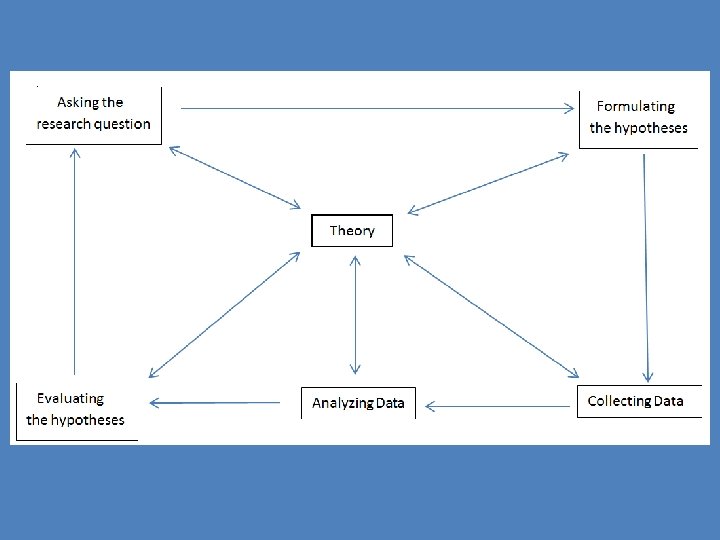
The Research Process The five stages: 1) 2) 3) 4) 5) Asking the research question Formulating the hypotheses Collecting data Analyzing data Evaluating the hypotheses
Statistics is all about Empirical Research Definition: Empirical research � Research based on evidence that can be collected by using our direct experience. � This data can be analyzed quantitatively or qualitatively. � Through quantifying the evidence or making sense of it in qualitative form, a researcher can answer empirical questions, which should be clearly defined answerable with the evidence collected data.
More Definitions � Theory � A set of assumptions and propositions used to explain, predict, and understand social phenomena. Example: Women receive lower pay than men do even when they have the same level of education, skill, and experience as men in comparable occupations. � Hypotheses � A statement predicting the relationship between two or more observable attributes Using the example of theory listed above, we can make hypotheses that wages in occupations where the women are a majority are lower than the wages in occupations were the majority of workers are male.
� Variable A property of people or objects that takes on two or more values. � Note: A Dichotomous variable has only two possible values (e. g. , married, not married) � Variable Categories Social Class Lower Working Middle Upper Make of Automobile Chevrolet Ford Buick Dodge � What do you think? - Note: Use pass it on Strategy Work with your group to come up another example of a variable and then pass it to a nearby group to come up with the corresponding categories for those variables.
� Unit of Analysis � The object of research, such as individuals, groups, organizations, or social artifacts. Unit of Observation Categories Individual Age Family Number of children in household Heritage University (Organization) Gender composition Advertisements Number of advertisements that target the elderly. � What do you think? - Note: Use pass it on Strategy Work with your group to come up with one more unit of observation and then pass it to a nearby group to come up with the corresponding categories for that unit of observation.
Hypotheses are stated in terms of a relationship between an independent and a dependent variable. � Independent Variable � The variable expected to account for (the cause of) the dependent variable � Dependent Variable � The variable to be explained (the effect)
Cause and Effect Relationship � To provide sufficient evidence that two variables have a causal relationship, your analysis must meet three conditions: The cause has to precede the effect in time. 2) There has to be an empirical relationship between the cause and effect. 3) The relationship cannot be explained by other factors. 1)
Example: Did the enactment of “three strikes and you’re out” cause the decline in the crime rate? In order for the observation of the decrease in crime rates to be a causal relationship there needs to be clear proof of the following three aspects. � The reduction of crime actually occurred after the enactment of this measure. � The enactment of the “three strikes and you’re out” measure was empirically associated with a decrease in crime. � The relationship between the reduction in crime and the “three strikes and you’re out” policy is not due to the influence of another variable (for example, the improvement of overall economic condition).
� � � Helpful Steps in Identifying the Independent and Dependent Variable The dependent variable is always the object of the research. The independent variable usually occurs earlier in time than the dependent variable. The independent variable is often seen as influencing, directly or indirectly, the dependent variable. Note: Variable such as race, age, and ethnicity are never considered dependent variables in a social science analysis. � What do you think? Work with your group to clearly identify the independent and dependent variable of learning check page 10 of your textbook.
Variables and their Levels of Measurement 1. Nominal – categorical (names) 2. Ordinal – nominal, plus can be ranked (order) 3. Interval – ordinal, plus intervals are consistent 4. Ratio – interval, plus ratios are consistent, true zero means an absence of the variable
Variables and Levels of Measurement Data Quantitative Qualitative Numerical, Can be ranked Categorical Nominal Cannot be ranked or ordered Ordinal Can be ranked or ordered Interval Ratio Differences between values are meaningful, but the number zero has no meaningful value. Like interval, except that a zero has a meaningful value. Zero indicates the absence of something.
Ratio Level Measurement � By definition, in order for a variable to be a ratio level measurement, there has to be a true zero. � (e. g. , height, length, age, etc…) � For something to have a height or length of zero means that it does not exist. � In other words, negative height, length, or age does not make sense. So zero has a true meaning because it represents that absence of value.
Interval Level Measurement No true meaning of zero
A variable be measured according to more than one level of measurement Education Level � Nominal Measurement High school graduate Private school graduate Military Academy graduate � Ordinal Measurement High school diploma College 2 -year diploma College 4 -year diploma Ph. D � Ratio Measurement 8 years of education 12 years of education 15 years of education
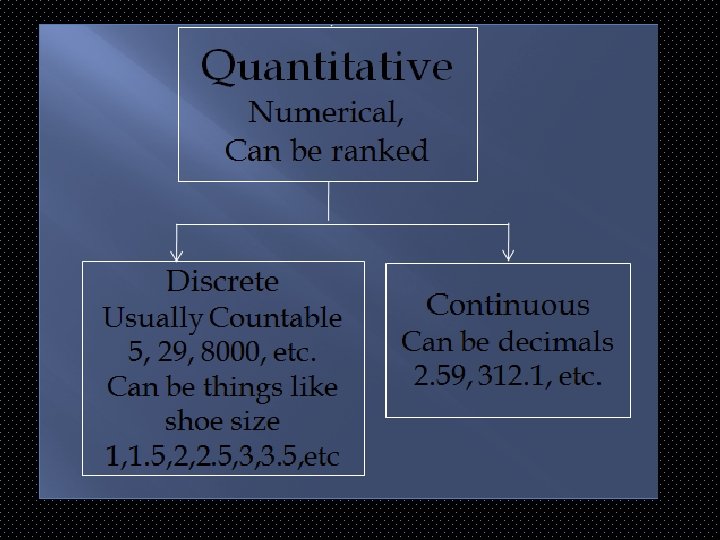
Discrete VS. Continuous Variables � Discrete data variables (characterized by having minimum size units) � Data variables can only take on specific numbers � Continuous Variables (Have no minimum size units and can be measured in proportions or percentages) � Data variables that can take Number of children in a family (0, 1, 2, 3, etc. ) Shoe sizes (7, 7. 5, 8, 8. 5 etc. ) Wages – (minimum unit is 1 cent) on any value (often between two maximum and minimum values) Amount of milk a cow produces in one day �A cow can produce any amount between 0 and 8 gallons. What do you think? Note: Use pass it on Strategy. Work with your group to clearly identify two variables that are not on the list above and then pass it to the next group to identify if they are discrete or continuous. The height of a man Gender composition of occupations (e. g. , percentage of women civil engineers – can be broken down into smaller and smaller proportions - fractions )
Determine the Measurement Level. Take a few moments and see if you can identify the level of data Work with your group to classify each of the 6 variables by the measurement level. Use a post it note to Mark the box that you think is correct. Variable Hair Color Zip Code Letter Grade Height Age Temperature Nominal Ordinal Interval Ratio
Two Main Themes of this course: Descriptive and Inferential Statistics � Descriptive statistics - collection, organization, statistics summarization, and presentation of data. � Example: � Tables, Charts, Data summaries, etc. Inferential statistics - generalizing from statistics samples to populations, performing estimations and hypothesis tests, determining relationships among variables, and making predictions. � Example: Making a decision of which car to buy based on research data and statistical testing in regards to maintenance and longevity issues.
� A population consists of all subjects (human or population otherwise) that are studied. � � For example, if we were interested in studying the cars in the HU parking lot, the population would consist of all cars in the parking lot. A sample is a subset of the population. sample � If we were interested in studying the cars in the HU parking lot, a subset of the population would consist of a selection of cars in the parking lot (let’s say 30 randomly selected cars) Sampl e Population
Ch 1 Homework � Complete the Chapter 1 Homework � Part A - vocabulary study guide by carefully defining and creating an example for term � Part B thru E - problems taken from textbook pgs 25 -26 � Due Date – Check your course plan.