Introduction Research Methods in Public Administration and Nonprofit

Introduction: Research Methods in Public Administration and Nonprofit Management PPA 696 Dr. Butz

Why Take Research Methods? • Competitive advantage in job market – Many public & nonprofit sector jobs require proficiency in statistics, data analysis, and statistical applications – Analytic jobs tend to pay more • • • Conduct and interpret administrative reports Enhance organizational efficiency and effectiveness Better consumer of research and competitive bids It can be advantageous when applying for grants Empowers you when making presentations Better consumer, producer, and analyzer of knowledge more generally – Better citizen and neighbor!

What is Research? • “Research is the systematic process of collecting, analyzing, and interpreting information (data) in order to increase our understanding of a phenomenon about which we are interested or concerned. ” – Much more than mere fact gathering! – Leedy & Ormrod • Develop “models” made up of systematic elements – Theory, hypotheses, literature review, variables, measurements, interpretation
 • Positivism – Historic foundations (Socrates, Aristotle) – Followed by")
Epistemology (Theory of Knowledge) • Positivism – Historic foundations (Socrates, Aristotle) – Followed by period of “Dark Ages” – Age of Enlightenment (Descartes, Locke) – Empiricism and Objectivism • Move beyond superstition and mythology • Motivated by reason and objective observation/verification • Origins of the modern “scientific method”

Characteristics of Science • Empirical and Non-Normative – Observable and recordable data – Findings could have normative implications • Transmissible and transparent – Possibility of replication – “When Contact Changes Minds” – Case of UCLA doctoral student, Micheal La. Cour • Explanatory and theory driven • Falsifiable – Empirical claims can be proven false or untrue • Predictive about the future • Generalizable across many cases
 • • Ask Research Question Construct Theory and Testable")
The Scientific Method (Research Process) • • Ask Research Question Construct Theory and Testable Hypotheses Develop Research Design Measure Variables (operationalization) Collect Data Perform Data Analysis Support or not support hypotheses Report findings and implications (interpretation)

The Research Question • Personal choice – Passions and interests should optimally drive research • PA & nonprofit research questions routinely revolve around the implementation [effectiveness, Impact, or performance] of public & nonprofit programs or other interventions – Evaluation as part of the job (might not have full discretion) • Other PA & nonprofit research questions do exist – Leadership and organizational culture – Employee motivation, turnover, and job satisfaction – Workplace-Organizational interventions (new employee bonus system, wellness initiative, or computer systems) – Policy adoption patterns (policy innovation & diffusion) – Social equity considerations

Theory • Theory – Series of statements that explain and predict relationships in the real-world • Explains why two phenomena are related to each other – Why a relationship or association between two variables exists at all – Program Theory: Why does participation in a specific program lead to certain expected results or outcomes? • Identify the mechanisms that tie variables together and create associations – It is your story about why the world works in the manner that it does – Largely derived from past research!

Example of Theory Why does participation in a job training program increase income levels? • Participation in a job training program interventions leads to higher levels of marketable skills and confidence in a worker’s abilities, which increases competitiveness on the job market, which leads to more completed applications for higher-paying positions which send signals to employers about skills and abilities which leads to higher paying employment. • Job Training → Skills → Confidence → Marketability → Employment →Income

Point of Caution: Causal Stories and Defining/Framing Societal Problems • Stories of societal problems are oftentimes conflictual – Poverty – why does it exist? • Individual story for poverty • Laziness, poor behavioral life choices, etc. • External/structural story for poverty • Globalization, de-industrialization, discrimination, etc. • Perpetual battle among advocates, academics, and policymakers over the “true” stories or causes of underlying societal problems and how we should fix them with different policy solutions • Drug abuse? Climate change? Immigration? Crime?

Relationship • Researchers are interested in studying relationships that exist in the real-world • Relationship – the association or covariance of the values of one variable with values of another • The relationship between the two variables should be developed from theory

Hypothesis • A hypothesis is a testable statement of a relationship between two variables – An empirical claim that is testable and “falsifiable” (claim can be proven false)

Hypotheses • Hypotheses should be brief empirical statements • They should be educated guesses about relationships that exist in the real world – Theory informs your guesses about the world • Should not be statements about what “ought to be true” or about what a researcher personally believes as articles of faith – Should be non-normative and empirically based

Hypotheses – Generic Examples • Participation in a job training program increases employment and income levels • Participation in a substance abuse program decreases the likelihood of drug overdose • Higher salary levels increase employee job satisfaction • Higher levels of job satisfaction decrease levels of employee turnover
 • More conservative municipalities will be more likely to")
Hypotheses – Examples (cont. ) • More conservative municipalities will be more likely to contract prison services with for-profit firms • Private prisons will be more effective at successfully rehabilitating prisoners than public prisons • Charter schools will produce higher levels of student achievement than public schools • Participation in the Women, Infants and Children program improves child nutrition outcomes

Good Hypotheses • Are the logical implication of theory – Hypotheses are plausible and have compelling story • Are stated in explicit, empirical, testable terms – Weaknesses with generic hypotheses presented here? • Clearly specify a relationship between an independent variable and dependent variable

Dependent and Independent Variables • Dependent Variable – The phenomenon we are trying to explain (Y) - The “outcome” or “effect” we are interested in explaining (levels of employment, income, student achievement, job satisfaction, homelessness, air quality, program performance, etc. ) • Independent Variable – explains variation or differences in dependent variable (X) – Factors that influence the dependent variable or the outcome of interest – Independent variables are the “causes”, “predictors” or “explanatory” variables
 • Usually more than one independent variable • Example: public employee")
Independent Variables (Xs) • Usually more than one independent variable • Example: public employee job satisfaction (dependent variable) can be explained by: – Independent variables: Salary, fringe benefits, occupation (type of work), flexibility of hours, relationship with superiors, relationships with colleagues, among other independent variables • “Control for” other rival independent variables (also known as “control variables”) – What variables other than program participation might influence employment and income levels?
 – Both independent and dependent variables")
Direction of Hypotheses • Direct Relationship (positive relationship) – Both independent and dependent variables move in the same direction – As level of independent variable increases, the dependent variable also increases – As level of independent variable decreases, the dependent variable also decreases • Higher salary levels are associated with higher job satisfaction • Increased contracting with charter schools increases student achievement and graduation rates • Increased participation in a job training program increases levels of employment and income
 • Negative relationship (inverse relationship) – Independent and dependent")
Direction of Hypotheses (cont. ) • Negative relationship (inverse relationship) – Independent and dependent variables move in opposite directions – As level of independent variable increases, the dependent variable decreases – As level of independent variable decreases, the dependent variable increases • As job satisfaction increases, employee absenteeism decreases • Increasing participation in a job training program decreases levels of poverty • Increasing participation in a substance abuse program decreases level of drug overdoses
 • Null Hypothesis: states that there is no relationship")
Direction of Hypotheses (cont. ) • Null Hypothesis: states that there is no relationship between the independent variable and the dependent variable – Two variables are completely independent of one and other – One variable does not influence another variable in any meaningful way – Two variables are completely random and are unconnected to each other

Linear v. Nonlinear Relationships • Not all relationships are linear • Some have diminishing returns – Job training and salary level – Salary level and job satisfaction • Few are curvilinear – Age and likelihood of voting – Managerial goal setting and employee motivation

Spurious Relationships • Spurious Relationship: An observed relationship between X and Y is said to be spurious if there exists a third variable (Z), which is actually the true cause of the relationship. – The initial relationship between X and Y is false or not as explanatory, and can actually be explained by some other variable (Z). • Number of firefighters and residential deaths – Is there another variable (Z) that can account for this relationship? • Ice cream sales and drowning deaths – Is there another variable (Z) that can account for this relationship? • Minority presence and neighborhood crime levels – Is there another variable (Z) that can account for this relationship?

Goal of Research: Causal Inference • We can infer something about a dependent variable if we know about an independent variable. • We strive to make “causal inferences” • One variable actually causes another phenomenon to occur or change in magnitude

Causal Relationship • Change in one variable causes change in another variable to occur – Deterministic vs. Probabilistic relationships • Deterministic relationships (X ALWAYS causes change in Y) do not readily exist in the social sciences (human-based systems) • Humans are complicated and not always predictable • Probabilistic explanations more likely – X is likely associated with Y

Criteria for Determining Causality • Covariation – Both independent and dependent variable must vary with each other (some statistical association exists) • Time Dependence – Independent variable must come before dependent variable (cause must come before effect) • Plausibility of relationship (theoretical grounding) • ELIMINATION OF ALL RIVAL EXPLANATIONS for the changes observed in the dependent variable – This is the highest hurdle to climb in order to claim causality between variables

Research Design “The program that guides the investigator in the process of collecting, analyzing, and interpreting observations. It is a logical model of proof that allows the researcher to draw inferences concerning causal relations among the variables under investigation” (Nachmias and Nachmias, 2008)

Research Design • Research Design- plan that shows how a researcher intends to study an empirical question • Begin connecting “elements” of research: theory, hypotheses, subjects to be studied, variables and measurement, relationships among variables • Poor research design can produce insignificant and erroneous conclusions
 – Classic Experimental Design –")
Research Designs: Overview • Experimental Design (Designs for Explanation) – Classic Experimental Design – Quasi-Experimental Design • Field experiment (comparison group pretest/posttest) • Interrupted time-series analysis • Cross-sectional statistical analysis (I know this might seem counterintuitive but we can get close to causality – will explain later in the lecture) • Non-Experimental Designs (Designs for Description) – Cross-sectional description – Time-Series (non-interrupted) – Case-Studies (qualitative “thick description”) – Focus Groups – Meta Analysis – Cost-Benefit Analysis

5 minute break

Research Design: An Overview PPA 696 Dr. Butz

Criteria for Determining Causality • Covariation – Both independent and dependent variable must vary with each other (some statistical association exists) • Time Dependence – Independent variable must come before dependent variable (cause must come before effect) • Plausibility of relationship (theoretical grounding) • ELIMINATION OF ALL RIVAL EXPLANATIONS for the changes observed in the dependent variable – This is the highest hurdle to climb in order to claim causality between variables

Research Designs: Overview • Designs for Explanation – Classic Experimental Design – Quasi-Experimental Designs • Field experiment (comparison group pretest/posttest) • Interrupted time-series analysis • Cross-sectional statistical analysis (I know this might seem counterintuitive but we can get close to demonstrating causality – will explain later in the lecture) • Designs for Description – Cross-sectional description (non-explanatory) – Time-Series (non-interrupted) – Meta Analysis – Focus Groups – Case-Studies (“thick description” of few cases) – Cost-Benefit and Cost-Effectiveness Analysis
 – Could")
Characteristics of Classic Experimental Design • Two groups (experimental and control groups) – Could be more than one experimental group • Random assignment into groups • Researcher controls the experimental treatment (controls the independent variable or “stimulus”) • Researcher controls the external environment of the experiment (generally artificial laboratory setting) • Measure the dependent variable both before and after the stimulus is administered (pretest/posttest measurement of the dependent variable) – Ask ourselves: Has there been an “experimental effect”? – If so, how large is the effect?

Classic Experimental Design Randomly assign subjects into two groups • – Experimental Group – Receives the experimental “treatment” or “stimulus” (independent variable) – Control Group – Equivalent to the experimental group except the control group does not receive the experimental treatment/stimulus/independent variable

Random Assignment • Group membership is matter of random chance – Each individual has an equal probability (equal chance) of being in the experimental or control groups • SIGNIFICANCE: Random assignment ensures that the experimental and control groups are virtually identical in all respects

Experimental Test • Pretest: Questions asked before the individuals receive the experimental treatment – Initial measurement of the dependent variable (i. e. outcome or effect of interest) • Researcher then introduces the experimental treatment or independent variable (oftentimes program participation in PA and nonprofit research) • Posttest: Questions asked after the individuals receive the experimental treatment – Posttest measurement of the dependent variable (i. e. outcome or effect of interest)

Experimental Effect • Experimental Effect: Does the dependent variable change with introduction of stimulus? – One group receives the experimental effect, and the control group does not – Compare the differences in the pre and post-tests to find the impact of the experimental effect – Example 3. 1: p. 71 -72 (ORB) – “A Controlled Experiment in Teaching Students to Respond to Patients’ Emotional Concerns”

“Controlled Experiment in Teaching Students to Respond to Patients’ Emotional Concerns” Experimental Group Control Group 0. 681 0. 891 X 2. 022 1. 132 • Experimental Effect = (O 2(experimental) - O 1(experimental)) - (O 2 (control) - O 1 (control)) • Experimental Effect = (2. 022(exp) -. 681(exp)) - (1. 132 (control) -. 891 (control)) (1. 34) – (0. 24) = 1. 10 Experimental Effect

Classic Experimental Group Control Group RO 1 X RO 1 O 2 • R = Random assignment • O = Outcome (dependent variable) • X = Experimental Treatment (independent variable) • Experimental Effect = (O 2(experimental) - O 1(experimental)) - (O 2 (control) - O 1 (control)) • If posttest only = O 2(experimental) – O 2(control)
")
Classic Experimental Design 1. Randomly assign subjects into two groups (experimental and control groups) 2. Pretest measure of dependent variable for all groups (Note: Could be posttest measurement only, especially if worried about testing effects and “priming” subjects) 3. Introduce the stimulus (independent variable) 4. Posttest measure dependent variable for each group 5. If the change in the value of the dependent variable varies significantly across groups, then we conclude that X Y (X causes change in Y)

Internal Validity and the Results of a Classic Experimental Design • What is “internal validity”? • What does it mean to say that a classic experimental approach is “internally valid”?

Internal Validity and the Results of a Classic Experimental Design • Internal Validity: Researchers can claim that introduction of the experimental stimulus (independent variable) itself, and not some other variable, did in fact cause change in the dependent variable. • Thus, internal validity is referring to our confidence that the primary independent variable of interest (i. e. program intervention) and not some other rival, lurking variable is what causes change in the dependent variable.

Threats to Internal Validity • • History Maturation Selection Biases Experimental Mortality Testing Effects Design Contamination Instrumentation

History • External events between the pre-test and posttest measurements of the dependent variable can influence the results, not the independent variable • Events like 9/11, Hurricane Katrina, economic recession or other external events might influence outcomes

Maturation • Any change in subjects over time – unrelated to the independent variable or stimulus – that might influence the dependent variable (outcome or effect) – Change in individuals beliefs, attitudes, or physical condition • This particularly important for long running experiments. As you increase the length of time the greater chance for client maturation effects. • Not reacting to experimental stimulus per say, but to changing emotions and changing personal circumstances

Selection Biases • Selection of subjects into the control and experimental groups that is not random – Researchers cherry-pick subjects to be in groups – Individuals “self-select” themselves into the experimental group (“selecting-into” a program) – Why is this problematic? Characteristics of individuals comprising the experimental group are systematically different from those comprising the control group • May introduce differences between groups that cannot be controlled for easily

Experimental Mortality • Individual subjects participating in the experimental design drop out prematurely – Those “selecting-out” might be systematically different from those remaining in the experiment – Delinquency program example (P. 62) • Those remaining in the program were highly motivated to remain in school, while those dropping out were unmotivated – Levels of motivation not the program influenced delinquency rates across the two groups
 • Using a pre-test may alert subjects to what you")
Testing (Reactivity of Measurement) • Using a pre-test may alert subjects to what you are testing for – Subjects are now aware of the experimental design and this may influence the results – Subjects react to the pre-test by altering behavior, influencing the dependent variable not the stimulus/independent variable – Oftentimes better to skip pretesting phase!

Design Contamination • Various reasons for contamination • Subjects talk among themselves and share information contaminating the effect of stimulus • Hawthorne Effect – Hawthorne Studies – Different behaviors in the experimental groups because they knew they were being observed • Found increasing productivity even under miserable low-light conditions (nearly equivalent to moon light) – Less morale in the control groups • Found decreasing productivity working under normal lighting conditions

Instrumentation • The instrument utilized for pretest and posttest measures the dependent variable are different – Hard copy to online measurement – Changing questions or definitions of concepts • Studying drug crimes in Colorado?

External Validity and the Results of a Classic Experimental Design • What is “external validity”?

External Validity • External Validity: extent to which the results of an experiment can be generalized across populations, time periods, and settings • Generalizable to other settings in the real world? – From sample to broader population – Unique program features – Unique settings and locations – History effects (i. e. local events that occur)

Research Designs: Overview • Quasi-Experimental Designs • Field experiments • Interrupted time series analysis • Cross-sectional analysis (with sophisticated statistical techniques and multiple independent variables or “control variables” we can improve internal validity and get close to causality!) • Designs for Description (describing not explaining variables) – Cross-Sectional (purely descriptive) – Time Series (no independent variable other than time) – Meta Analysis – Focus Groups – Case studies (qualitative “thick description”) – Cost-Benefit and Cost-Effectiveness Analysis

Quasi-Experimental Design • Comparison group posttest design – Takes place in natural settings • “Field Experiment” – Subjects (experimental & control groups) are not created by random assignment – evaluator does not control random assignment because program is in operation • Thus, undertake random sampling among existing program participants then match with group of non-participants • Control group now called the “comparison group” • OUT Drug Treatment Program Effectiveness

Building a Comparison Group 1. Waiting lists – potential program clients, who have not yet been approved for full participation 2. Similar group of individuals within the same organization who are not participating in the program – Similar group of prisoners in the same prison – Similar group of students in the same school 3. Similar group outside of the organization or in another locale who are not participating in the program

Time Series Analysis • Descriptive time series – Measures dependent variable over time – Time only independent variable (purely descriptive) • Explanatory time series – Interrupted time series approach – Introduces another independent variable other than time • Policy or program adoption “interruption” • Looks for patterns over time – Before and after the independent variable or “interruption” occurs
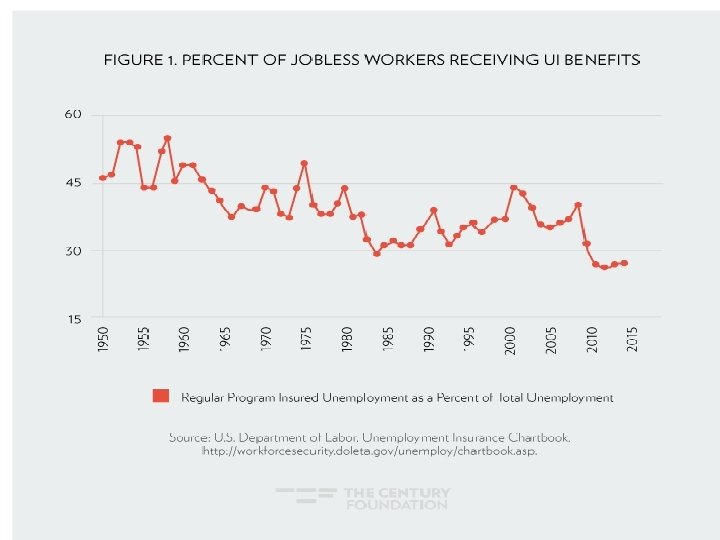

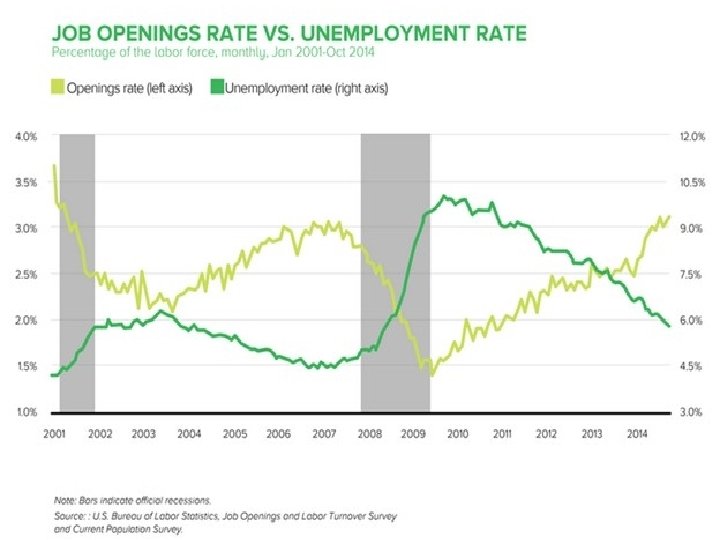
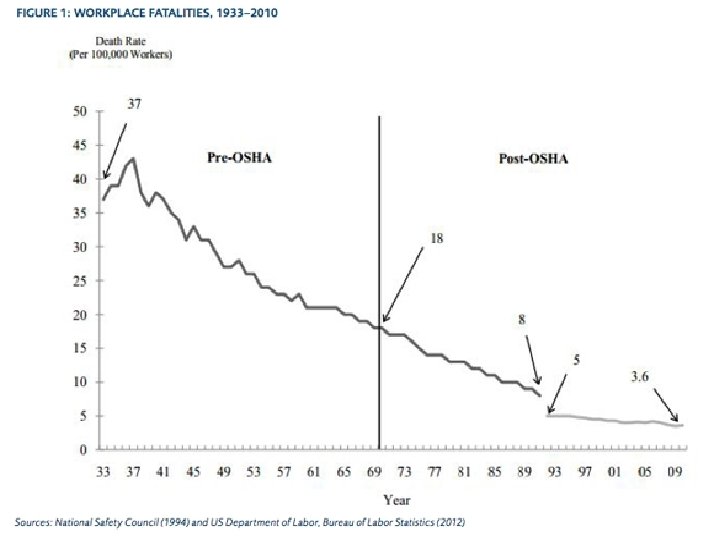
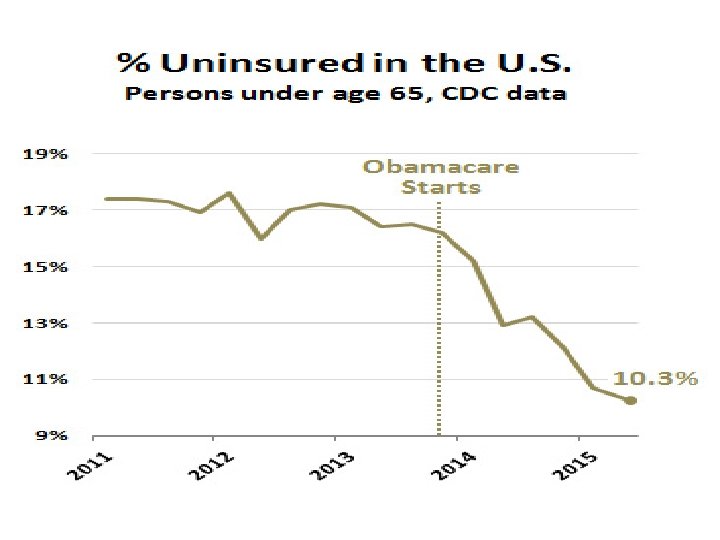
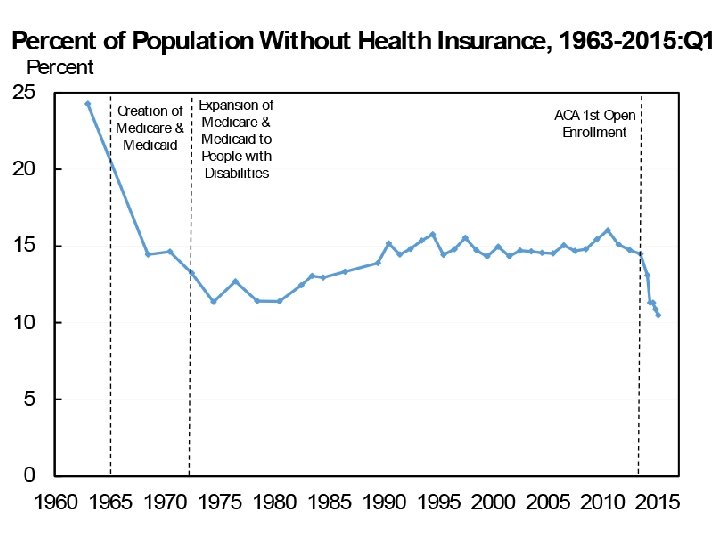
Interrupted time-series design • Pretest and posttest measures of the dependent variable (measurements before and after stimulus – e. g. before and after adoption of a public program) • Examples: • • • Welfare Reform Program Adoption and Welfare Caseloads Stand-Your-Ground Adoption and Gun Deaths Recession and Unemployment OSHA and Occupational deaths Affordable Care Act and Uninsured

Interrupted Time Series

Interrupted Time Series

Cross-Sectional Statistical Design – Observations for IV and DV are recorded across multiple units at a single point in time • Surveys (across individuals) • Aggregate units (across organizations, cities, counties, states, regions, countries) – “Snapshot” approach – measures DV and IVs across multiple units at one point in time – Oftentimes used with “secondary data” analysis – data that has already been collected by other researchers and is available publicly

Descriptive Cross-Sectional Example • Welfare Privatization Levels Across the U. S. States for the year 2001 • Could be a cross-section of: individuals (survey), organizations, cities, counties, school districts, countries, etc. depending on what you are interested in studying
. “State renewable energy policies: An empirical evaluation of")
Quasi-Experimental Cross-Sectional Example Carly, S. (2009). “State renewable energy policies: An empirical evaluation of effectiveness” - Independent Variable: Collected data on state-level renewable energy policies for the year 2006 - Included several other “control variables” in the analysis - Dependent Variable: State-level percentage of renewable energy generation for the year 2006 - Performed statistical analysis to find relationships - Found insignificant results for the policy variable

Many Examples of Aggregate Cross-Sectional Research Design in Policy Evaluation • Welfare-to-work programs • Education programs • Minimum wage policies • Environmental policies • Exploit naturally existing variation (i. e. policy or program differences) at the city-level, county-level, state-level, country -level, etc. and relate to outcomes of interest

Meta-Analysis • Finding statistical patterns across large number of research studies Lundahl, et al. (2007). “Prison Privatization: A Meta. Analysis of Cost Effectiveness and Quality of Confinement Indicators”. Utah Criminal Justice Center at the University of Utah. Prison Privatization Meta-Analysis
 • Foundations of program evaluation and additional research techniques – Program")
Next Week (10/19) • Foundations of program evaluation and additional research techniques – Program evaluation and evaluation research – Case study approach – Cost-benefit analysis – Cost-effectiveness analysis
- Slides: 71