Introduction of Machine Deep Learning Hungyi Lee Machine


, the function outputs the correct one.")
 Regression, Classification")


 2021/01/01 2021/02/14")


")


")


- Slides: 61
Introduction of Machine / Deep Learning Hung-yi Lee 李宏毅
Machine Learning ≈ Looking for Function • Speech Recognition “How are you” • Image Recognition “Cat” • Playing Go “ 5 -5” (next move)
Different types of Functions Regression: The function outputs a scalar. Predict PM 2. 5 today temperature Concentration of O 3 f PM 2. 5 of tomorrow Classification: Given options (classes), the function outputs the correct one. Spam filtering f Yes/No
Different types of Functions Classification: Given options (classes), the function outputs the correct one. Each position is a class (19 x 19 classes) Function Playing GO a position on the board Next move
Structured Learning create something with structure (image, document) Regression, Classification
How to find a function? A Case Study
You. Tube Channel https: //www. youtube. com/c/Hungyi. Lee. NTU
The function we want to find … no. of views on 2/26
1. Function with Unknown Parameters based on domain knowledge Model feature weight bias
Ø Loss is a function of parameters 2. Define Loss from Training Data Ø Loss: how good a set of values is. How good it is? Data from 2017/01/01 – 2020/12/31 2017/01/01 01/02 01/03 4. 9 k 7. 5 k 4. 8 k 5. 3 k label 4. 9 k …… 2020/12/30 12/31 3. 4 k 9. 8 k
Ø Loss is a function of parameters 2. Define Loss from Training Data Ø Loss: how good a set of values is. How good it is? Data from 2017/01/01 – 2020/12/31 2017/01/01 4. 8 k 01/02 01/03 4. 9 k 7. 5 k …… 2020/12/30 12/31 3. 4 k 9. 8 k 5. 4 k 4. 9 k 7. 5 k 9. 8 k
Ø Loss is a function of parameters 2. Define Loss from Training Data Ø 4. 8 k Loss: how good a set of values is. 4. 9 k Loss: 4. 9 k Cross-entropy
Ø Loss is a function of parameters 2. Define Loss from Training Data Ø Model Error Surface Loss: how good a set of values is.
Source of image: http: //chico 386. pixnet. net/album/photo/171572850 3. Optimization Gradient Descent Ø Compute Negative Increase w Positive Decrease w
Source of image: http: //chico 386. pixnet. net/album/photo/171572850 3. Optimization Gradient Descent Ø Compute hyperparameters
Source of image: http: //chico 386. pixnet. net/album/photo/171572850 3. Optimization Gradient Descent Ø Compute Does local minima truly cause the problem? Local minima global minima
3. Optimization Ø Compute Can be done in one line in most deep learning frameworks
Model 3. Optimization
Machine Learning is so simple …… Step 1: function with unknown Step 2: define loss from training data Step 3: optimization
Machine Learning is so simple …… Step 1: function with unknown Step 2: define loss from training data Step 3: optimization Training How about data of 2021 (unseen during training)?
Red: real no. of views blue: estimated no. of views Views (k) 2021/01/01 2021/02/14
0. 05 k 0. 79 -0. 31 2017 - 2020 2021 0. 12 -0. 01 -0. 10 0. 30 2017 - 2020 2021 Linear models 0. 18
Linear models are too simple … we need more sophisticated modes. Linear models have severe limitation. Model Bias We need a more flexible model!
red curve = constant + sum of a set of 1 3 0 2
All Piecewise Linear Curves = constant + sum of a set of More pieces require more
Beyond Piecewise Linear? Approximate continuous curve by a piecewise linear curve. To have good approximation, we need sufficient pieces.
red curve = constant + sum of a set of How to represent this function? Sigmoid Function Hard Sigmoid
Change slopes Shift Change height
red curve = sum of a set of + constant 1 3 0 0 1 + 2 + 3 2
New Model: More Features
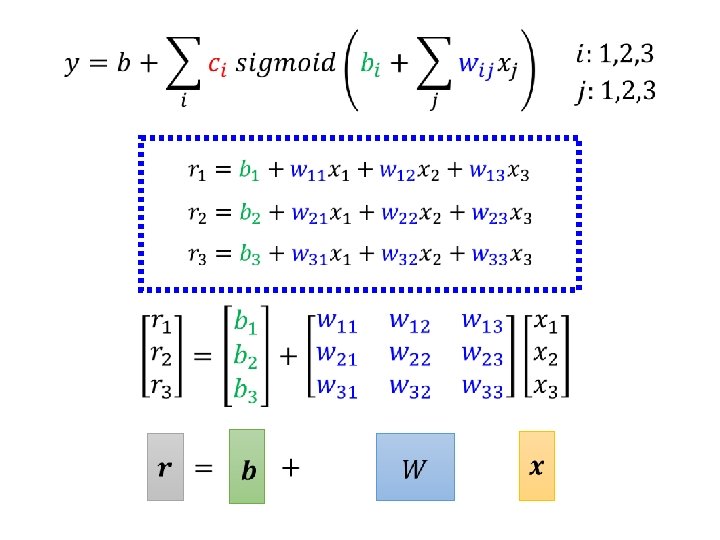
no. of features 1 no. of sigmoid + 1 2 + 1 3 + 1
1 + 1 2 + 1 3 + 1
1 + 1 2 + 1 3 + 1
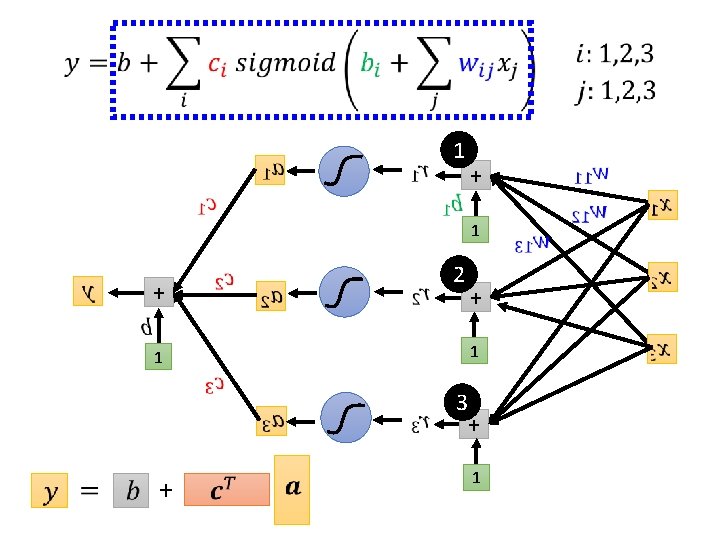
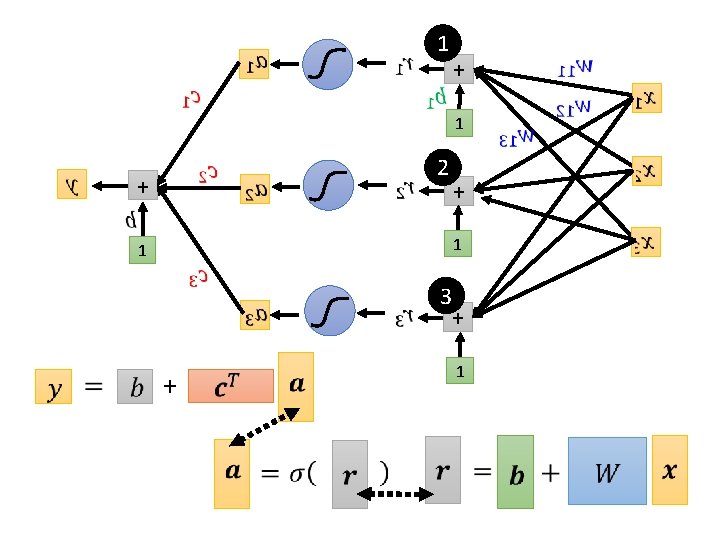
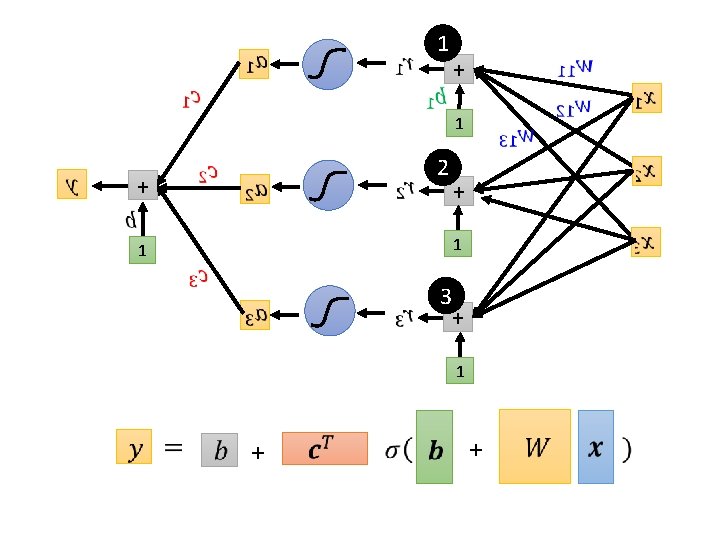
Function with unknown parameters + + feature …… Unknown parameters
Back to ML Framework Step 1: function with unknown Step 2: define loss from training data + Step 3: optimization +
Loss Ø Loss is a function of parameters Ø Loss means how good a set of values is. feature + label + Given a set of values Loss:
Back to ML Framework Step 1: function with unknown Step 2: define loss from training data + Step 3: optimization +
Optimization of New Model gradient
Optimization of New Model
Optimization of New Model B update batch N update batch 1 epoch = see all the batches once
Optimization of New Model Example 1 B Ø 10, 000 examples (N = 10, 000) Ø Batch size is 10 (B = 10) How many update in 1 epoch? 1, 000 updates Example 2 batch Ø 1, 000 examples (N = 1, 000) Ø Batch size is 100 (B = 100) How many update in 1 epoch? 10 updates batch N batch
Back to ML Framework Step 1: function with unknown Step 2: define loss from training data + Step 3: optimization + More variety of models …
How to represent this function? Rectified Linear Unit (Re. LU)
Activation function Which one is better?
Experimental Results 2017 – 2020 2021 linear 0. 32 k 0. 46 k 10 Re. LU 0. 32 k 0. 45 k 100 Re. LU 0. 28 k 0. 43 k 1000 Re. LU 0. 27 k 0. 43 k
Back to ML Framework Step 1: function with unknown Step 2: define loss from training data + Step 3: optimization + Even more variety of models …
Experimental Results • Loss for multiple hidden layers • 100 Re. LU for each layer • input features are the no. of views in the past 56 days 2017 – 2020 2021 1 layer 0. 28 k 0. 43 k 2 layer 0. 18 k 0. 39 k 3 layer 0. 14 k 0. 38 k 4 layer 0. 10 k 0. 44 k
3 layers Red: real no. of views blue: estimated no. of views Views (k) ? 2021/01/01 2021/02/14
Back to ML Framework Step 1: function with unknown Step 2: define loss from training data Step 3: optimization + + It is not fancy enough. Let’s give it a fancy name!
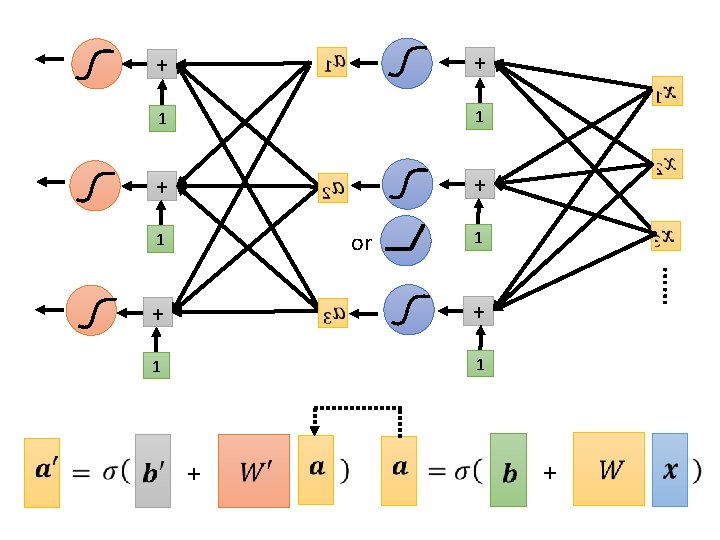
hidden layer + + 1 1 + + 1 Neural Network Neuron …… hidden layer 1 This mimics human brains … (? ? ? ) Many layers means Deep Learning
Deep = Many hidden layers 22 layers http: //cs 231 n. stanford. e du/slides/winter 1516_le cture 8. pdf 19 layers 8 layers 7. 3% 6. 7% 16. 4% Alex. Net (2012) VGG (2014) Google. Net (2014)
Deep = Many hidden layers 152 layers 101 layers Special structure Why we want “Deep” network, not “Fat” network? 16. 4% Alex. Net (2012) 7. 3% VGG (2014) 3. 57% 6. 7% Google. Net (2014) Residual Net (2015) Taipei 101
Why don’t we go deeper? • Loss for multiple hidden layers • 100 Re. LU for each layer • input features are the no. of views in the past 56 days 2017 – 2020 2021 1 layer 0. 28 k 0. 43 k 2 layer 0. 18 k 0. 39 k 3 layer 0. 14 k 0. 38 k 4 layer 0. 10 k 0. 44 k
Why don’t we go deeper? • Loss for multiple hidden layers • 100 Re. LU for each layer • input features are the no. of views in the past 56 days 2017 – 2020 2021 1 layer 0. 28 k 0. 43 k 2 layer 0. 18 k 0. 39 k 3 layer 0. 14 k 0. 38 k 4 layer 0. 10 k 0. 44 k Better on training data, worse on unseen data Overfitting
Let’s predict no. of views today! • If we want to select a model for predicting no. of views today, which one will you use? 2017 – 2020 2021 1 layer 0. 28 k 0. 43 k 2 layer 0. 18 k 0. 39 k 3 layer 0. 14 k 0. 38 k 4 layer 0. 10 k 0. 44 k We will talk about model selection next time.
To learn more …… Backpropagation Basic Introduction Computing gradients in an efficient way https: //youtu. be/Dr-WRl. EFefw https: //youtu. be/ib. Jp. Trp 5 mc. E