
Introduction Materials testing is a diligent approach to
- Slides: 28
Introduction Materials testing is a diligent approach to ensuring that your infrastructure and vital equipment will provide continued production, undergo minimal degradation and are designed with optimal performance in mind. Materials testing can also supply a wealth of information about the materials you are developing or incorporating into products to ensure they perform within expected specifications. Ensuring that crucial materials are fit for purpose presents a challenge to developers, operators and manufacturers across many industries globally. You need assurance that your equipment and infrastructure will perform to the end of its design life with minimal maintenance, failure mitigation and with mechanical strength prioritized and planned for. It is an important for Materials engineers to understand how the various properties of materials are measured and what those represents, the may be called upon to design structure/components using predetermined materials such that unacceptable level of fracture and failure will not occur. Many materials when in service, it subjected to a load such as tensile, compressive and shear. Factors to be considered are nature of the applied load, its duration and the environment conditions.
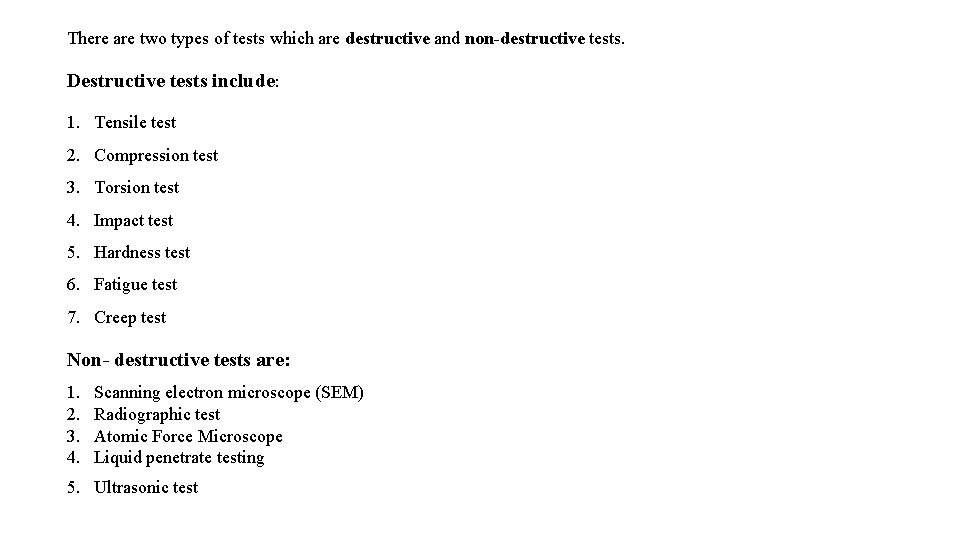
There are two types of tests which are destructive and non-destructive tests. Destructive tests include: 1. Tensile test 2. Compression test 3. Torsion test 4. Impact test 5. Hardness test 6. Fatigue test 7. Creep test Non- destructive tests are: 1. 2. 3. 4. Scanning electron microscope (SEM) Radiographic test Atomic Force Microscope Liquid penetrate testing 5. Ultrasonic test
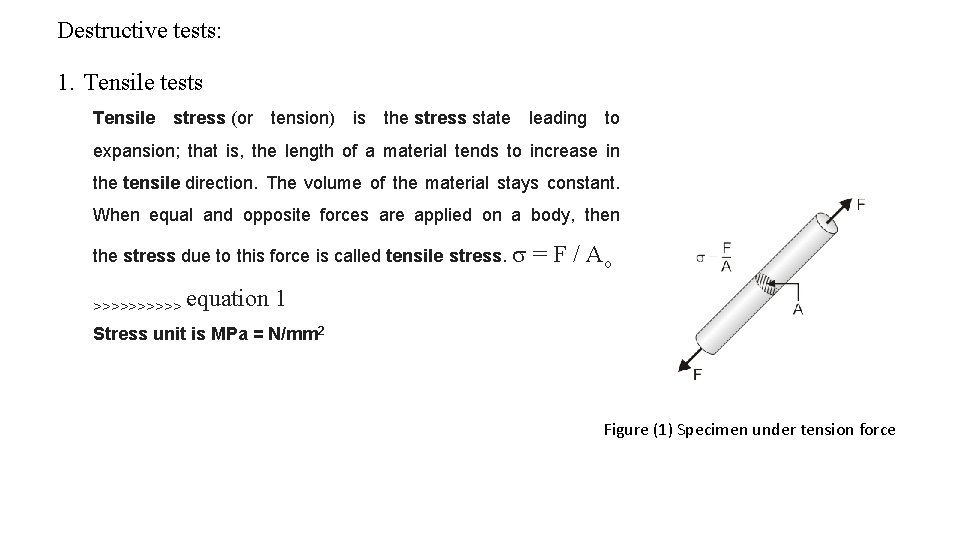
Destructive tests: 1. Tensile tests Tensile stress (or tension) is the stress state leading to expansion; that is, the length of a material tends to increase in the tensile direction. The volume of the material stays constant. When equal and opposite forces are applied on a body, then the stress due to this force is called tensile stress. = F / Ao >>>>> equation 1 Stress unit is MPa = N/mm 2 Figure (1) Specimen under tension force
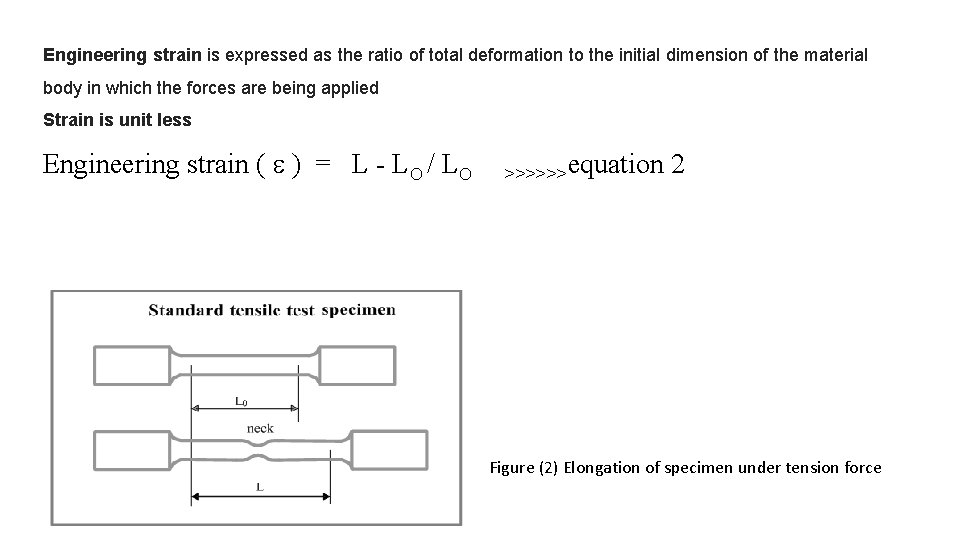
Engineering strain is expressed as the ratio of total deformation to the initial dimension of the material body in which the forces are being applied Strain is unit less Engineering strain ( ) = L - L / L >>>>>>equation 2 Figure (2) Elongation of specimen under tension force
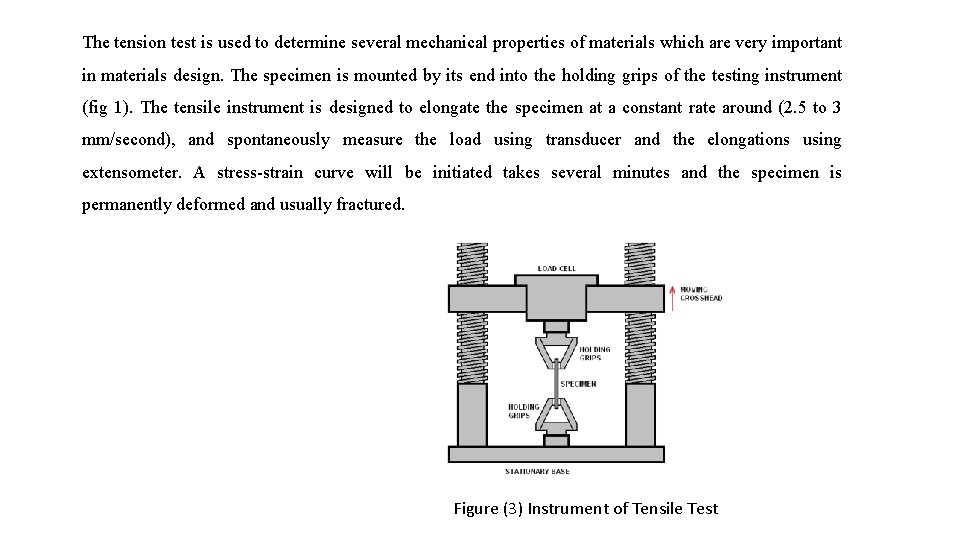
The tension test is used to determine several mechanical properties of materials which are very important in materials design. The specimen is mounted by its end into the holding grips of the testing instrument (fig 1). The tensile instrument is designed to elongate the specimen at a constant rate around (2. 5 to 3 mm/second), and spontaneously measure the load using transducer and the elongations using extensometer. A stress-strain curve will be initiated takes several minutes and the specimen is permanently deformed and usually fractured. Figure (3) Instrument of Tensile Test
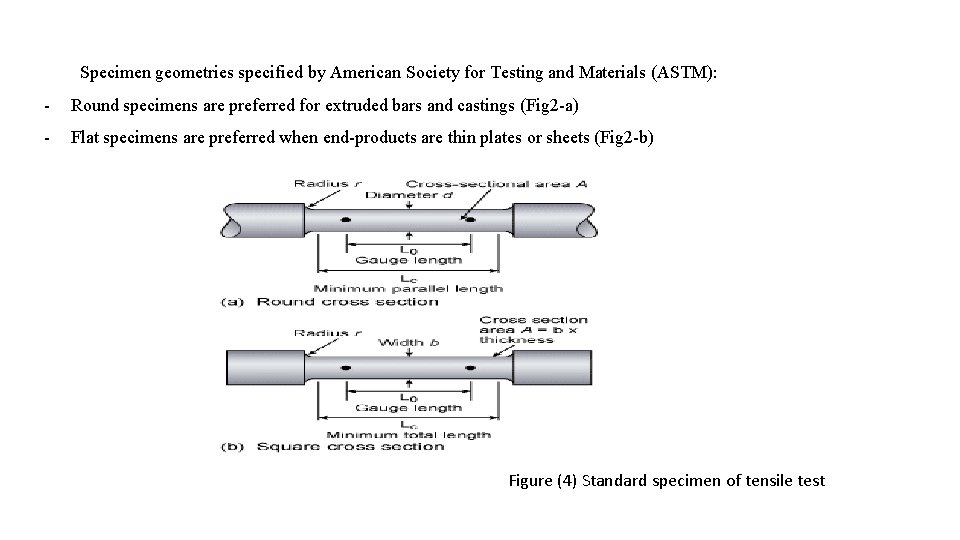
Specimen geometries specified by American Society for Testing and Materials (ASTM): - Round specimens are preferred for extruded bars and castings (Fig 2 -a) - Flat specimens are preferred when end-products are thin plates or sheets (Fig 2 -b) Figure (4) Standard specimen of tensile test
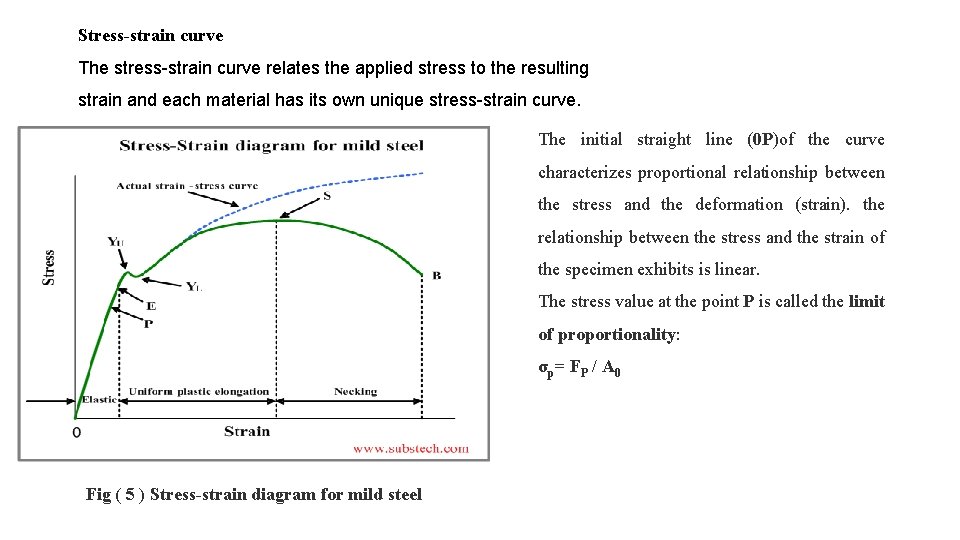
Stress-strain curve The stress-strain curve relates the applied stress to the resulting strain and each material has its own unique stress-strain curve. The initial straight line (0 P)of the curve characterizes proportional relationship between the stress and the deformation (strain). the relationship between the stress and the strain of the specimen exhibits is linear. The stress value at the point P is called the limit of proportionality: σp= FP / A 0 Fig ( 5 ) Stress-strain diagram for mild steel
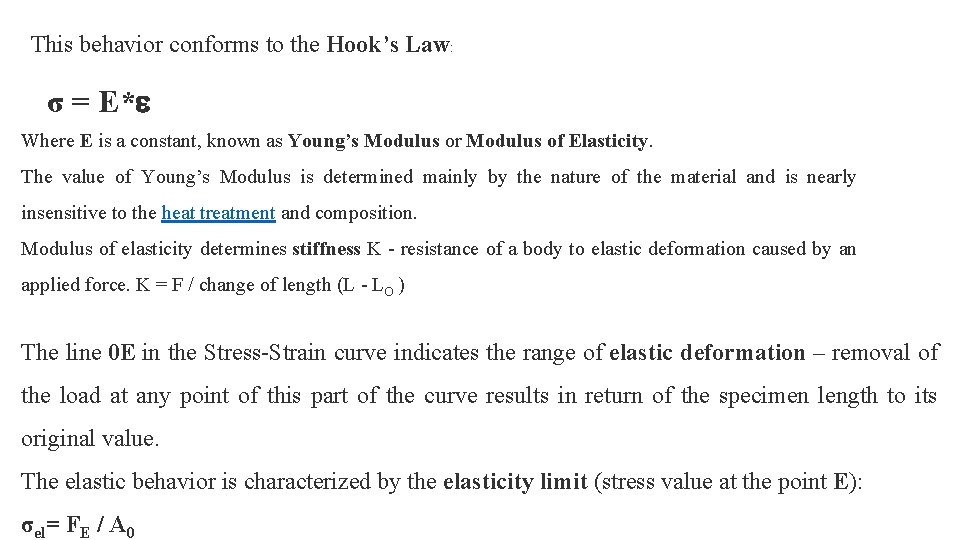
This behavior conforms to the Hook’s Law: σ = E* Where E is a constant, known as Young’s Modulus or Modulus of Elasticity. The value of Young’s Modulus is determined mainly by the nature of the material and is nearly insensitive to the heat treatment and composition. Modulus of elasticity determines stiffness K - resistance of a body to elastic deformation caused by an applied force. K = F / change of length (L - L ) The line 0 E in the Stress-Strain curve indicates the range of elastic deformation – removal of the load at any point of this part of the curve results in return of the specimen length to its original value. The elastic behavior is characterized by the elasticity limit (stress value at the point E): σel= FE / A 0
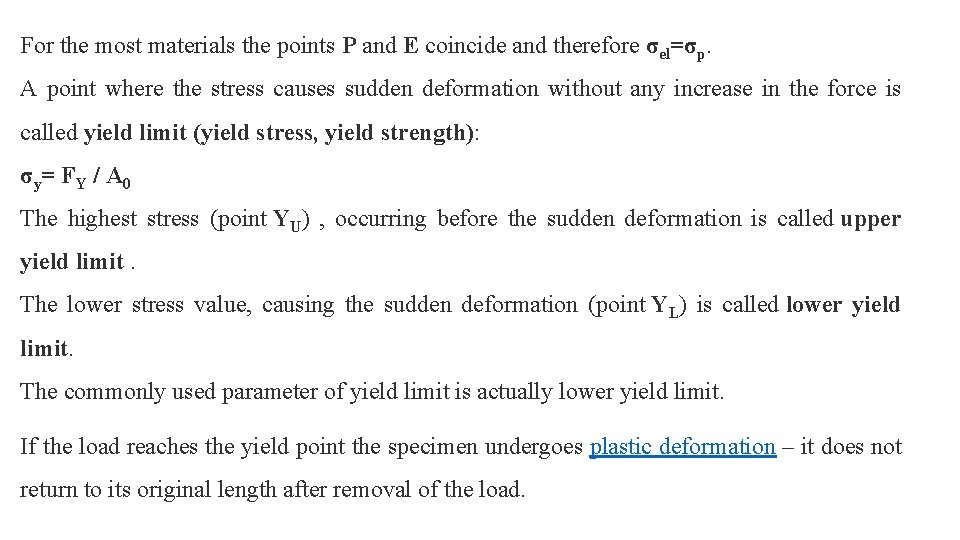
For the most materials the points P and E coincide and therefore σel=σp. A point where the stress causes sudden deformation without any increase in the force is called yield limit (yield stress, yield strength): σy= FY / A 0 The highest stress (point YU) , occurring before the sudden deformation is called upper yield limit. The lower stress value, causing the sudden deformation (point YL) is called lower yield limit. The commonly used parameter of yield limit is actually lower yield limit. If the load reaches the yield point the specimen undergoes plastic deformation – it does not return to its original length after removal of the load.
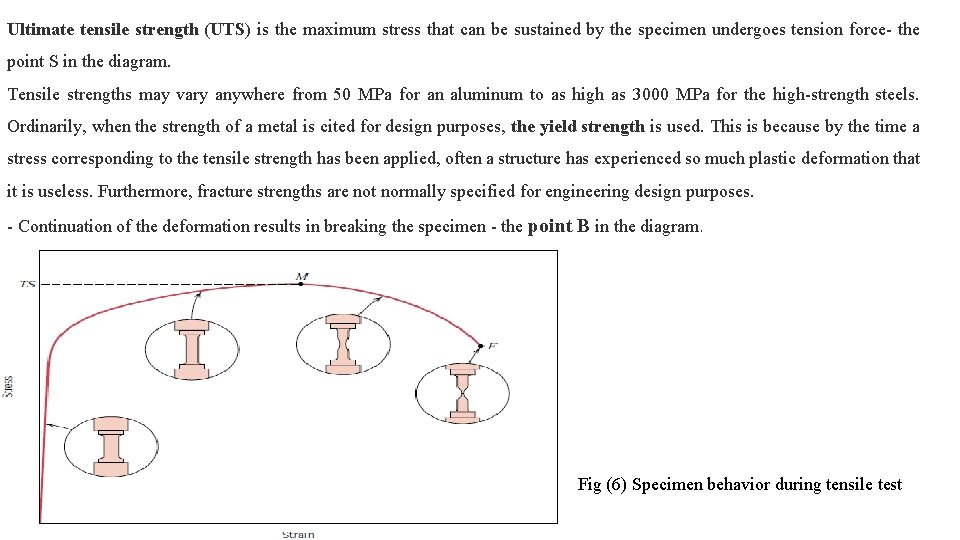
Ultimate tensile strength (UTS) is the maximum stress that can be sustained by the specimen undergoes tension force- the point S in the diagram. Tensile strengths may vary anywhere from 50 MPa for an aluminum to as high as 3000 MPa for the high-strength steels. Ordinarily, when the strength of a metal is cited for design purposes, the yield strength is used. This is because by the time a stress corresponding to the tensile strength has been applied, often a structure has experienced so much plastic deformation that it is useless. Furthermore, fracture strengths are not normally specified for engineering design purposes. - Continuation of the deformation results in breaking the specimen - the point B in the diagram. Fig (6) Specimen behavior during tensile test
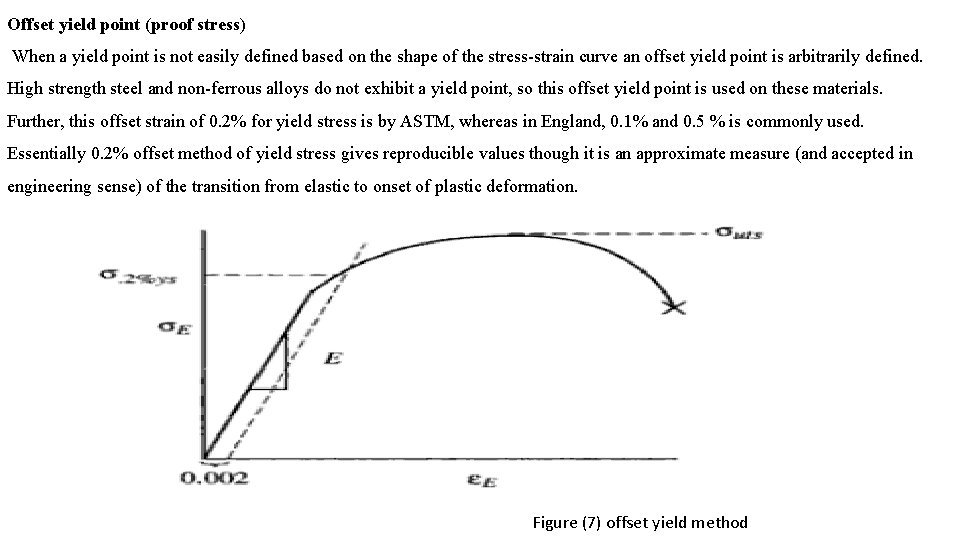
Offset yield point (proof stress) When a yield point is not easily defined based on the shape of the stress-strain curve an offset yield point is arbitrarily defined. High strength steel and non-ferrous alloys do not exhibit a yield point, so this offset yield point is used on these materials. Further, this offset strain of 0. 2% for yield stress is by ASTM, whereas in England, 0. 1% and 0. 5 % is commonly used. Essentially 0. 2% offset method of yield stress gives reproducible values though it is an approximate measure (and accepted in engineering sense) of the transition from elastic to onset of plastic deformation. Figure (7) offset yield method
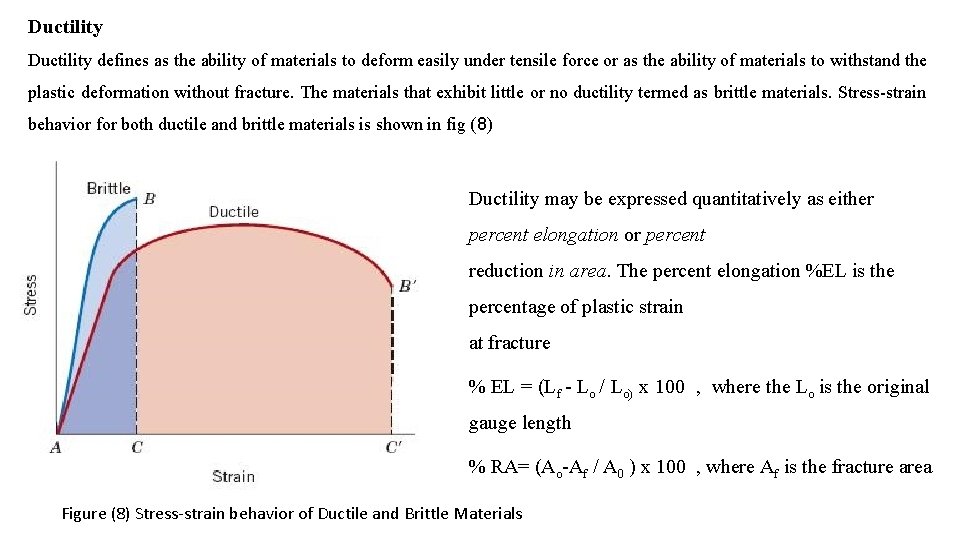
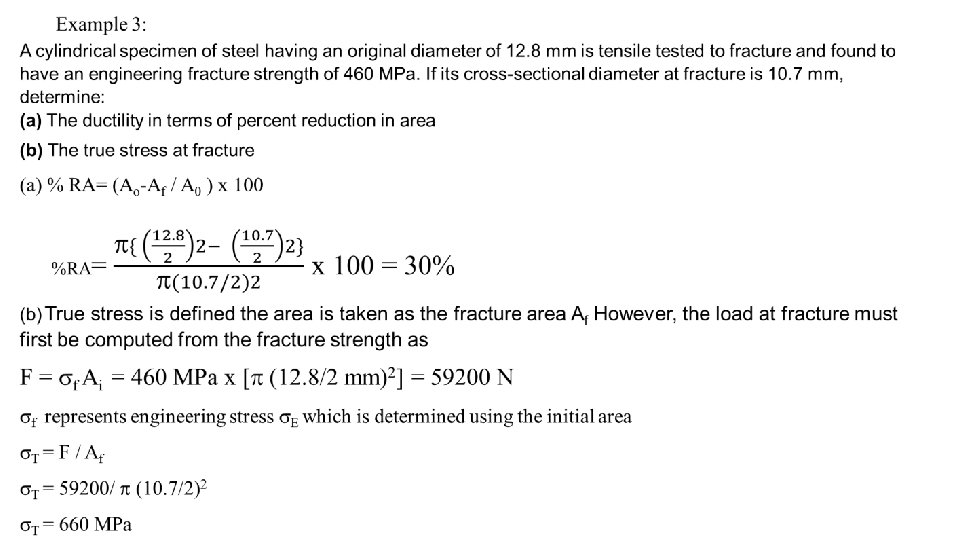
Ductility defines as the ability of materials to deform easily under tensile force or as the ability of materials to withstand the plastic deformation without fracture. The materials that exhibit little or no ductility termed as brittle materials. Stress-strain behavior for both ductile and brittle materials is shown in fig (8) Ductility may be expressed quantitatively as either percent elongation or percent reduction in area. The percent elongation %EL is the percentage of plastic strain at fracture % EL = (Lf - Lo / Lo) x 100 , where the Lo is the original gauge length % RA= (Ao-Af / A 0 ) x 100 , where Af is the fracture area Figure (8) Stress-strain behavior of Ductile and Brittle Materials
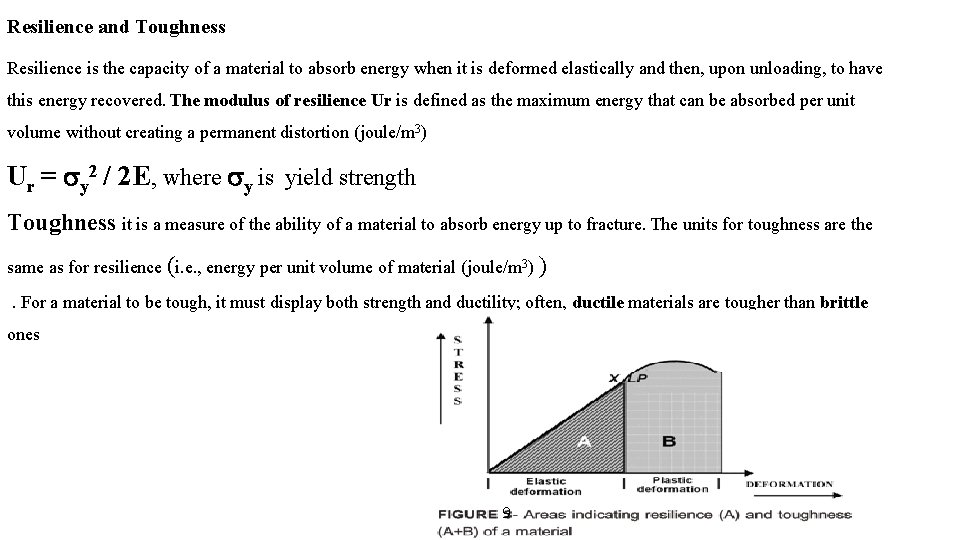
Resilience and Toughness Resilience is the capacity of a material to absorb energy when it is deformed elastically and then, upon unloading, to have this energy recovered. The modulus of resilience Ur is defined as the maximum energy that can be absorbed per unit volume without creating a permanent distortion (joule/m 3) Ur = y 2 / 2 E, where y is yield strength Toughness it is a measure of the ability of a material to absorb energy up to fracture. The units for toughness are the same as for resilience (i. e. , energy per unit volume of material (joule/m 3) ) . For a material to be tough, it must display both strength and ductility; often, ductile materials are tougher than brittle ones 9
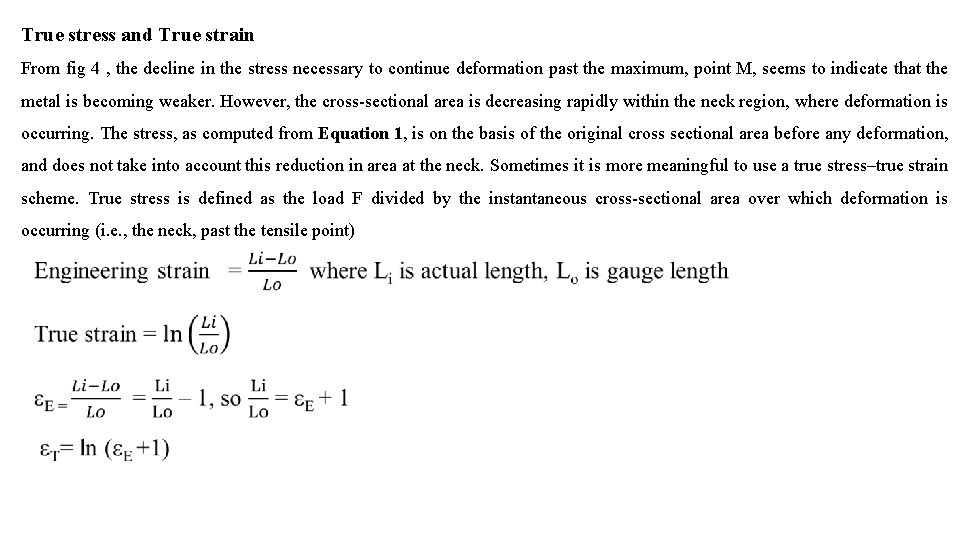
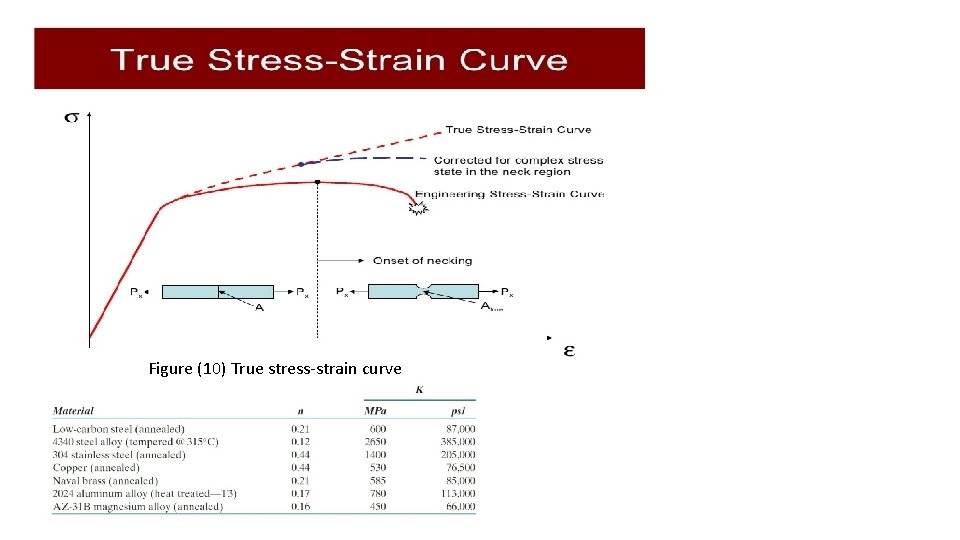
True stress and True strain From fig 4 , the decline in the stress necessary to continue deformation past the maximum, point M, seems to indicate that the metal is becoming weaker. However, the cross-sectional area is decreasing rapidly within the neck region, where deformation is occurring. The stress, as computed from Equation 1, is on the basis of the original cross sectional area before any deformation, and does not take into account this reduction in area at the neck. Sometimes it is more meaningful to use a true stress–true strain scheme. True stress is defined as the load F divided by the instantaneous cross-sectional area over which deformation is occurring (i. e. , the neck, past the tensile point)
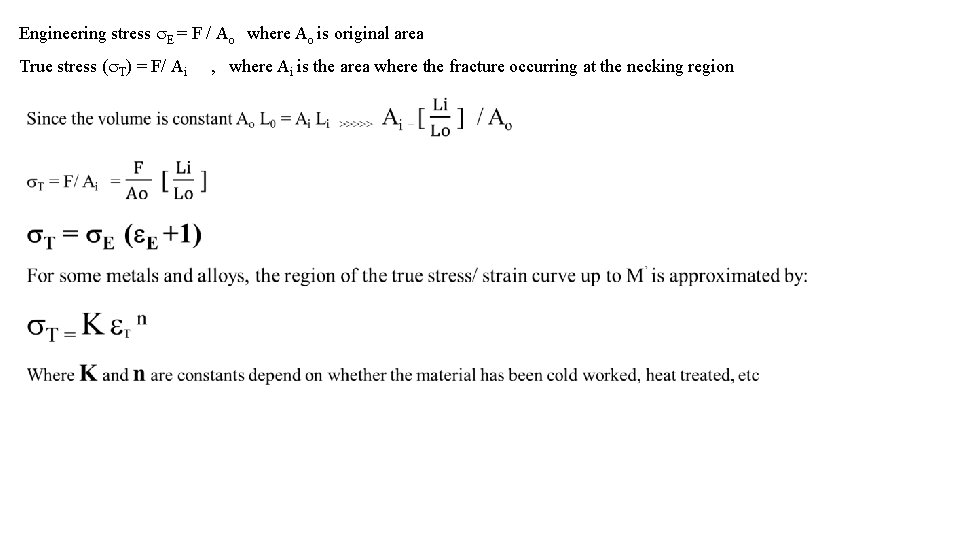
Engineering stress E = F / Ao where Ao is original area True stress ( T) = F/ Ai , where Ai is the area where the fracture occurring at the necking region
Figure (10) True stress-strain curve
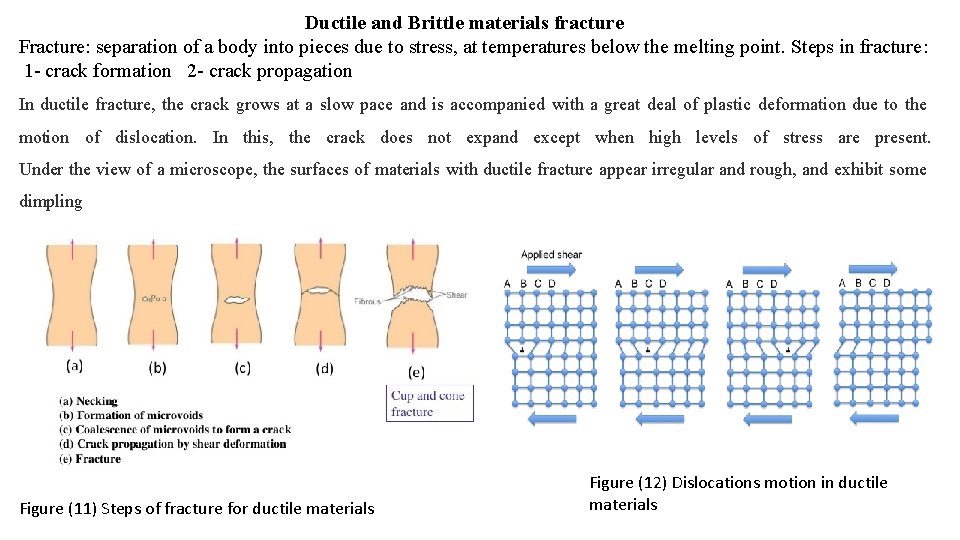
Ductile and Brittle materials fracture Fracture: separation of a body into pieces due to stress, at temperatures below the melting point. Steps in fracture: 1 - crack formation 2 - crack propagation In ductile fracture, the crack grows at a slow pace and is accompanied with a great deal of plastic deformation due to the motion of dislocation. In this, the crack does not expand except when high levels of stress are present. Under the view of a microscope, the surfaces of materials with ductile fracture appear irregular and rough, and exhibit some dimpling Figure (11) Steps of fracture for ductile materials Figure (12) Dislocations motion in ductile materials
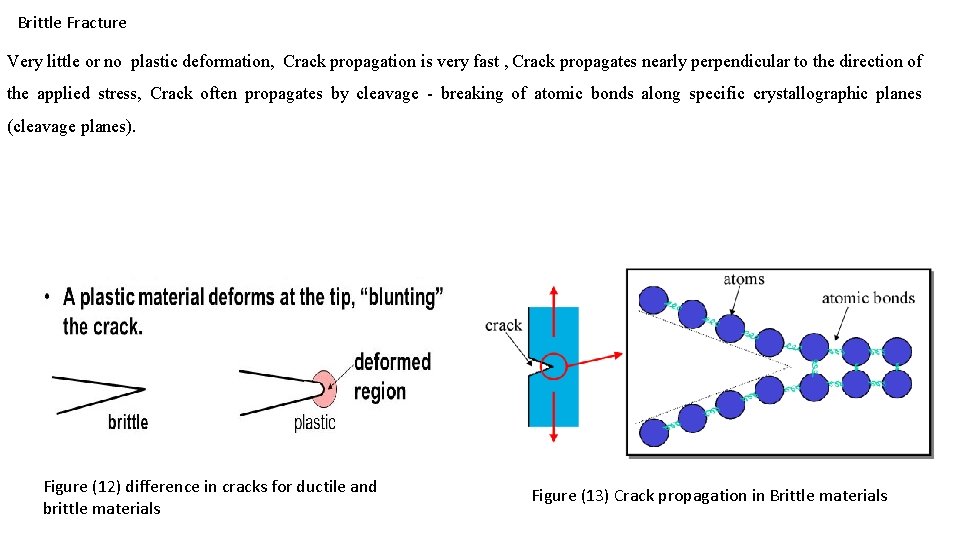
Brittle Fracture Very little or no plastic deformation, Crack propagation is very fast , Crack propagates nearly perpendicular to the direction of the applied stress, Crack often propagates by cleavage - breaking of atomic bonds along specific crystallographic planes (cleavage planes). Figure (12) difference in cracks for ductile and brittle materials Figure (13) Crack propagation in Brittle materials
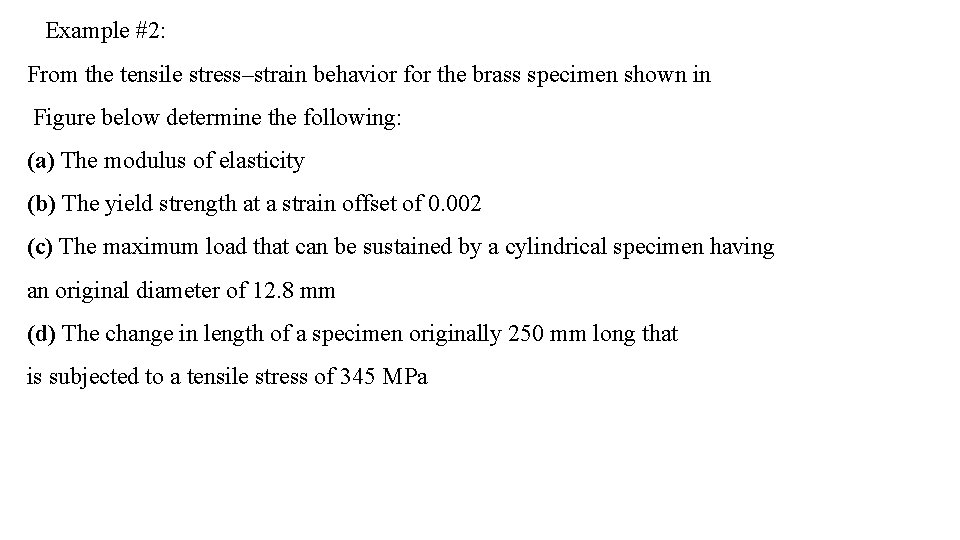
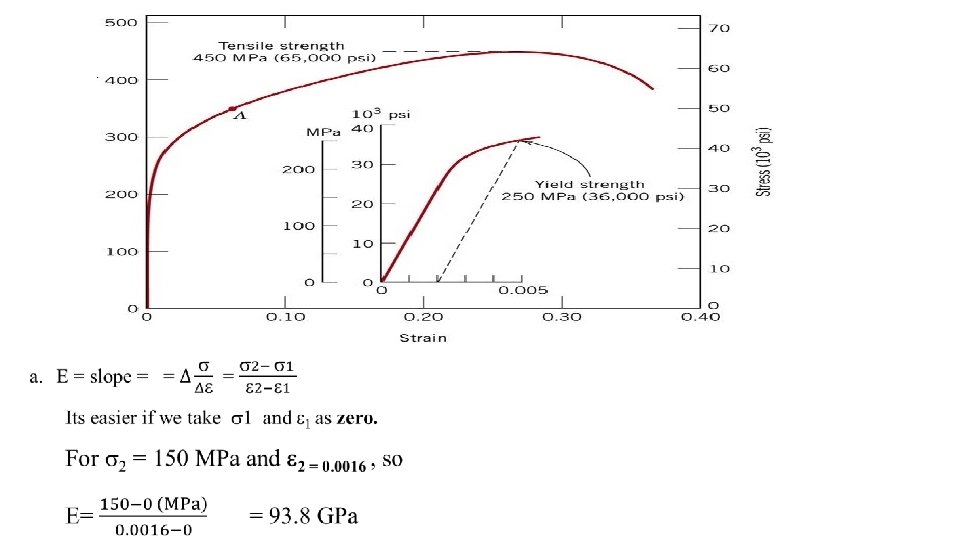
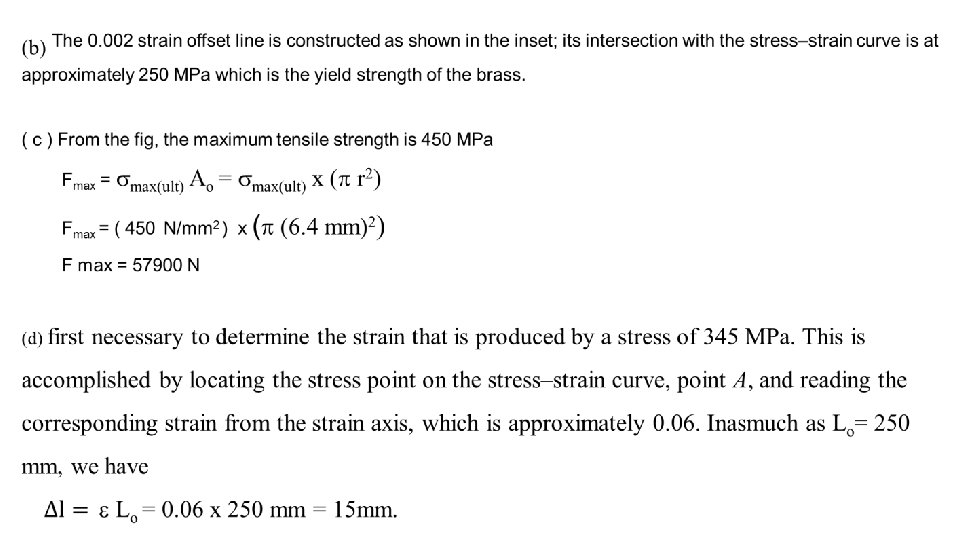
Example #2: From the tensile stress–strain behavior for the brass specimen shown in Figure below determine the following: (a) The modulus of elasticity (b) The yield strength at a strain offset of 0. 002 (c) The maximum load that can be sustained by a cylindrical specimen having an original diameter of 12. 8 mm (d) The change in length of a specimen originally 250 mm long that is subjected to a tensile stress of 345 MPa
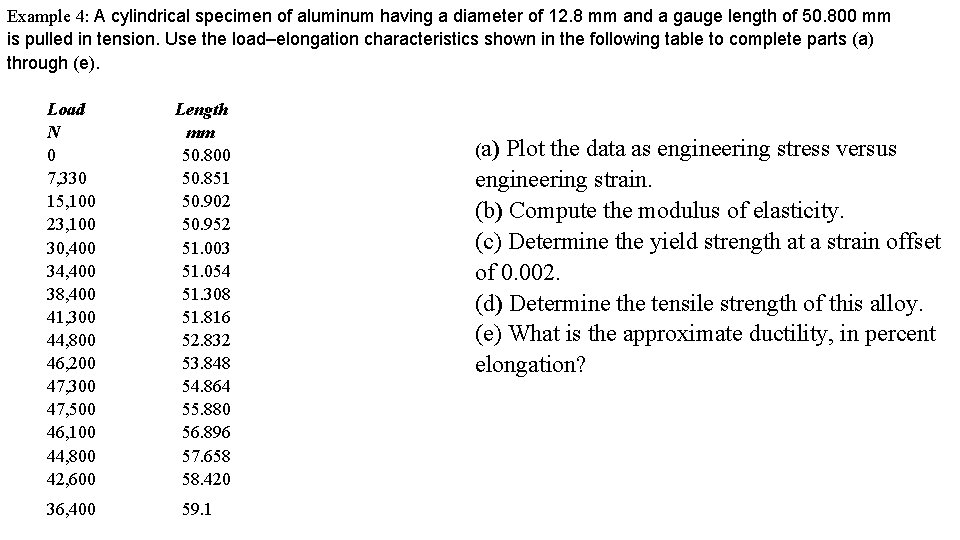
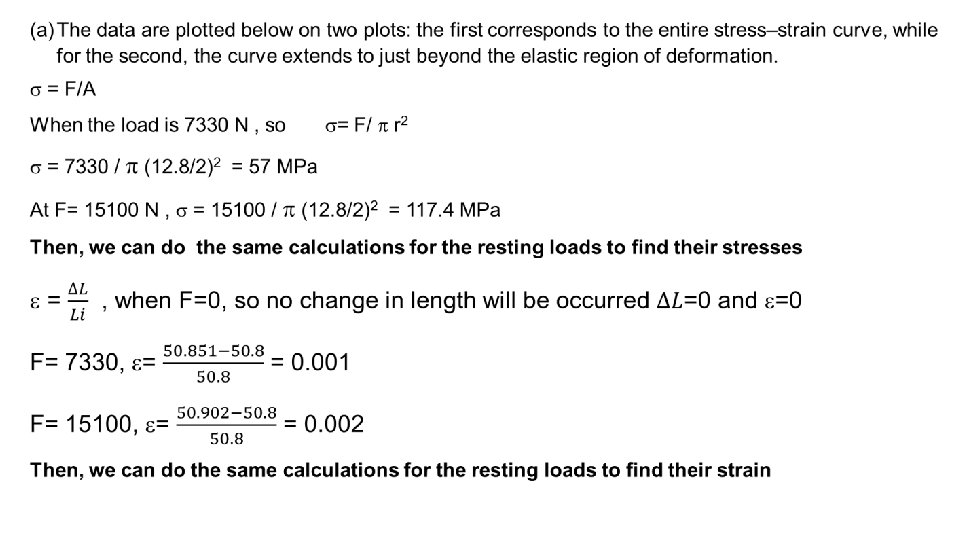
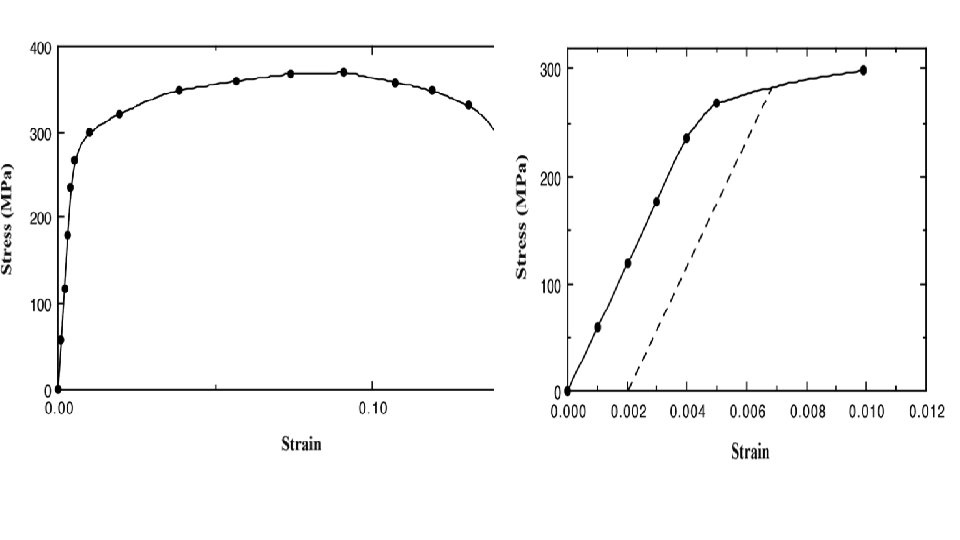
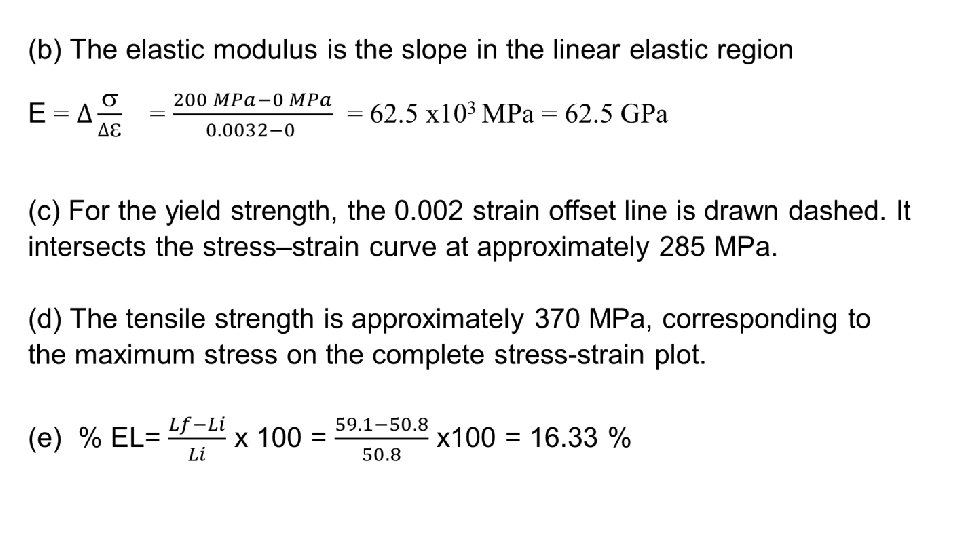
Example 4: A cylindrical specimen of aluminum having a diameter of 12. 8 mm and a gauge length of 50. 800 mm is pulled in tension. Use the load–elongation characteristics shown in the following table to complete parts (a) through (e). Load Length N mm (a) Plot the data as engineering stress versus 0 50. 800 7, 330 50. 851 engineering strain. 15, 100 50. 902 (b) Compute the modulus of elasticity. 23, 100 50. 952 (c) Determine the yield strength at a strain offset 30, 400 51. 003 34, 400 51. 054 of 0. 002. 38, 400 51. 308 (d) Determine the tensile strength of this alloy. 41, 300 51. 816 (e) What is the approximate ductility, in percent 44, 800 52. 832 46, 200 53. 848 elongation? 47, 300 54. 864 47, 500 55. 880 46, 100 56. 896 44, 800 57. 658 42, 600 58. 420 36, 400 59. 1
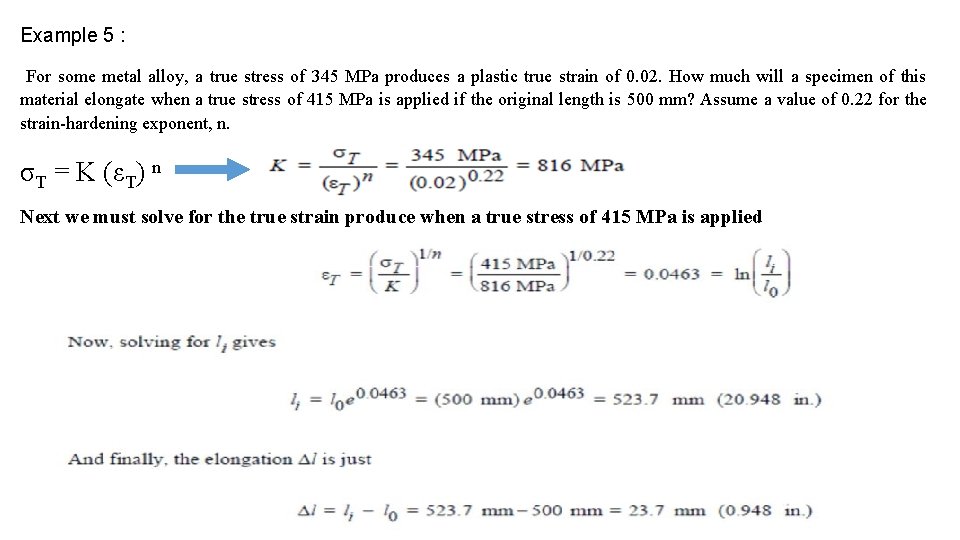
Example 5 : For some metal alloy, a true stress of 345 MPa produces a plastic true strain of 0. 02. How much will a specimen of this material elongate when a true stress of 415 MPa is applied if the original length is 500 mm? Assume a value of 0. 22 for the strain-hardening exponent, n. σT = K (εT) n Next we must solve for the true strain produce when a true stress of 415 MPa is applied