Introduction lecturers Harvard School of Public Health M


Introduction - lecturers • 盧瑞芬 – 現職: 長庚大學醫務管理學系教授 – 學歷: • 臺灣大學公共衛生學系學士 • Harvard School of Public Health – M. S. in Health Policy and Management – Sc. D. in Health Economics


Health Economics and Organization of the Health Care System
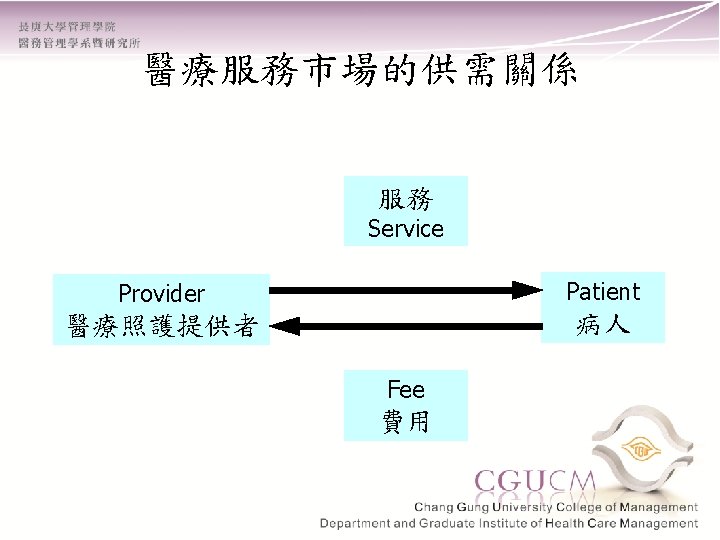
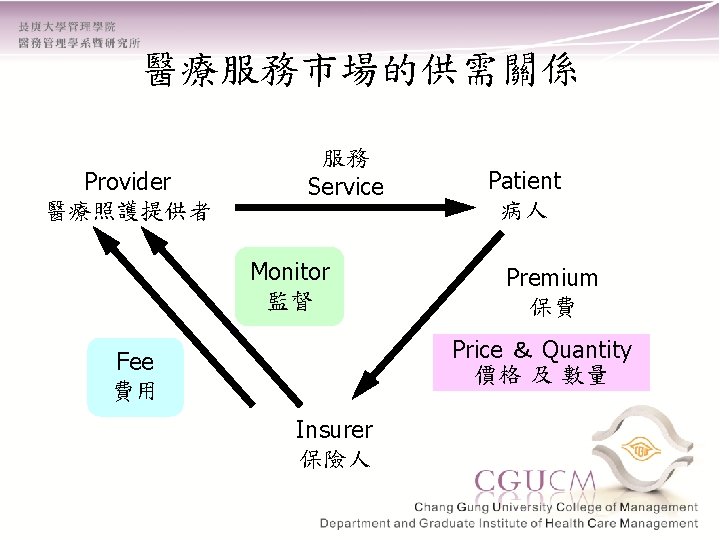

醫療服務市場的供需關係- HMO 服務 Service Prepaid Plans HMO Provider醫療提供者 + Insurer 保險人 Financing + Delivery Premiums 保費 Patients 病患
")
In dear memory of Uwe Reinhardt (1937. 9. 24– 2017. 11. 14)
 Practitioners")
In dear memory of Alan Maynard (1944. 12. 15 – 2018. 2. 2) Practitioners and policymakers have a moral obligation to do their research and ensure policy changes don't waste society's precious resources

 • “Uncertainty and")
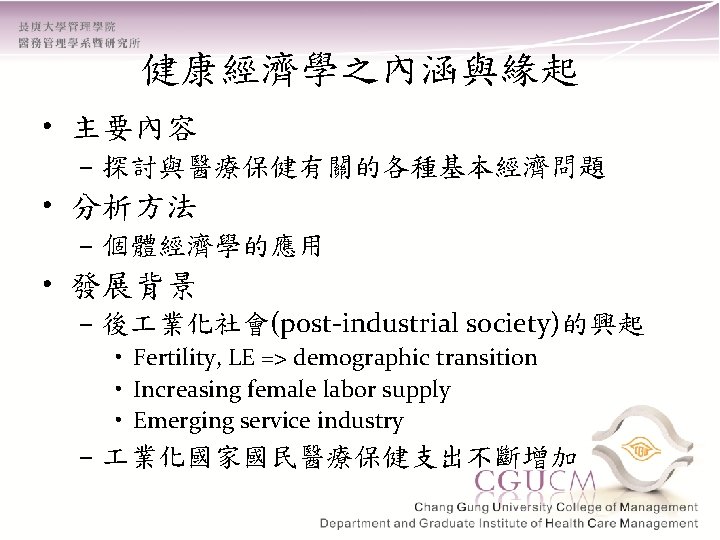
健康經濟學之緣起 • 理論奠基者: Kenneth Arrow 與 Gary Becker – Arrow (1963) • “Uncertainty and the welfare economics of medical care” • 不確定性是醫療保健服務市場的主要特性 – Becker (1960年代初期) • 人力資本(human capital) • 家庭生產函數(household production function)
 Gary Becker (1930 -2014) 1972 Nobel Memorial Prize in Economics")
Kenneth Arrow (1921 -2017) Gary Becker (1930 -2014) 1972 Nobel Memorial Prize in Economics 1992 Nobel Memorial Prize in Economics Jointly with Sir John R Hicks, Oxford University, UK “For having extended the domain of microeconomic analysis to a wide range of human behaviour and interaction, including nonmarket behaviour". “For their pioneering contributions to general economic equilibrium theory and welfare theory”.
 - Kenneth J. Arrow (1963) • Demand side – Uncertainty in the incidence")
不確定性(Uncertainty) - Kenneth J. Arrow (1963) • Demand side – Uncertainty in the incidence of disease(疾 病發生的不確定性) – Remedial approach • Health insurance
 - Kenneth J. Arrow (1963) • Supply side – Uncertainty in the efficacy")
不確定性(Uncertainty) - Kenneth J. Arrow (1963) • Supply side – Uncertainty in the efficacy of treatment(治 療效果的不確定性) – Remedial approach • Non-profit health care organization

A theory of the allocation of time - Gary Becker, 1965 • Household production function model of consumer behavior – commodities – market goods and services • Consumer produces commodities (-> utility function) with inputs of market goods/services and TIME
 Commodities = f (market goods/services, TIME) derived demand for a")
Utility = f (commodities) Commodities = f (market goods/services, TIME) derived demand for a factor of production

A tribute to Gary Becker - Michael Grossman • Household production function approach – Demand for medical care and other health inputs is derived from the basic demand for health • The theory of investment in human capital – Investment in knowledge raises wage rates – Investment in health raises total time available for market and hh production and prolong length of life

Grossman Demand Model - Human Capital Model • Health as a consumption commodity – Utility • Health as an investment commodity – Healthy time • Health as a durable capital stock that yields an output of healthy time • Individuals inherit an initial amount of this stock that depreciates with age and can be increased by investment
 1992 Nobel Memorial Prize in Economics “For having extended the")
Gary Becker (1930 -2014) 1992 Nobel Memorial Prize in Economics “For having extended the domain of microeconomic analysis to a wide range of human behaviour and interaction, including nonmarket behaviour". Victor Fuchs (1924 -) Michael Grossman (1942 -) Inaugural Recipient of Victor R. Fuchs Award for Lifetime Contributions to the Field of Health Economics, Presented by ASHE, 2008


 • 消費者無知(consumer ignorance) • 代理人(agent) – 醫師的執照制度 • 專業規範(professional norms)")
資訊的不對稱 (Information asymmetry) • 消費者無知(consumer ignorance) • 代理人(agent) – 醫師的執照制度 • 專業規範(professional norms)
 • 負的外部性(negative externality) – 傳染病的散播 – 二手菸與酒醉駕車 • 正的外部性(positive externality) – 社會關懷(social concern)")
外部性(Externality) • 負的外部性(negative externality) – 傳染病的散播 – 二手菸與酒醉駕車 • 正的外部性(positive externality) – 社會關懷(social concern) – 健康權(right to health)

Negative Externalities Social Cost P Private Cost D QS QP Q

Positive Externalities P S Social Benefit Private Benefit Q QP QS

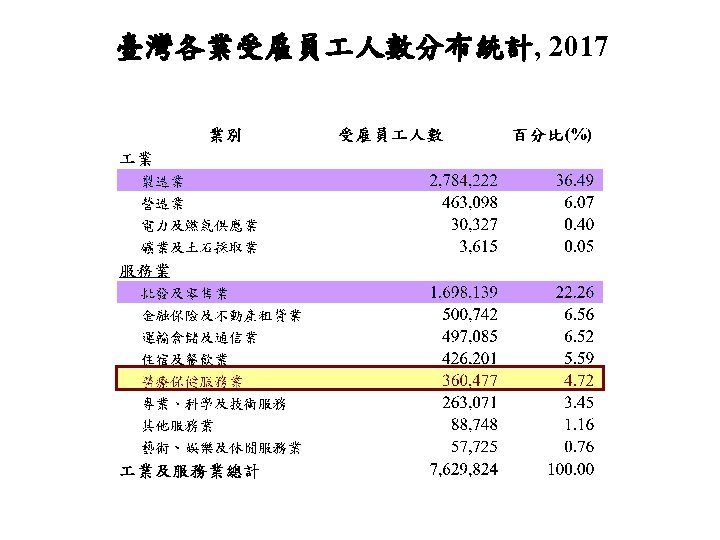
 平均每人醫療保 醫療保健支出佔 被保險人口佔總 健支出(元) GDP的比重(%) 人口比例(%) (百萬元)")
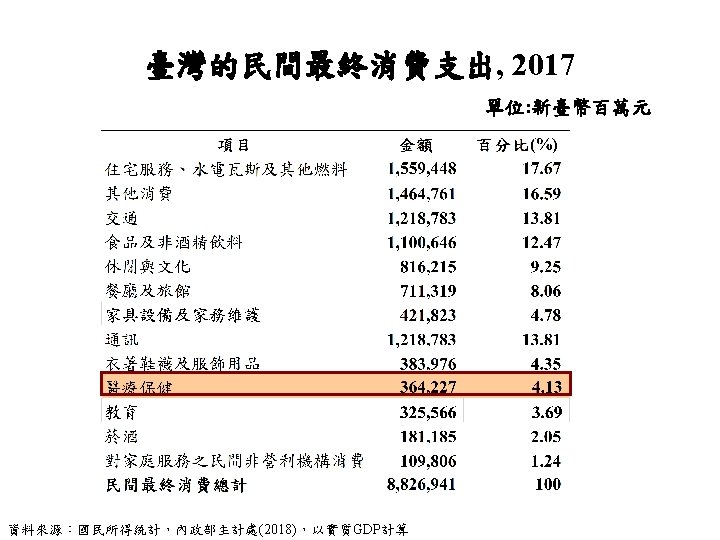
臺灣的醫療保健支出統計 , 1994 -2017 年份 總醫療保健支出 部門分配比重(%) 平均每人醫療保 醫療保健支出佔 被保險人口佔總 健支出(元) GDP的比重(%) 人口比例(%) (百萬元) 政府 保險 民間 2017 1, 127, 360 7. 69 53. 69 39. 62 47, 860 6. 44 99. 8 2016 1, 086, 886 6. 71 52. 80 40. 48 46, 219 6. 34 99. 7 2015 1, 029, 182 6. 92 52. 82 40. 26 43, 864 6. 14 99. 7 2014 995, 544 6. 83 52. 61 40. 56 42, 538 6. 19 99. 6 2013 962, 777 5. 78 52. 72 41. 5 43, 839 6. 61 99. 6 2012 930, 181 5. 88 52. 24 41. 89 39, 973 6. 62 99. 6 2011 906, 246 6. 12 51. 16 42. 72 39, 073 6. 63 99. 5 2010 885. 045 6. 09 50. 55 42. 76 38, 246 6. 53 99. 5 2009 862, 552 6. 33 51. 12 42. 55 37, 375 6. 91 99. 4 2008 819, 416 5. 74 51. 51 42. 75 35, 630 6. 49 99. 3 2007 796, 540 6. 66 51. 14 42. 21 34, 757 6. 17 99. 32 2006 767, 432 6. 73 50. 6 42. 67 33, 625 6. 27 98. 29 2005 735, 502 6. 22 50. 8 42. 98 32, 359 6. 26 98 2004 705, 353 7. 59 51. 33 41. 08 31, 146 6. 21 97. 55 2003 657, 796 8 52. 19 39. 82 29, 154 6. 15 97. 26 2002 620, 674 7. 12 53. 26 39. 61 27, 631 5. 96 97. 11 2001 583, 775 8. 24 53. 07 38. 69 26, 130 5. 88 96. 64 2000 563, 124 7. 63 52. 39 39. 99 25, 384 5. 53 96. 07 1999 540, 108 7. 8 53. 66 38. 54 24, 539 5. 6 95. 46 1998 499, 471 8. 17 53. 58 38. 25 22, 874 5. 43 94. 66 1997 458, 764 9. 01 53 38 21, 206 5. 35 94. 25 1996 423, 626 10. 42 53. 92 35. 66 19, 757 5. 36 93. 1 1995 382, 195 12. 22 50. 72 37. 06 17, 971 5. 25 89. 54 1994 325, 738 14. 86 39. 78 45. 36 15, 448 4. 87 57. 48 資料來源:中華民國衛生統計,106年醫療保健支出統計表,行政院衛生福利部,2019
 • 粗死亡率(crude mortality rate) • 嬰兒死亡率(infant mortality rate)")
臺灣的總體健康指標 • 國民平均餘命(life expectancy) • 粗死亡率(crude mortality rate) • 嬰兒死亡率(infant mortality rate)
 粗死亡率(‰) 嬰兒死亡率(‰) 80. 4 7. 3 4. 0 83. 42 80.")
臺灣的總體健康指標 年份 平均餘命(歲) 粗死亡率(‰) 嬰兒死亡率(‰) 80. 4 7. 3 4. 0 83. 42 80. 0 7. 33 3. 9 77. 0 83. 6 80. 2 6. 98 4. 1 2014 76. 7 83. 2 79. 8 7. 0 3. 6 2013 76. 91 83. 36 80. 02 6. 68 3. 93 2012 76. 43 82. 82 79. 51 6. 63 3. 67 2011 76. 00 82. 70 79. 15 6. 55 4. 20 2010 76. 20 82. 70 79. 18 6. 25 4. 20 2009 76. 00 82. 30 79. 01 6. 16 4. 07 2008 75. 49 82. 01 78. 57 6. 18 4. 51 2007 75. 09 81. 90 78. 38 6. 08 4. 69 2006 74. 86 81. 41 77. 90 5. 92 4. 61 2005 73. 72 79. 79 77. 42 6. 13 4. 97 2002 73. 03 78. 82 77. 19 5. 73 5. 35 2001 72. 87 78. 75 76. 75 5. 71 5. 99 2000 72. 67 78. 44 76. 46 5. 68 5. 86 1998 72. 20 77. 96 75. 76 5. 64 6. 57 1997 71. 93 77. 81 75. 54 5. 59 6. 35 1995 71. 85 77. 74 74. 53 5. 60 6. 43 男 女 計 2017 77. 3 83. 7 2016 76. 81 2015 資料來源:衛生福利部、內政部, 2017

Health status indicators and national health expenditures in selected countries, 2017 countries life expectancy infant mortality at birth (years) rate (death/1000 (female/male) live births) current exp. on health per capita (PPP int. $) current exp. on health as a percentage of GDP Taiwan 80. 4 3. 9** 3, 047 6. 1 Canada 81. 9 4. 5* 4, 826 10. 4 Germany 80. 8 3. 4** 5, 728 11. 3 Japan 85. 3 2. 0** 4, 717 10. 7 Korea 82. 5 2. 8** 2, 897 7. 6 Netherland 81. 4 3. 5** 3, 683 10. 1 U. K. 80. 8 3. 9** 4, 246 9. 6 U. S. A 80. 0 5. 9** 10, 209 17. 2 France 81. 9 3. 7** 4, 902 11. 5 Note: *2015 data , **2016 data Sources: Taiwan: National Health Expenditure, Ministry of Health and Welfare, Taiwan, 2018; Department of Statistics, Ministry of the Interior, R. O. C. , 2018 OECD Countries: OECD Health Statistics, 2018, IMF.


效率及公平性 Efficiency and Equity • Efficiency – available resources to produce maximum benefit • Equity – fairness of the benefit distribution

 Utility = U(H, X) H = g(m, z) 引申需求(derived")
個體經濟學 • • 資本存量(Grossman, 1972) Utility = U(H, X) H = g(m, z) 引申需求(derived demand)


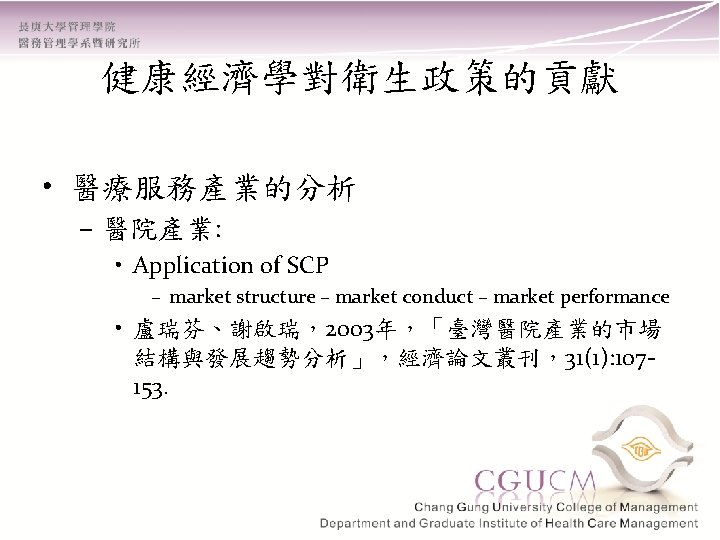
健康經濟學對衛生政策的貢獻 • 醫療支出總額的決定與醫療支出快速上漲 的問題 – Factors contribute to the health expenditure growth: the adoption of high technology • Newhouse JP, 1992, “Medical Care Costs:How Much Welfare Loss? ”, Journal of Economic Perspectives, 6(3): 3 -21.

Factors that Explain Health Expenditure Growth • Demand side – Aging – Increased insurance – Increased income

Factors that Explain Health Expenditure Growth • Supply side – Supplier-induced demand – Factor productivity in a service industry • Relative price increases, as price elasticity for medical care < 1, health exp will increase

Factors that Explain Health Expenditure Growth • Residual – All the above factors can only explain 25% to 50% of the exp growth from 1950 to 1987 – What has really happened?

Factors that Explain Health Expenditure Growth Technological change

健康經濟學對衛生政策的貢獻 • 醫療支出總額的決定與醫療支出快速上漲 的問題 – Expenditure growth rate: Taiwan NHI • Lu JR, Hsiao WC, 2003, “Does Universal Health Insurance Make Health Care Unaffordable? Lessons from Taiwan”, Health Affairs, 22(3): 77 -88.
 Line represents the historical")
Graph B: Residuals for Total Health Expenditure/Person (in real terms) Line represents the historical average of the residual for total health expenditure/person Source: The residual was computed based on Taiwan’s national health expenditures estimated by the authors. The detailed computation process is presented in Appendix A.
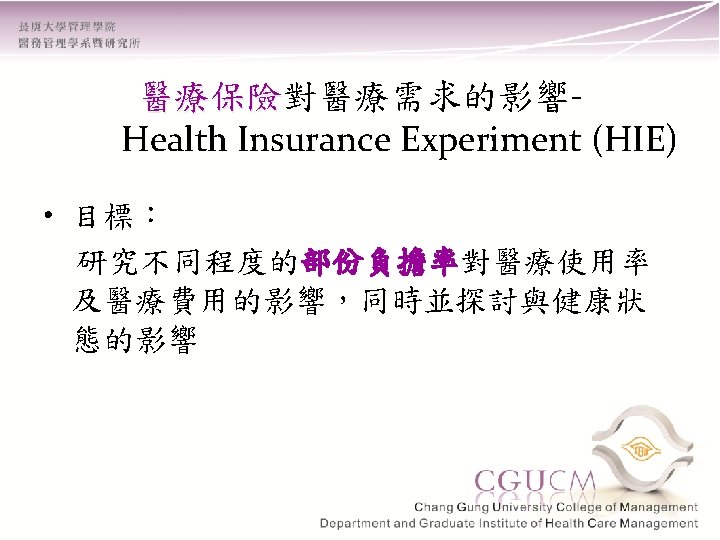
 • mid 1970 to early 1980 • RAND Corporation")
醫療保險對醫療需求的影響醫療保險 Health Insurance Experiment (HIE) • mid 1970 to early 1980 • RAND Corporation – led by Newhouse, Manning, Phelps • 6 sites experimental study
 • Randomly assign enrollees into 14 different fee-for-service (FFS)")
醫療保險對醫療需求的影響醫療保險 Health Insurance Experiment (HIE) • Randomly assign enrollees into 14 different fee-for-service (FFS) plans and Health Maintenance Organization (HMO) • FFS plans differ in coinsurance rate and amount of stop-loss
 • plans : – Free care – 25% ,")
醫療保險對醫療需求的影響醫療保險 Health Insurance Experiment (HIE) • plans : – Free care – 25% , 50% , 95% coinsurance – Individual deductible – Group Health Exp (HMO) – Group Health Control
 visit / physician (2 times) Free care 95% 4.")
醫療保險對醫療需求的影響醫療保險 Health Insurance Experiment (HIE) visit / physician (2 times) Free care 95% 4. 55 2. 73 inpatient adm (25%↑) 0. 128 0. 099 total exp (50%↑) 750 504

Table 5 -4. Differences between Plans in Predicted Total Expenditures per Person and in the Probability of One or More Physician Visits or Hospital Admissions (All Participants)
 • Effect on use : FFS – As coinsurance")
醫療保險對醫療需求的影響醫療保險 Health Insurance Experiment (HIE) • Effect on use : FFS – As coinsurance utilization • Effect on Health : FFS – In most of the cases no effect • Effect on use : HMO – OPD similar – less hosp adm in HMO than free care • Effect on health : HMO
Findings • Negative price elasticity for medical care. (-0. 17 ~")
Health Insurance Experiment (HIE)Findings • Negative price elasticity for medical care. (-0. 17 ~ -0. 22) • Copayment design mitigates expenditure growth. • OPD services and inpatient services are complements but not substitutes.
對健康 的影響 – 個人健康行為的重要性 • Fuchs, VR, 1996, \"Economics, Values, and")
健康經濟學對衛生政策的貢獻 • 強調非醫療因素(nonmedical factor)對健康 的影響 – 個人健康行為的重要性 • Fuchs, VR, 1996, "Economics, Values, and Health Care Reform, " American Economic Review, 86(1): 124. – 成癮性物品(addictive goods)需求受價格變動影 響之程度

“The Theory of Economics does not furnish a body of settled conclusion immediately applicable to policy. It is a method rather than a doctrine, an apparatus of the mind, a technique of thinking which helps its possessor to draw correct conclusions. ” John Maynard Keynes
- Slides: 80