
Introduction Indonesia Population 267 Million 4 th most
- Slides: 23
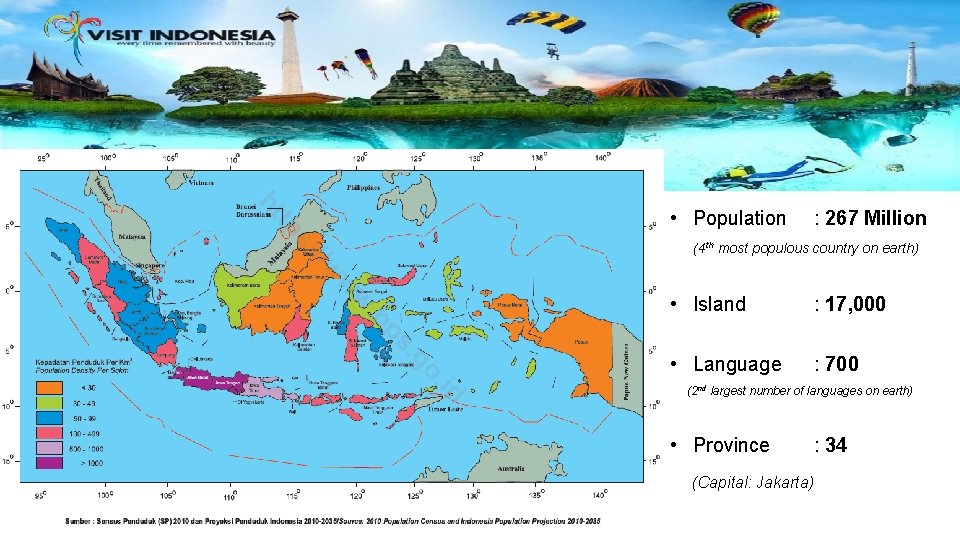
Introduction Indonesia: • Population : 267 Million (4 th most populous country on earth) • Island : 17, 000 • Language : 700 (2 nd largest number of languages on earth) • Province (Capital: Jakarta) : 34
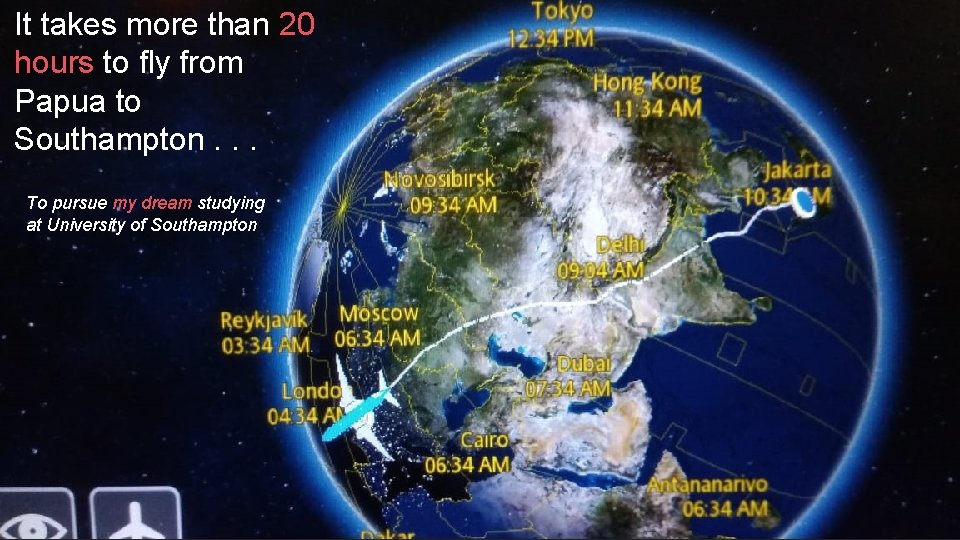
It takes more than 20 hours to fly from Papua to Southampton. . . To pursue my dream studying at University of Southampton
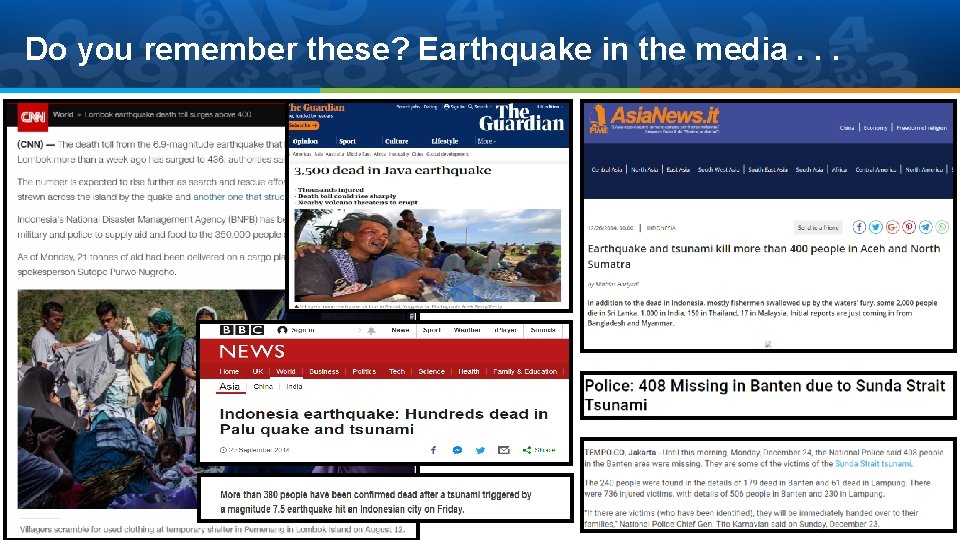
Do you remember these? Earthquake in the media. . .
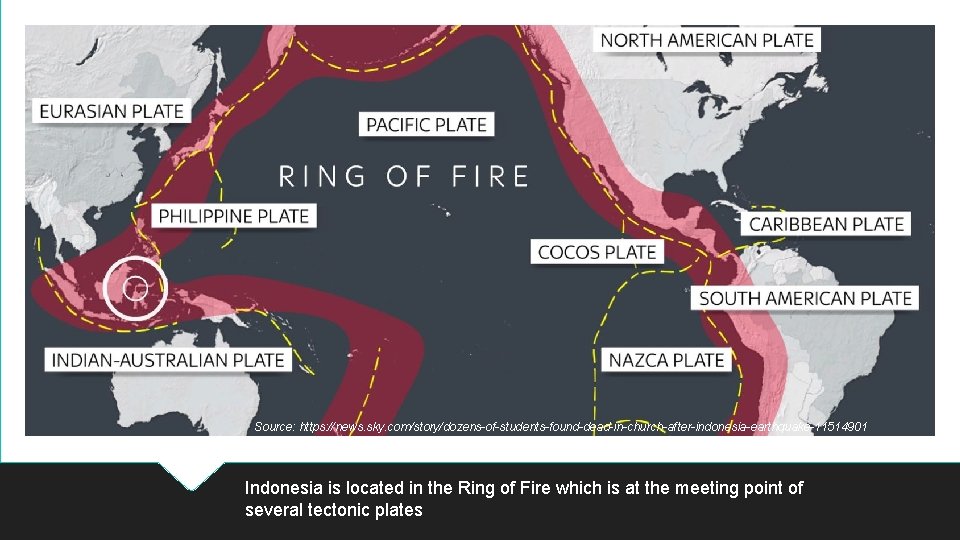
Source: https: //news. sky. com/story/dozens-of-students-found-dead-in-church-after-indonesia-earthquake-11514901 Indonesia is located in the Ring of Fire which is at the meeting point of several tectonic plates
Using Exploratory Data Analysis method for an early warning in Indonesia’s earthquakes disaster. Presented by Yuliagnis Transver Wijaya MDATAGOV Symposium Manchester, 27 th March 2019 Master Candidate of Data Analytics for Government Statistics Indonesia
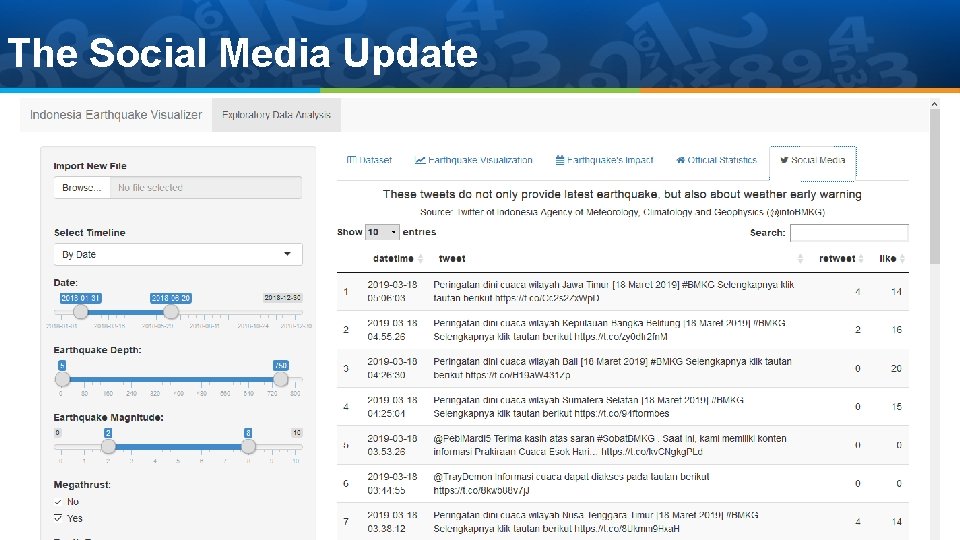
The Main Objective 1. To construct a centralized repository of data on earthquakes, their impact, and the characteristics of the population, as well as an interactive visualisation tool. 2. In the case of a new event, to publish real time information obtained scraping data from Twitter accounts of organisations such as the Meteorology, Climatology and Geophysics Agency and the National Disaster Management Agency. Automatically retweet the relevant information as an early warning for the general public.
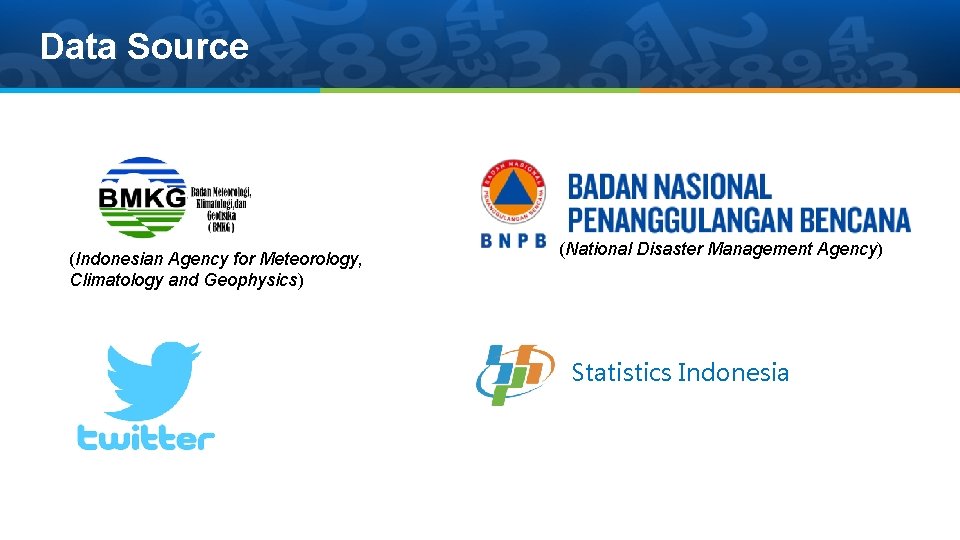
Data Source (Indonesian Agency for Meteorology, Climatology and Geophysics) (National Disaster Management Agency) Statistics Indonesia
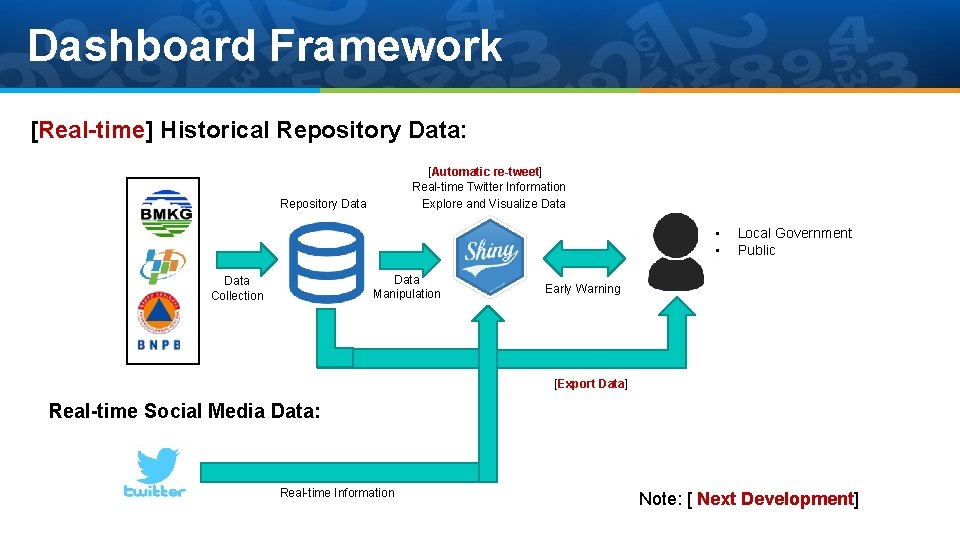
Dashboard Framework [Real-time] Historical Repository Data: [Automatic re-tweet] Real-time Twitter Information Explore and Visualize Data Repository Data • • Data Manipulation Data Collection Local Government Public Early Warning [Export Data] Real-time Social Media Data: Real-time Information Note: [ Next Development]
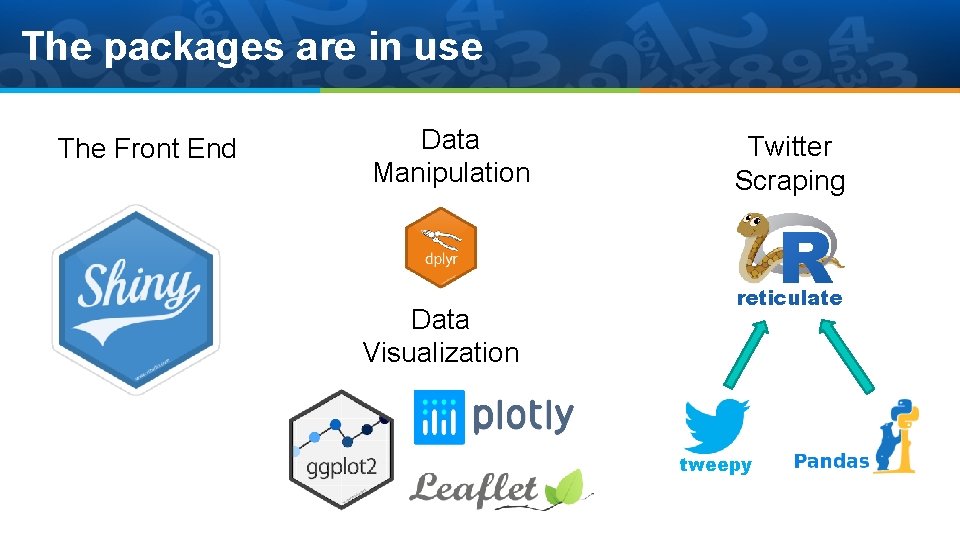
The packages are in use The Front End Data Manipulation Data Visualization Twitter Scraping reticulate tweepy
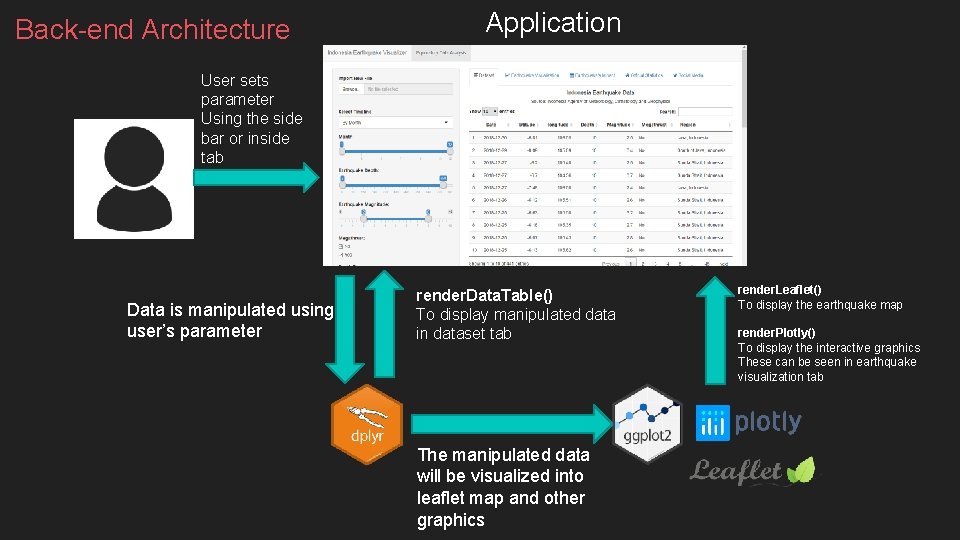
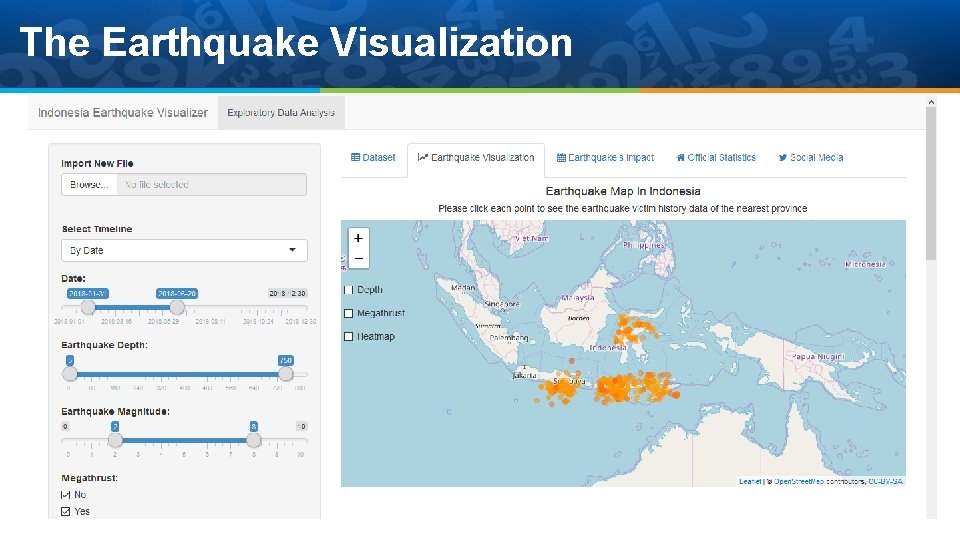
Back-end Architecture Application User sets parameter Using the side bar or inside tab Data is manipulated using user’s parameter render. Data. Table() To display manipulated data in dataset tab The manipulated data will be visualized into leaflet map and other graphics render. Leaflet() To display the earthquake map render. Plotly() To display the interactive graphics These can be seen in earthquake visualization tab
DEMO PLATFORM
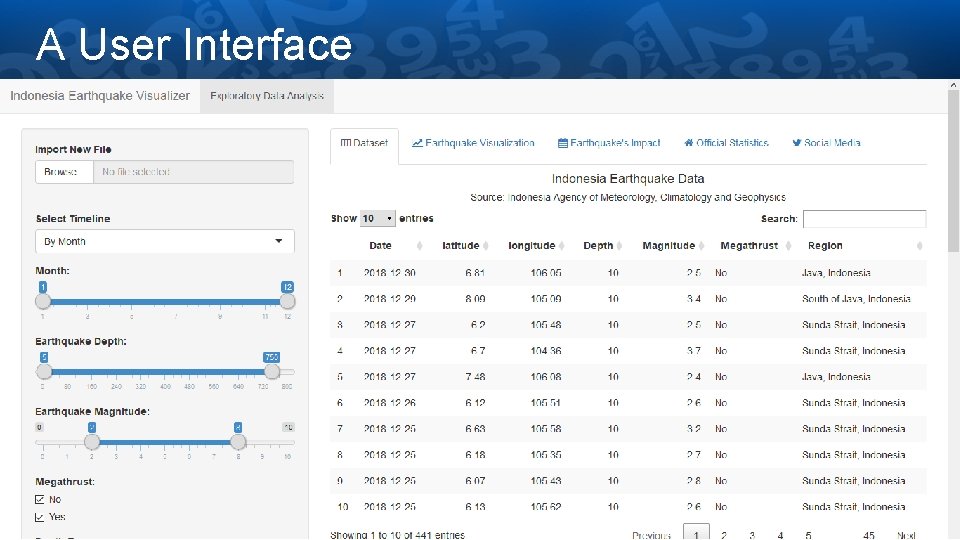
A User Interface
The Earthquake Visualization
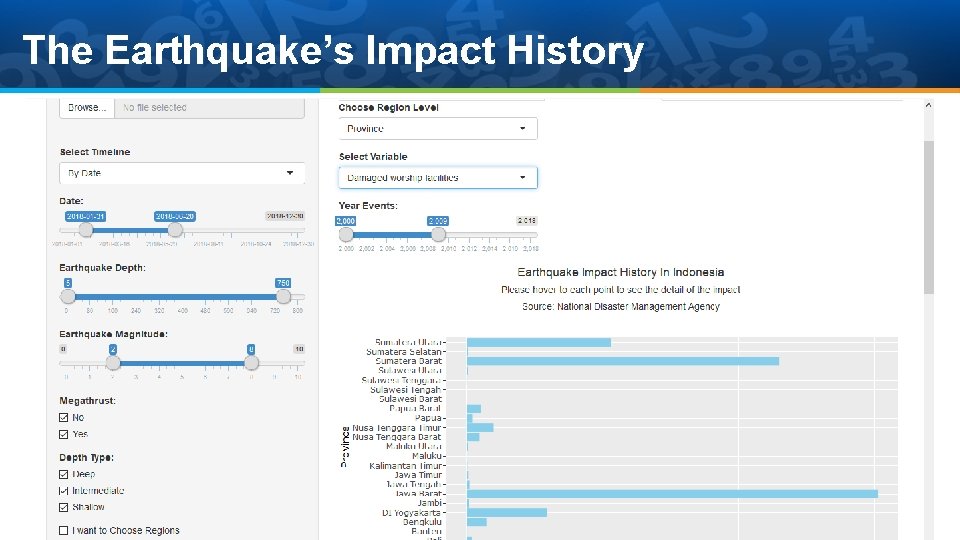
The Earthquake’s Impact History
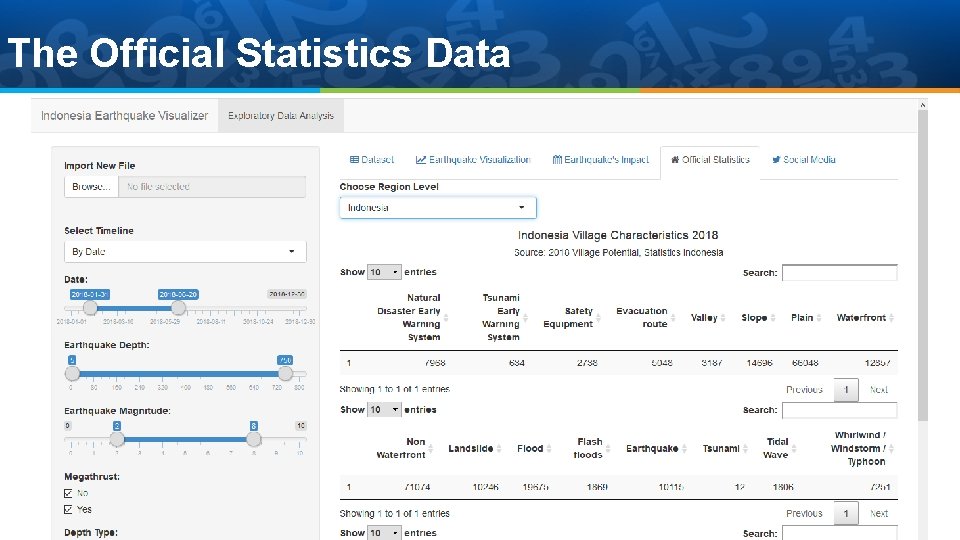
The Official Statistics Data
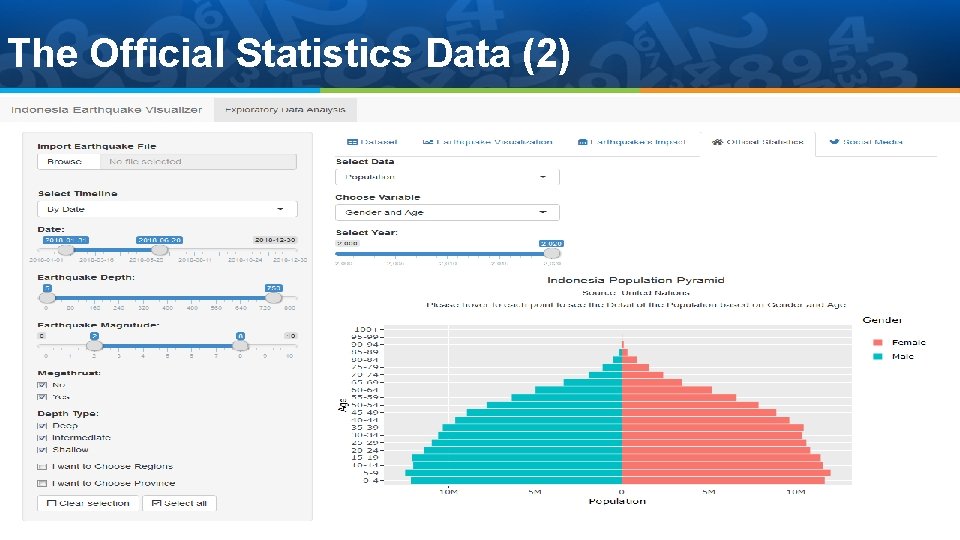
The Official Statistics Data (2)
The Social Media Update
What’s Next? Using real-time earthquake data from Indonesia Agency of Meteorology, Climatology and Geophysics: Scraping the website and to gather the data. Implementing Automatic retweet to National Disaster Management Agency in Indonesia with keyword “#gempa bumi”, ”#earthquake”, etc. to response the warning from Meteorology, Climatology and Geophysics agency Using other supporting data, such as News media channel for monitoring the progress of disaster management.
Conclusion I hope this dashboard can be used to save people’s life and minimize the future damages
Thank You
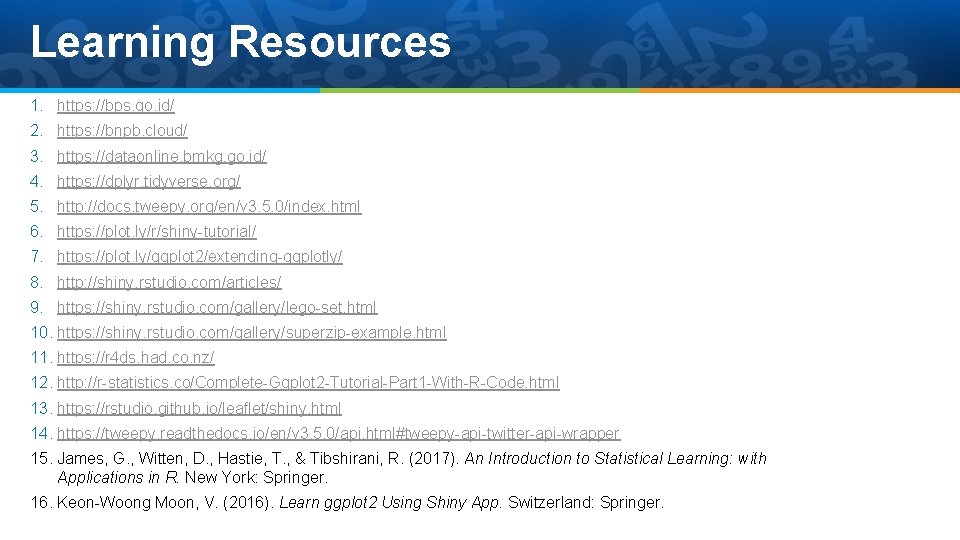
Learning Resources 1. https: //bps. go. id/ 2. https: //bnpb. cloud/ 3. https: //dataonline. bmkg. go. id/ 4. https: //dplyr. tidyverse. org/ 5. http: //docs. tweepy. org/en/v 3. 5. 0/index. html 6. https: //plot. ly/r/shiny-tutorial/ 7. https: //plot. ly/ggplot 2/extending-ggplotly/ 8. http: //shiny. rstudio. com/articles/ 9. https: //shiny. rstudio. com/gallery/lego-set. html 10. https: //shiny. rstudio. com/gallery/superzip-example. html 11. https: //r 4 ds. had. co. nz/ 12. http: //r-statistics. co/Complete-Ggplot 2 -Tutorial-Part 1 -With-R-Code. html 13. https: //rstudio. github. io/leaflet/shiny. html 14. https: //tweepy. readthedocs. io/en/v 3. 5. 0/api. html#tweepy-api-twitter-api-wrapper 15. James, G. , Witten, D. , Hastie, T. , & Tibshirani, R. (2017). An Introduction to Statistical Learning: with Applications in R. New York: Springer. 16. Keon-Woong Moon, V. (2016). Learn ggplot 2 Using Shiny App. Switzerland: Springer.
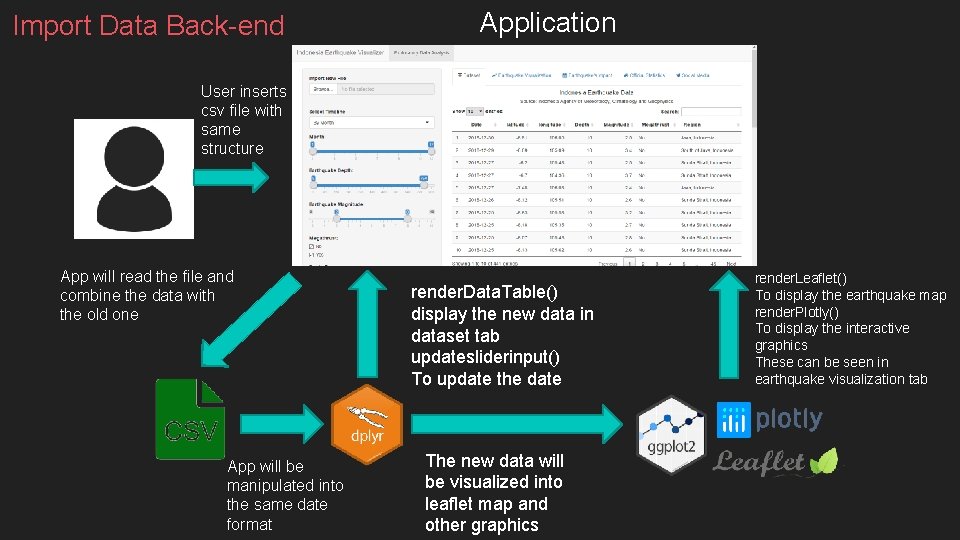
Import Data Back-end Application User inserts csv file with same structure App will read the file and combine the data with the old one App will be manipulated into the same date format render. Data. Table() display the new data in dataset tab updatesliderinput() To update the date The new data will be visualized into leaflet map and other graphics render. Leaflet() To display the earthquake map render. Plotly() To display the interactive graphics These can be seen in earthquake visualization tab
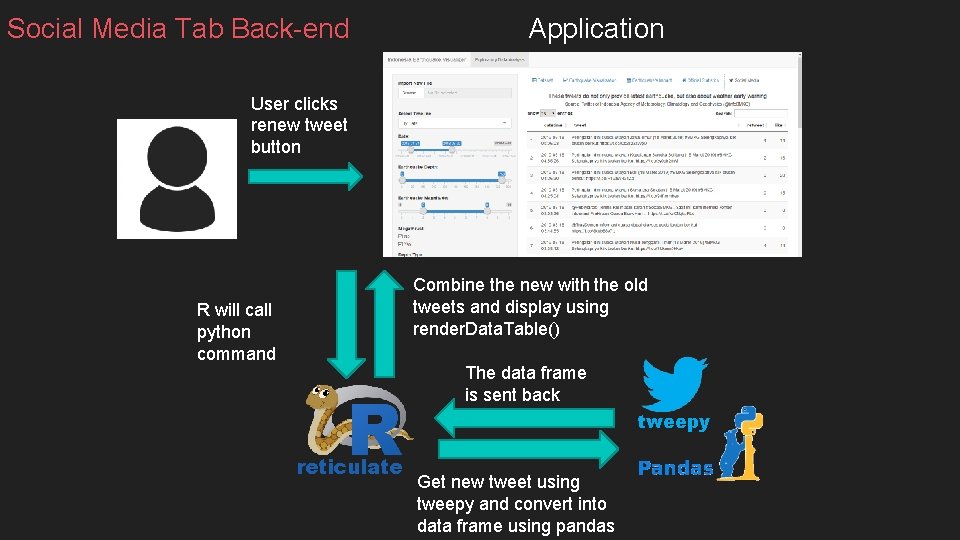
Social Media Tab Back-end Application User clicks renew tweet button Combine the new with the old tweets and display using render. Data. Table() R will call python command The data frame is sent back into R reticulate Get new tweet using tweepy and convert into data frame using pandas tweepy