Introduction Evaluating the significance of major life events


 • Panel data from 1992 to 2008,")


- Slides: 18
Introduction • Evaluating the significance of major life events is important • Subjective happiness reports are one tool • Existing research has used subjective reports but has not generally taken dynamic responses into account • Our work utilizes Health and Retirement Study (HRS) panel data to get a more complete picture of life events 1
Happiness Index • We define our happiness index using the Center for Epidemiologic Studies Depression Scale (CESD) questions in the HRS. • “…Tell me how often you have experienced the following feelings during the past week -- all or almost all of the time, most of the time, some of the time, or none or almost none of the time: (1) I felt depressed. (2) I was happy. (3) I enjoyed life. (4) I felt sad. ” • Coding: for 1992 wave: Score = (depressed: none, or almost none of the time = 1) + (happy: all, most, or some of the time = 1) + (enjoyed life: all, most, or some of the time = 1) + (sad: none, or almost none of the time = 1) for 1993 -2004: Score = (depressed: not much of the time = 1) + (happy: much of the time = 1) + (enjoyed life: much of the time = 1) + (sad: not much of the time = 1) Happiness Index = Score x 25 --> range from 0 (not happy) to 100 (happiest).
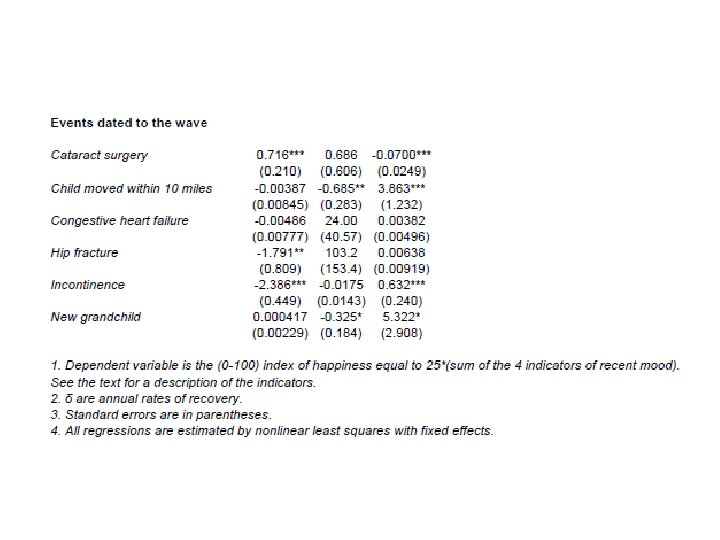
Many Life-Events • There are many important life-events available in the HRS to study, among them: Health events • heart attacks, stroke, cancer, cataract surgery, incontinence, congestive heart failure, hip fracture Death: death of kid (have month & year only through 2000), death of spouse (month & year for all waves) Employment: unemployment (month & year), retirement (month & year)
Data • Health and Retirement Study (HRS) • Panel data from 1992 to 2008, with biennial interviews. • Number of individuals in couples in 1992 (or 1993 AHEAD): 894 (out of 1, 154 possible = 77%). • Number of widows or widowers: 785 • Average happiness index: 80 • Average happiness index for widows or widowers: 79. 7
Widowhood • There are 785 widows or widowers in our HRS sample. • Average happiness index: 79. 7 • Average happiness index for men: 83. 3 (200 men) • Average happiness index for women: 78. 6 (585 women) • with life insurance: 81. 1 (285 individuals) • without life insurance: 76. 0 (138 individuals) note: only 423 answered life insurance question.
Estimation • Variants of the following equation are estimated via nonlinear least squares, where H is the happiness measure, Y is log income, BP and BT are the permanent and temporary effects, respectively, and delta is the rate at which the temporary effect decays
Parametric and non-parametric results for Widowing, with and w/o life insurance 7
Parametric and non-parametric results, Heart Attacks
Parametric and non-parametric results, Strokes
Parametric and non-parametric results, Cancer
Parametric and non-parametric results, Unemployment
Parametric and non-parametric results, Nursing Home Entry
13
14
15
16
17