Introduction Environmental Problems Causes and Sustainability Why study

Introduction Environmental Problems, Causes, and Sustainability

Why study Environmental Science? • Interdisciplinary course • how the earth works • Ecology (big part) • living organisms and their environment • humans & environmental problems • Ecology – “household/house” • Household = all aspects of environmental science What is an Environmentally Sustainable Society? • Maintain the balance of ecosystems for future generations. • Be responsible when using resources • Take only what we need

Everything is interconnected

Three Principles of Sustainability Chemical Cycling Solar Energy Biodiversity Fig. 1 -3, p. 8

• • Air Pollution Global climate change Stratospheric ozone depletion Urban air pollution Acid deposition Outdoor pollutants Indoor pollutants Noise • • Water Pollution Sediment Nutrient overload Toxic chemicals Infectious agents Oxygen depletion Pesticides Oil spills Excess heat Biodiversity Depletion • Habitat destruction • Habitat degradation • Extinction Major Environmental Problems Waste Production • Solid waste • Hazardous waste Food Supply Problems • Overgrazing • Farmland loss and degradation • Wetlands loss and degradation • Overfishing • Coastal pollution • Soil erosion • Soil salinization • Soil waterlogging • Water shortages • Groundwater depletion • Loss of biodiversity • Poor nutrition
Population Growth 2) Wasteful resource use 3)Poverty 4)Global Climate Change")
6 Important Environmental issues 1)Population Growth 2) Wasteful resource use 3)Poverty 4)Global Climate Change 5)Pollution 6)Extinction of Plants & Animals
Would you rather stop poverty or stop pollution? (Discuss #")
WOULD YOU RATHER ? 1)Would you rather stop poverty or stop pollution? (Discuss # 3 & #5) 2)Would you rather enforce a vegan diet on everyone or limit the amount of children the world can have? (Discuss #1 & # 2) 3)Would you rather have a job paying $25, 000 helping the environment or $150, 000 dumping toxic waste into ocean (Discuss # 5 & #6) 4)Would you rather use coal for energy or sun for energy? (Discuss #2 & #4) 5)Would you rather live in a big city or the country? (Discuss # 1 & #3) 6)Would you rather swim in water near a nuclear power plant or swim in water near a sewage treatment plant? (Discuss #5 & #6)
 Population growth")
1) Population growth
 Wasteful resource use")
2) Wasteful resource use
Perpetual resourcesolar energy 2)Renewable resource • Ex-forests, animals, fresh air and water 3)Nonrenewable")
Resources 1)Perpetual resourcesolar energy 2)Renewable resource • Ex-forests, animals, fresh air and water 3)Nonrenewable resource • Ex-energy resources, metals, nonmetals
 Poverty")
3) Poverty
 Global climate change")
4) Global climate change
 Pollution Point vs Nonpoint Human activity. ANTHROPOGENIC Natural (volcanic eruptions)")
5) Pollution Point vs Nonpoint Human activity. ANTHROPOGENIC Natural (volcanic eruptions)

Point-Source Air Pollution Fig. 1 -8, p. 11

Nonpoint Source Water Pollution Fig. 1 -9, p. 11
 Extinction of plants and animals ( biodiversity crisis)")
6) Extinction of plants and animals ( biodiversity crisis)
")
Environmentalists use a simple model • P x A x T =Environmental Impact (I) • • • Environmental impact(I) Number of people(P) Average resource use person (Affluence A) Beneficial and Harmful environmental effects of technologies (T)
 Consumption X person (affluence, A) Technological Environmental impact of")
IPAT Less-Developed Countries Population (P) Consumption X person (affluence, A) Technological Environmental impact of X impact per unit of = consumption (T) population (I) More-Developed Countries Fig. 1 -14, p. 17

• • • 1 American = 3 Japanese 6 Mexicans 12 Chinese 33 Indians (i. e. from India) • 147 Bangladeshis • 281 Tanzanians • 422 Ethiopians Environmental Impact

Population Growth • • biggest strain on environment Exponential growth J shaped curve Human Population 1 %/year. 6. 3 Billion in 2003 Today? 7. 24 Billion in 2015 7. 32 Billion in 2016 http: //www. census. gov/population/intern ational/data/idb/worldpoptotal. php World Population, Population Growth Rates and People Added per year http: //www. census. gov/popclock/ Clock with population increases http: //www. worldometers. info/worldpopulation/ World Population Clock & 20 countries with largest
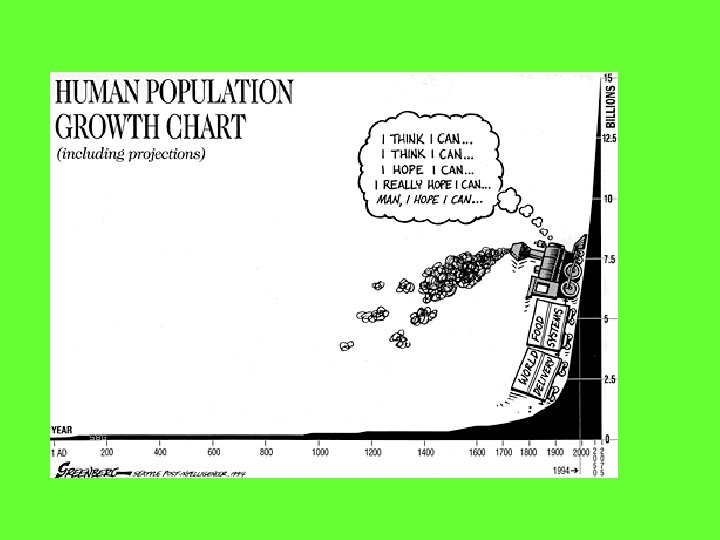

Exponential Growth of Human Population Billions of people ? Industrial revolution Black Death—the Plague Time Hunting and gathering Agricultural revolution Industrial revolution Fig. 1 -16, p. 17
")
World Population Reached 1 billion in 1804 2 billion in 1927 (123 years later) 3 billion in 1960 (33 years later) 4 billion in 1974 (14 years later) 5 billion in 1987 (13 years later) 6 billion in 1999 (12 years later) World Population May Reach 7 billion in 2013 (14 years later) 8 billion in 2028 (15 years later) 9 billion in 2050 (22 years later)
 10 World total 9 8 Developing countries 7 6 5")
12 11 Population (billions) 10 World total 9 8 Developing countries 7 6 5 4 3 Developed countries 2 1 2000 2050 1950 Year 2100

How does Economy relate to Environment? • Uses resources • World economy – emits fossil fuels • Cannot afford a budget to “go green” if in crisis • Can offer incentives to encourage businesses to go green “subsidies” • Gross national product (GNP) • Gross domestic product (GDP) • Total value of all goods and services produced within a nation in a year plus income earned by citizens • measures economic condition of country • higher GNP→higher quality of living • Per capita – person **United Nations classifies the countries as: Economically developed. US, Canada, Japan, Australia, New Zealand, Europe Economically developing. Africa, Asia, Latin America Economic Growth? an increase in the capacity to provide people with goods and services

Principles of Sustainability ICS lts LIT su PO in re n-w Wi Re ET fut spo HIC ure ns S ge ibili ne ty rat to ion s ECONOMICS Full-cost pricing Fig. 1 -5, p. 9

Environmental Problems

Doubling Time #of years it takes for a population growing at a specified rate to double it’s size • • Rule of 70: DOUBLING TIME in YEARS = 70/Percentage Growth Rate Ex – 2002 – population grew by 1. 4% 70/1. 4 = 50 years (will double in this amount of time) What year? 2052 Can also determine number of people added by using growth rate • Ex – 6 billion in 2002 • 6 x 10⁹ x. 014 = 84 million •

What is Percent Increase Population 2016 – 7. 32 Population 2015 - 7. 24 1 st need to figure out percent increase? How do we do? 7. 32 -7. 24 =. 08/7. 24 =. 011 x 100 1. 1 % Doubling time? = 70/1. 1 = 63. 63 years How to figure out how many people increased by? Population in 2015 = 7. 24 Billion 7. 24 B x. 011 =. 0796 x 109 = 80 million p

Percent Increase • • Example 2 Billion – 10 Billion Find difference 1 st 10 -2 = 8 Take difference and divide by original number • 8/2 = 4 • Multiply by 100 = 400%

Annual Rate of increase • • Total # of increase/total time Ex City A 150, 000 year 2005 180, 000 year 2008 (180, 000 -150, 000)/(2008 -2005) 30, 000/3 = 10, 000 people per year What about per month? 30, 000/(3 x 12) = 833. 33

Ecological Footprint • amount of land needed to produce the resources needed by an average person in a country • developed countries – large • developing countries – smaller • total world Ecological Footprint is 2. 7 global hectares person per year. (1 hectare – ha = 2. 47 acres ) • average biocapacity 2. 1 global ha/p (ecological deficit 0. 6)
 Country 10. 9 United States 5.")
Per Capita Ecological Footprint (Hectares of land person) Country 10. 9 United States 5. 9 The Netherlands India 1. 0
 3 billion hectares United States The Netherlands India 94")
Country Total Ecological Footprint (Hectares) 3 billion hectares United States The Netherlands India 94 million hectares 1 billion hectares

http: //www. earthday. org/footprintcalculator - can do at home

Tragedy of the Commons • exploitation or overuse of common property resources • Read excerpt • http: //www. youtube. com/watch? v=L 8 g. AMF TAt 2 M (Garrett Hardin interview -19152003)

Tragedy of the Commons

How can we reduce our environmental impact? • slow population • decrease resource use and waste • use more environmentally beneficial technologies • use less environmentally harmful technologies
 Respect life")
Solutions: Living more Sustainably • • Be environmentally educated: Go Green 1) Respect life and try to live more simply 2) Understand our environment and use knowledge to be involved • 3) Learn the positive and negative consequences of things we do in life and others do • 4) “I know, I care, I’ll do something” • 5) Conserve and Preserve
- Slides: 39