INTRODUCTION Distance What does this graph show Stationary
 Time ﺍﻟﺮﻳﺎﺿﻴﺎﺕ – ﺗﻔﻜﻴﺮ")


 Science experiment Mass of object moving down ramp (grams) 100 150")


- Slides: 61
INTRODUCTION Distance What does this graph show? Stationary (not moving) Time ﺍﻟﺮﻳﺎﺿﻴﺎﺕ – ﺗﻔﻜﻴﺮ ﺳﻠﻴﻢ – ﺩﻗﺔ ﻭﺗﻌﺎﻭﻥ – ﺻﺒﺮ ﻭﻧﻈﺎﻡ – ﺗﺬﻭﻕ ﺍﻟﺠﻤﺎﻝ ﺍﻟﻌﻠﻤﻲ. Mathematics- Proper Thinking- Accuracy and Cooperation- Patience and Discipline- Science Beauty sensation
INTRODUCTION Distance What does this graph show? Steady speed Time ﺍﻟﺮﻳﺎﺿﻴﺎﺕ – ﺗﻔﻜﻴﺮ ﺳﻠﻴﻢ – ﺩﻗﺔ ﻭﺗﻌﺎﻭﻥ – ﺻﺒﺮ ﻭﻧﻈﺎﻡ – ﺗﺬﻭﻕ ﺍﻟﺠﻤﺎﻝ ﺍﻟﻌﻠﻤﻲ. Mathematics- Proper Thinking- Accuracy and Cooperation- Patience and Discipline- Science Beauty sensation
INTRODUCTION Distance Compare the other two graphs to the first one. Fast speed Steady speed Slow speed Time ﺍﻟﺮﻳﺎﺿﻴﺎﺕ – ﺗﻔﻜﻴﺮ ﺳﻠﻴﻢ – ﺩﻗﺔ ﻭﺗﻌﺎﻭﻥ – ﺻﺒﺮ ﻭﻧﻈﺎﻡ – ﺗﺬﻭﻕ ﺍﻟﺠﻤﺎﻝ ﺍﻟﻌﻠﻤﻲ. Mathematics- Proper Thinking- Accuracy and Cooperation- Patience and Discipline- Science Beauty sensation
INTRODUCTION Distance What does this graph show? Acceleration Time ﺍﻟﺮﻳﺎﺿﻴﺎﺕ – ﺗﻔﻜﻴﺮ ﺳﻠﻴﻢ – ﺩﻗﺔ ﻭﺗﻌﺎﻭﻥ – ﺻﺒﺮ ﻭﻧﻈﺎﻡ – ﺗﺬﻭﻕ ﺍﻟﺠﻤﺎﻝ ﺍﻟﻌﻠﻤﻲ. Mathematics- Proper Thinking- Accuracy and Cooperation- Patience and Discipline- Science Beauty sensation
INTRODUCTION Distance What does this graph show? Steady speed moving away Steady speed moving further away Stationar y Time ﺍﻟﺮﻳﺎﺿﻴﺎﺕ – ﺗﻔﻜﻴﺮ ﺳﻠﻴﻢ – ﺩﻗﺔ ﻭﺗﻌﺎﻭﻥ – ﺻﺒﺮ ﻭﻧﻈﺎﻡ – ﺗﺬﻭﻕ ﺍﻟﺠﻤﺎﻝ ﺍﻟﻌﻠﻤﻲ. Mathematics- Proper Thinking- Accuracy and Cooperation- Patience and Discipline- Science Beauty sensation
INTRODUCTION Distance What does this graph show? Steady speed moving away Stationary Steady speed coming back Time ﺍﻟﺮﻳﺎﺿﻴﺎﺕ – ﺗﻔﻜﻴﺮ ﺳﻠﻴﻢ – ﺩﻗﺔ ﻭﺗﻌﺎﻭﻥ – ﺻﺒﺮ ﻭﻧﻈﺎﻡ – ﺗﺬﻭﻕ ﺍﻟﺠﻤﺎﻝ ﺍﻟﻌﻠﻤﻲ. Mathematics- Proper Thinking- Accuracy and Cooperation- Patience and Discipline- Science Beauty sensation
INTRODUCTION Distance What does this graph show? Steady speed moving away Stationary Slower steady speed moving away Time ﺍﻟﺮﻳﺎﺿﻴﺎﺕ – ﺗﻔﻜﻴﺮ ﺳﻠﻴﻢ – ﺩﻗﺔ ﻭﺗﻌﺎﻭﻥ – ﺻﺒﺮ ﻭﻧﻈﺎﻡ – ﺗﺬﻭﻕ ﺍﻟﺠﻤﺎﻝ ﺍﻟﻌﻠﻤﻲ. Mathematics- Proper Thinking- Accuracy and Cooperation- Patience and Discipline- Science Beauty sensation
Real-life graphs We often use graphs to illustrate real-life situations. Instead of plotting y-values against x-values, we plot one physical quantity against another physical quantity. The resulting graph shows the rate that one quantity changes with another. Can you think of any graphs that you have seen that are used to represent real-life situations? What quantities did these graphs use on their x-axis and the y-axis? Why? ﺍﻟﺮﻳﺎﺿﻴﺎﺕ – ﺗﻔﻜﻴﺮ ﺳﻠﻴﻢ – ﺩﻗﺔ ﻭﺗﻌﺎﻭﻥ – ﺻﺒﺮ ﻭﻧﻈﺎﻡ – ﺗﺬﻭﻕ ﺍﻟﺠﻤﺎﻝ ﺍﻟﻌﻠﻤﻲ. Mathematics- Proper Thinking- Accuracy and Cooperation- Patience and Discipline- Science Beauty sensation
Pounds and dollars This graph shows the exchange rate from British pounds to American dollars. It is a straight line graph that passes through the origin. The equation of the line would be of the form: y = mx. In this graph, what does the value of m represent? Using the graph, can you calculate how many dollars you would get if you had £ 150 to exchange? ﺍﻟﺮﻳﺎﺿﻴﺎﺕ – ﺗﻔﻜﻴﺮ ﺳﻠﻴﻢ – ﺩﻗﺔ ﻭﺗﻌﺎﻭﻥ – ﺻﺒﺮ ﻭﻧﻈﺎﻡ – ﺗﺬﻭﻕ ﺍﻟﺠﻤﺎﻝ ﺍﻟﻌﻠﻤﻲ. Mathematics- Proper Thinking- Accuracy and Cooperation- Patience and Discipline- Science Beauty sensation
This graph show the value of an investment as it gains interest cumulatively over time. The graph increases by increasing amounts. Each time interest is added, it is calculated on an ever greater amount. investment value Investing in the future time This makes a small difference at first, but as time goes on it makes a much greater difference. This is an example of an exponential increase. ﺍﻟﺮﻳﺎﺿﻴﺎﺕ – ﺗﻔﻜﻴﺮ ﺳﻠﻴﻢ – ﺩﻗﺔ ﻭﺗﻌﺎﻭﻥ – ﺻﺒﺮ ﻭﻧﻈﺎﻡ – ﺗﺬﻭﻕ ﺍﻟﺠﻤﺎﻝ ﺍﻟﻌﻠﻤﻲ. Mathematics- Proper Thinking- Accuracy and Cooperation- Patience and Discipline- Science Beauty sensation
A growing baby This graph shows the mass of a newborn baby over the first month from birth. What was the mass of the baby when it was first born? What is the baby’s mass at the end of the first month? Use the information given to describe the graph in detail. ﺍﻟﺮﻳﺎﺿﻴﺎﺕ – ﺗﻔﻜﻴﺮ ﺳﻠﻴﻢ – ﺩﻗﺔ ﻭﺗﻌﺎﻭﻥ – ﺻﺒﺮ ﻭﻧﻈﺎﻡ – ﺗﺬﻭﻕ ﺍﻟﺠﻤﺎﻝ ﺍﻟﻌﻠﻤﻲ. Mathematics- Proper Thinking- Accuracy and Cooperation- Patience and Discipline- Science Beauty sensation
Rates of change ﺍﻟﺮﻳﺎﺿﻴﺎﺕ – ﺗﻔﻜﻴﺮ ﺳﻠﻴﻢ – ﺩﻗﺔ ﻭﺗﻌﺎﻭﻥ – ﺻﺒﺮ ﻭﻧﻈﺎﻡ – ﺗﺬﻭﻕ ﺍﻟﺠﻤﺎﻝ ﺍﻟﻌﻠﻤﻲ. Mathematics- Proper Thinking- Accuracy and Cooperation- Patience and Discipline- Science Beauty sensation
Filling flasks 1 ﺍﻟﺮﻳﺎﺿﻴﺎﺕ – ﺗﻔﻜﻴﺮ ﺳﻠﻴﻢ – ﺩﻗﺔ ﻭﺗﻌﺎﻭﻥ – ﺻﺒﺮ ﻭﻧﻈﺎﻡ – ﺗﺬﻭﻕ ﺍﻟﺠﻤﺎﻝ ﺍﻟﻌﻠﻤﻲ. Mathematics- Proper Thinking- Accuracy and Cooperation- Patience and Discipline- Science Beauty sensation
Filling flasks 2 ﺍﻟﺮﻳﺎﺿﻴﺎﺕ – ﺗﻔﻜﻴﺮ ﺳﻠﻴﻢ – ﺩﻗﺔ ﻭﺗﻌﺎﻭﻥ – ﺻﺒﺮ ﻭﻧﻈﺎﻡ – ﺗﺬﻭﻕ ﺍﻟﺠﻤﺎﻝ ﺍﻟﻌﻠﻤﻲ. Mathematics- Proper Thinking- Accuracy and Cooperation- Patience and Discipline- Science Beauty sensation
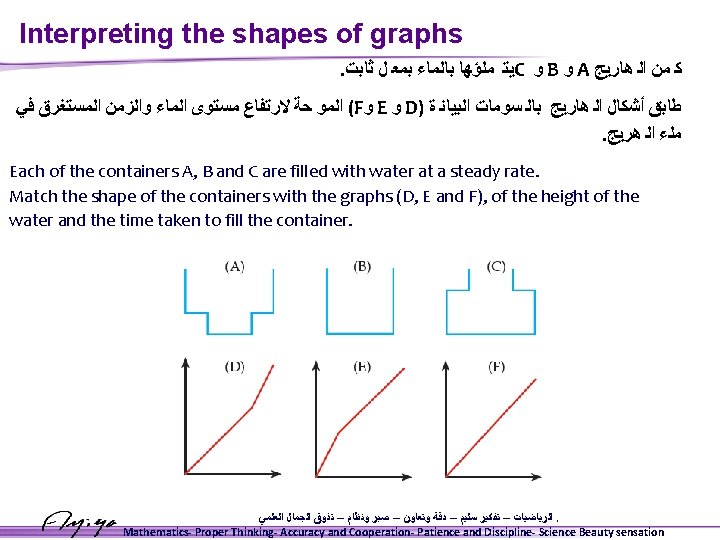
Filling flasks ﺍﻟﺮﻳﺎﺿﻴﺎﺕ – ﺗﻔﻜﻴﺮ ﺳﻠﻴﻢ – ﺩﻗﺔ ﻭﺗﻌﺎﻭﻥ – ﺻﺒﺮ ﻭﻧﻈﺎﻡ – ﺗﺬﻭﻕ ﺍﻟﺠﻤﺎﻝ ﺍﻟﻌﻠﻤﻲ. Mathematics- Proper Thinking- Accuracy and Cooperation- Patience and Discipline- Science Beauty sensation
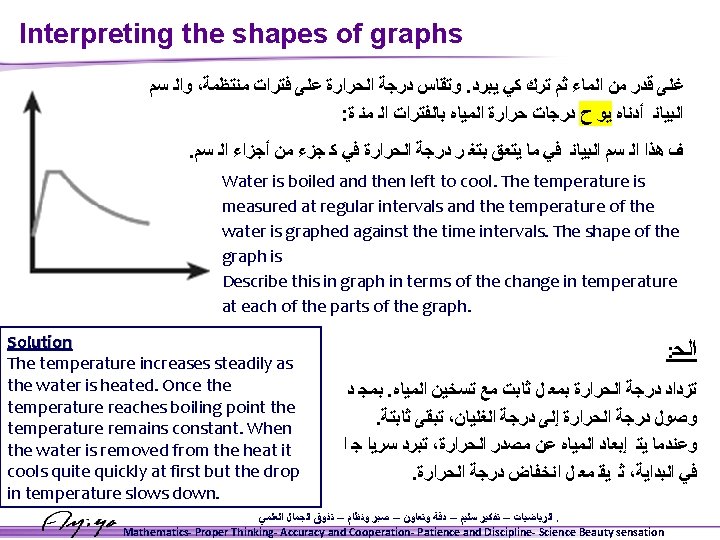
Interpreting the shapes of graphs Sara eats a bar of chocolate. This graph shows how the mass of the chocolate bar changes as it is eaten. Mass of chocolate (g) 150 Eating a bar of chocolate 100 50 0 0 10 20 30 40 50 60 70 80 90 100 Time (seconds) ﺍﻟﺮﻳﺎﺿﻴﺎﺕ – ﺗﻔﻜﻴﺮ ﺳﻠﻴﻢ – ﺩﻗﺔ ﻭﺗﻌﺎﻭﻥ – ﺻﺒﺮ ﻭﻧﻈﺎﻡ – ﺗﺬﻭﻕ ﺍﻟﺠﻤﺎﻝ ﺍﻟﻌﻠﻤﻲ. Mathematics- Proper Thinking- Accuracy and Cooperation- Patience and Discipline- Science Beauty sensation
Interpreting the shapes of graphs Temperature of water This graphs shows how the temperature of the water in a pan changes when frozen peas are added. Time ﺍﻟﺮﻳﺎﺿﻴﺎﺕ – ﺗﻔﻜﻴﺮ ﺳﻠﻴﻢ – ﺩﻗﺔ ﻭﺗﻌﺎﻭﻥ – ﺻﺒﺮ ﻭﻧﻈﺎﻡ – ﺗﺬﻭﻕ ﺍﻟﺠﻤﺎﻝ ﺍﻟﻌﻠﻤﻲ. Mathematics- Proper Thinking- Accuracy and Cooperation- Patience and Discipline- Science Beauty sensation
Time A motorbike travels away from home at a steady speed. Distanc e Can you match the graph to the situation? Time A car remains parked in a car park. A runner runs at a steady pace to the end of a track, turns around then runs at the same speed back. ﺍﻟﺮﻳﺎﺿﻴﺎﺕ – ﺗﻔﻜﻴﺮ ﺳﻠﻴﻢ – ﺩﻗﺔ ﻭﺗﻌﺎﻭﻥ – ﺻﺒﺮ ﻭﻧﻈﺎﻡ – ﺗﺬﻭﻕ ﺍﻟﺠﻤﺎﻝ ﺍﻟﻌﻠﻤﻲ. Mathematics- Proper Thinking- Accuracy and Cooperation- Patience and Discipline- Science Beauty sensation
Distance – time graphs One Sunday afternoon, John takes his car to visit a friend. John drives at a constant speed for 30 minutes until he reaches his friend’s house 20 miles away. He stays at his friend’s house for 45 minutes. He drives home at a constant speed and arrives home 45 minutes later. Can you draw a graph to represent John’s journey? What quantity will you put on the x-axis? What quantity will you put on the y-axis? Why? ﺍﻟﺮﻳﺎﺿﻴﺎﺕ – ﺗﻔﻜﻴﺮ ﺳﻠﻴﻢ – ﺩﻗﺔ ﻭﺗﻌﺎﻭﻥ – ﺻﺒﺮ ﻭﻧﻈﺎﻡ – ﺗﺬﻭﻕ ﺍﻟﺠﻤﺎﻝ ﺍﻟﻌﻠﻤﻲ. Mathematics- Proper Thinking- Accuracy and Cooperation- Patience and Discipline- Science Beauty sensation
John’s journey ﺍﻟﺮﻳﺎﺿﻴﺎﺕ – ﺗﻔﻜﻴﺮ ﺳﻠﻴﻢ – ﺩﻗﺔ ﻭﺗﻌﺎﻭﻥ – ﺻﺒﺮ ﻭﻧﻈﺎﻡ – ﺗﺬﻭﻕ ﺍﻟﺠﻤﺎﻝ ﺍﻟﻌﻠﻤﻲ. Mathematics- Proper Thinking- Accuracy and Cooperation- Patience and Discipline- Science Beauty sensation
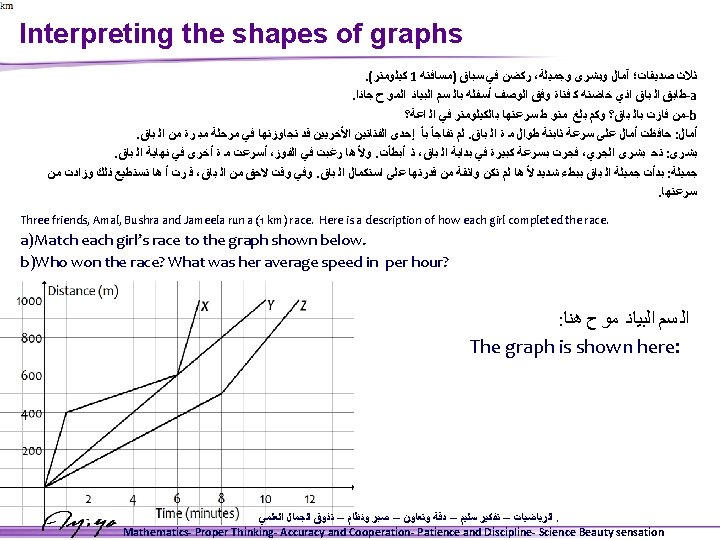
Interpreting distance – time graphs ﺍﻟﺮﻳﺎﺿﻴﺎﺕ – ﺗﻔﻜﻴﺮ ﺳﻠﻴﻢ – ﺩﻗﺔ ﻭﺗﻌﺎﻭﻥ – ﺻﺒﺮ ﻭﻧﻈﺎﻡ – ﺗﺬﻭﻕ ﺍﻟﺠﻤﺎﻝ ﺍﻟﻌﻠﻤﻲ. Mathematics- Proper Thinking- Accuracy and Cooperation- Patience and Discipline- Science Beauty sensation
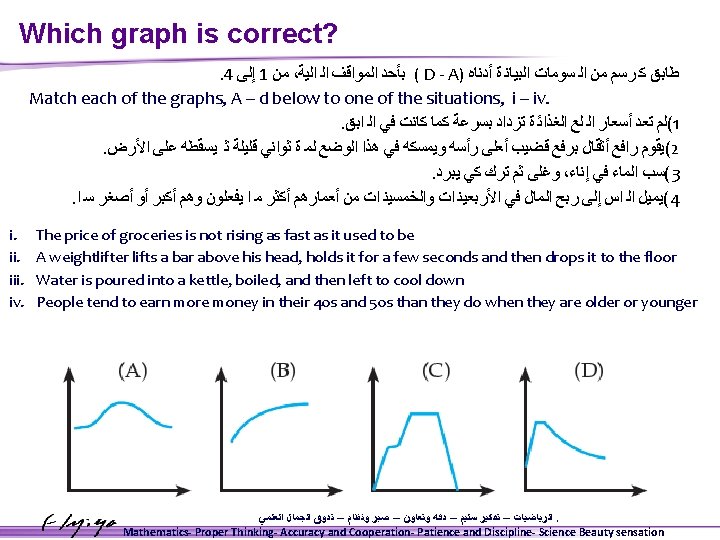
Which graph is correct? In an experiment a group of pupils poured water onto a sponge and weighed it at regular intervals. Each time the sponge soaked up all the water. Volume of water (cm 3) Graph C Mass of sponge (g) Graph B Mass of sponge (g) Graph A Mass of sponge (g) Which graph is most likely to show their results? Volume of water (cm 3) Graph D Volume of water (cm 3) ﺍﻟﺮﻳﺎﺿﻴﺎﺕ – ﺗﻔﻜﻴﺮ ﺳﻠﻴﻢ – ﺩﻗﺔ ﻭﺗﻌﺎﻭﻥ – ﺻﺒﺮ ﻭﻧﻈﺎﻡ – ﺗﺬﻭﻕ ﺍﻟﺠﻤﺎﻝ ﺍﻟﻌﻠﻤﻲ. Mathematics- Proper Thinking- Accuracy and Cooperation- Patience and Discipline- Science Beauty sensation
Sketching graphs A group of pupils are conducting an experiment. They fill three beakers with boiling water and record the temperature of the water over time. The temperature graph for beaker A looks as follows: How would the graphs for beakers B and C compare to this? Temperature (o. C) Beaker A has no wrapping, Beaker B is wrapped in ice and Beaker C is wrapped in insulation fibre. Beaker A Time (minutes) ﺍﻟﺮﻳﺎﺿﻴﺎﺕ – ﺗﻔﻜﻴﺮ ﺳﻠﻴﻢ – ﺩﻗﺔ ﻭﺗﻌﺎﻭﻥ – ﺻﺒﺮ ﻭﻧﻈﺎﻡ – ﺗﺬﻭﻕ ﺍﻟﺠﻤﺎﻝ ﺍﻟﻌﻠﻤﻲ. Mathematics- Proper Thinking- Accuracy and Cooperation- Patience and Discipline- Science Beauty sensation
Sketching graphs ﺍﻟﺮﻳﺎﺿﻴﺎﺕ – ﺗﻔﻜﻴﺮ ﺳﻠﻴﻢ – ﺩﻗﺔ ﻭﺗﻌﺎﻭﻥ – ﺻﺒﺮ ﻭﻧﻈﺎﻡ – ﺗﺬﻭﻕ ﺍﻟﺠﻤﺎﻝ ﺍﻟﻌﻠﻤﻲ. Mathematics- Proper Thinking- Accuracy and Cooperation- Patience and Discipline- Science Beauty sensation
Matching graphs to statements ﺍﻟﺮﻳﺎﺿﻴﺎﺕ – ﺗﻔﻜﻴﺮ ﺳﻠﻴﻢ – ﺩﻗﺔ ﻭﺗﻌﺎﻭﻥ – ﺻﺒﺮ ﻭﻧﻈﺎﻡ – ﺗﺬﻭﻕ ﺍﻟﺠﻤﺎﻝ ﺍﻟﻌﻠﻤﻲ. Mathematics- Proper Thinking- Accuracy and Cooperation- Patience and Discipline- Science Beauty sensation
What’s the temperature? Frank has been asked to draw a graph that illustrates the temperature relationship between °F and °C. Frank records the following information from his research. Temp (°C) 0 20 40 60 80 100 Temp (°F) 32 68 104 140 176 212 What is the temperature in °F when it is 70°C? What is the gradient of the graph when °F is plotted on the vertical axis? Can you find a way to express the relationship between °F and °C? ﺍﻟﺮﻳﺎﺿﻴﺎﺕ – ﺗﻔﻜﻴﺮ ﺳﻠﻴﻢ – ﺩﻗﺔ ﻭﺗﻌﺎﻭﻥ – ﺻﺒﺮ ﻭﻧﻈﺎﻡ – ﺗﺬﻭﻕ ﺍﻟﺠﻤﺎﻝ ﺍﻟﻌﻠﻤﻲ. Mathematics- Proper Thinking- Accuracy and Cooperation- Patience and Discipline- Science Beauty sensation
A good deal? Theo is looking for a new mobile phone and has seen the model he wants advertised on two different tariffs. 12 month contract: £ 9. 99 a month FREE handset and texts! Calls only 10 p per minute! PAYG £ 40 for handset FREE texts Calls only 5 p per minute! Which tariff is better value if Theo makes 200 minutes of calls in the first month? Show your working. At what stage in the first month does the monthly contract cost more than the PAYG phone? ﺍﻟﺮﻳﺎﺿﻴﺎﺕ – ﺗﻔﻜﻴﺮ ﺳﻠﻴﻢ – ﺩﻗﺔ ﻭﺗﻌﺎﻭﻥ – ﺻﺒﺮ ﻭﻧﻈﺎﻡ – ﺗﺬﻭﻕ ﺍﻟﺠﻤﺎﻝ ﺍﻟﻌﻠﻤﻲ. Mathematics- Proper Thinking- Accuracy and Cooperation- Patience and Discipline- Science Beauty sensation
Mobile graph ﺍﻟﺮﻳﺎﺿﻴﺎﺕ – ﺗﻔﻜﻴﺮ ﺳﻠﻴﻢ – ﺩﻗﺔ ﻭﺗﻌﺎﻭﻥ – ﺻﺒﺮ ﻭﻧﻈﺎﻡ – ﺗﺬﻭﻕ ﺍﻟﺠﻤﺎﻝ ﺍﻟﻌﻠﻤﻲ. Mathematics- Proper Thinking- Accuracy and Cooperation- Patience and Discipline- Science Beauty sensation
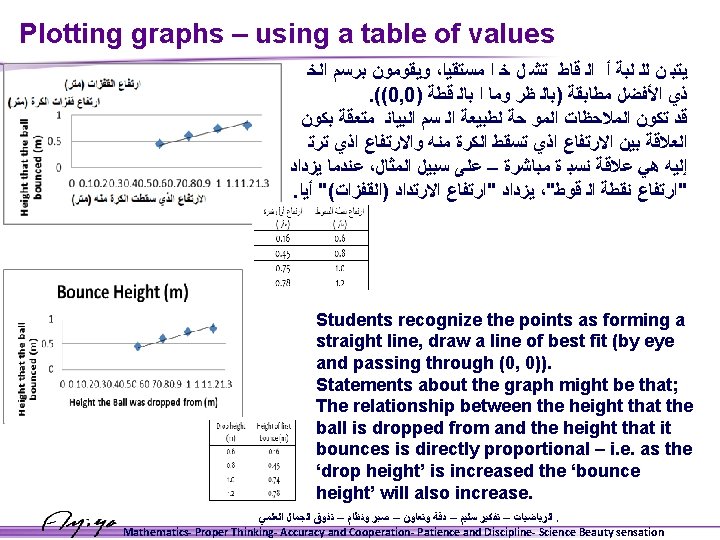
Plotting graphs – using a table of values When we plot a graph we usually start with a table of values. The values in the table usually come from a formula or equation or from an observation or experiment. For example, a car hire company charges £ 30 to hire a car and then £ 25 for each day that the car is hired. This would give us the following table of values: Number of days, d Cost in £, c 1 2 3 4 5 55 80 105 130 155 The cost of the car hire depends on the number of days. The number of days must therefore go in the top row. ﺍﻟﺮﻳﺎﺿﻴﺎﺕ – ﺗﻔﻜﻴﺮ ﺳﻠﻴﻢ – ﺩﻗﺔ ﻭﺗﻌﺎﻭﻥ – ﺻﺒﺮ ﻭﻧﻈﺎﻡ – ﺗﺬﻭﻕ ﺍﻟﺠﻤﺎﻝ ﺍﻟﻌﻠﻤﻲ. Mathematics- Proper Thinking- Accuracy and Cooperation- Patience and Discipline- Science Beauty sensation
Plotting graphs – plotting the points Use the table of values to plot the points on the graph. 1 2 3 4 5 Cost in £, c 55 80 105 130 155 Cost (£) Number of days, d Cost of car hire 150 140 130 120 110 100 90 80 70 60 50 40 30 0 It is most accurate to use a small cross for each point. If appropriate, join the points together using a ruler. Lastly, don’t forget to give the graph a title. 0 1 2 3 4 5 Number of days ﺍﻟﺮﻳﺎﺿﻴﺎﺕ – ﺗﻔﻜﻴﺮ ﺳﻠﻴﻢ – ﺩﻗﺔ ﻭﺗﻌﺎﻭﻥ – ﺻﺒﺮ ﻭﻧﻈﺎﻡ – ﺗﺬﻭﻕ ﺍﻟﺠﻤﺎﻝ ﺍﻟﻌﻠﻤﻲ. Mathematics- Proper Thinking- Accuracy and Cooperation- Patience and Discipline- Science Beauty sensation
Time taken (seconds) Science experiment Mass of object moving down ramp (grams) 100 150 200 250 Time taken for object to move down ramp (seconds) 4 7 12 17 We can join the points using straight lines. 20 16 Do the intermediate points have any practical significance? 12 8 4 0 0 50 100 150 200 250 300 How could we make the graph more accurate? Mass of object (grams) ﺍﻟﺮﻳﺎﺿﻴﺎﺕ – ﺗﻔﻜﻴﺮ ﺳﻠﻴﻢ – ﺩﻗﺔ ﻭﺗﻌﺎﻭﻥ – ﺻﺒﺮ ﻭﻧﻈﺎﻡ – ﺗﺬﻭﻕ ﺍﻟﺠﻤﺎﻝ ﺍﻟﻌﻠﻤﻲ. Mathematics- Proper Thinking- Accuracy and Cooperation- Patience and Discipline- Science Beauty sensation
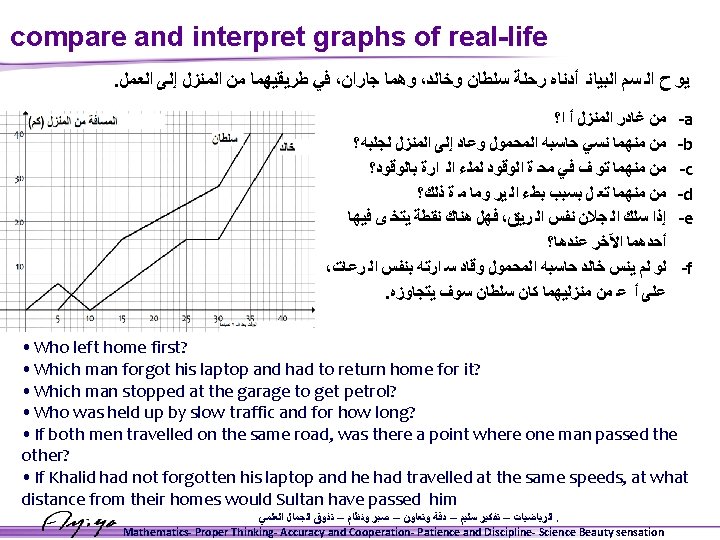
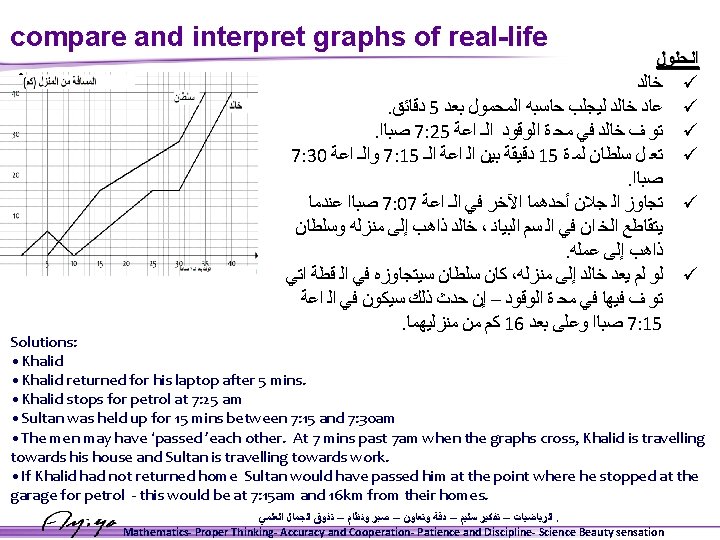
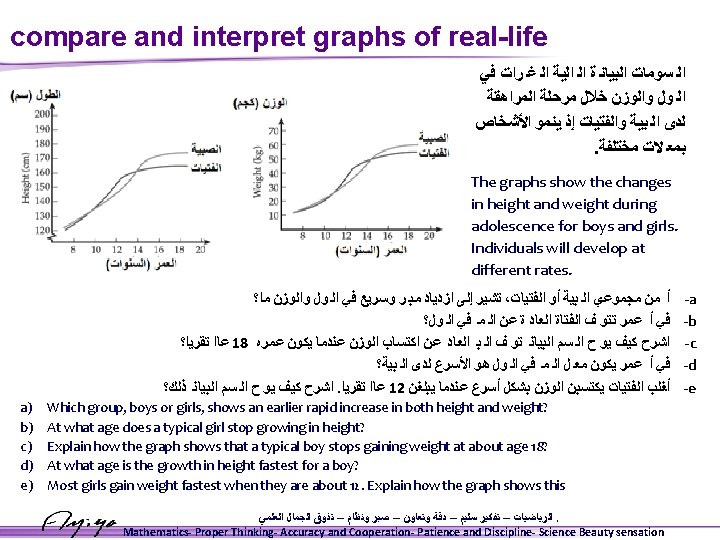
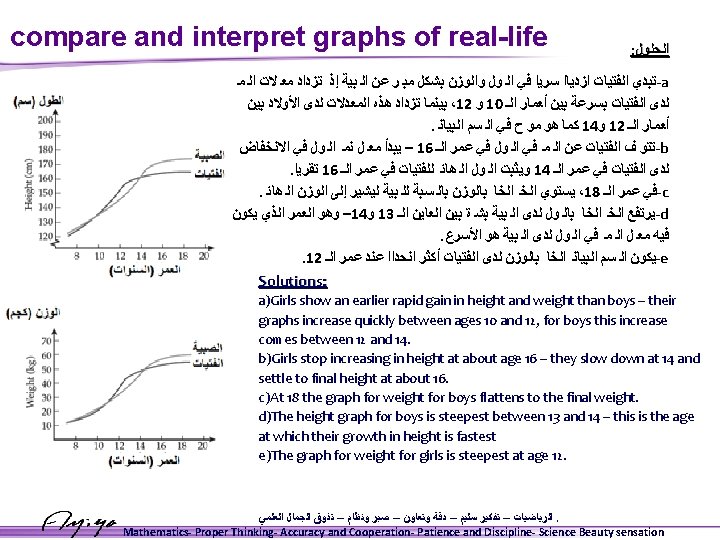
compare and interpret graphs of real-life The graph below shows the distance-time graph of the race between the hare and the tortoise. 1) Decide which line represents the hare and which one represents the tortoise. 2) Write a commentary for the race! ﺍﻟﺮﻳﺎﺿﻴﺎﺕ – ﺗﻔﻜﻴﺮ ﺳﻠﻴﻢ – ﺩﻗﺔ ﻭﺗﻌﺎﻭﻥ – ﺻﺒﺮ ﻭﻧﻈﺎﻡ – ﺗﺬﻭﻕ ﺍﻟﺠﻤﺎﻝ ﺍﻟﻌﻠﻤﻲ. Mathematics- Proper Thinking- Accuracy and Cooperation- Patience and Discipline- Science Beauty sensation
Interpreting Graphs A pelican flies above the water searching for fish. Sketch a graph of its altitude from takeoff from shore to diving to the water to catch a fish. Label each section. ﺍﻟﺮﻳﺎﺿﻴﺎﺕ – ﺗﻔﻜﻴﺮ ﺳﻠﻴﻢ – ﺩﻗﺔ ﻭﺗﻌﺎﻭﻥ – ﺻﺒﺮ ﻭﻧﻈﺎﻡ – ﺗﺬﻭﻕ ﺍﻟﺠﻤﺎﻝ ﺍﻟﻌﻠﻤﻲ. Mathematics- Proper Thinking- Accuracy and Cooperation- Patience and Discipline- Science Beauty sensation
Car Graphing Activity This graphing experiment shows a movie of a car travelling along a straight road. Copy the results table shown on the next slide and complete it as the movie is played. Record the distance the car has travelled every five seconds. Then graph your results. Note that there are teacher’s notes, in “Notes View” on this slide. ﺍﻟﺮﻳﺎﺿﻴﺎﺕ – ﺗﻔﻜﻴﺮ ﺳﻠﻴﻢ – ﺩﻗﺔ ﻭﺗﻌﺎﻭﻥ – ﺻﺒﺮ ﻭﻧﻈﺎﻡ – ﺗﺬﻭﻕ ﺍﻟﺠﻤﺎﻝ ﺍﻟﻌﻠﻤﻲ. Mathematics- Proper Thinking- Accuracy and Cooperation- Patience and Discipline- Science Beauty sensation
Results table for Distance / Time Graph Time/Seconds 0 5 10 Distance/Metres 15 20 25 30 35 40 45 50 55 ﺍﻟﺮﻳﺎﺿﻴﺎﺕ – ﺗﻔﻜﻴﺮ ﺳﻠﻴﻢ – ﺩﻗﺔ ﻭﺗﻌﺎﻭﻥ – ﺻﺒﺮ ﻭﻧﻈﺎﻡ – ﺗﺬﻭﻕ ﺍﻟﺠﻤﺎﻝ ﺍﻟﻌﻠﻤﻲ. Mathematics- Proper Thinking- Accuracy and Cooperation- Patience and Discipline- Science Beauty sensation
ﺍﻟﺮﻳﺎﺿﻴﺎﺕ – ﺗﻔﻜﻴﺮ ﺳﻠﻴﻢ – ﺩﻗﺔ ﻭﺗﻌﺎﻭﻥ – ﺻﺒﺮ ﻭﻧﻈﺎﻡ – ﺗﺬﻭﻕ ﺍﻟﺠﻤﺎﻝ ﺍﻟﻌﻠﻤﻲ. Mathematics- Proper Thinking- Accuracy and Cooperation- Patience and Discipline- Science Beauty sensation
Results table for Distance / Time Graph Time/Seconds 0 5 10 15 20 25 30 35 40 45 50 55 Distance/Metres 0 16 76 186 234 484 634 784 904 974 994 ﺍﻟﺮﻳﺎﺿﻴﺎﺕ – ﺗﻔﻜﻴﺮ ﺳﻠﻴﻢ – ﺩﻗﺔ ﻭﺗﻌﺎﻭﻥ – ﺻﺒﺮ ﻭﻧﻈﺎﻡ – ﺗﺬﻭﻕ ﺍﻟﺠﻤﺎﻝ ﺍﻟﻌﻠﻤﻲ. Mathematics- Proper Thinking- Accuracy and Cooperation- Patience and Discipline- Science Beauty sensation
ﺍﻟﺮﻳﺎﺿﻴﺎﺕ – ﺗﻔﻜﻴﺮ ﺳﻠﻴﻢ – ﺩﻗﺔ ﻭﺗﻌﺎﻭﻥ – ﺻﺒﺮ ﻭﻧﻈﺎﻡ – ﺗﺬﻭﻕ ﺍﻟﺠﻤﺎﻝ ﺍﻟﻌﻠﻤﻲ. Mathematics- Proper Thinking- Accuracy and Cooperation- Patience and Discipline- Science Beauty sensation
ﺍﻟﺮﻳﺎﺿﻴﺎﺕ – ﺗﻔﻜﻴﺮ ﺳﻠﻴﻢ – ﺩﻗﺔ ﻭﺗﻌﺎﻭﻥ – ﺻﺒﺮ ﻭﻧﻈﺎﻡ – ﺗﺬﻭﻕ ﺍﻟﺠﻤﺎﻝ ﺍﻟﻌﻠﻤﻲ. Mathematics- Proper Thinking- Accuracy and Cooperation- Patience and Discipline- Science Beauty sensation
The car has stopped: The line is flat – the distance of the car from the start point The linecar on is thestarting graph to is not straight, so we know the move. is not changing. Theofcurve car going fast but atspeed a constant speed theiscar is changing. The shows that the is changing. The line is straight – meaning that there is no CHANGE in The lineisisdownwards straight in as this region of the down graph. at The curve the car slows curve is upwards as the car accelerates at the end speed. of the movie. start of the movie. ﺍﻟﺮﻳﺎﺿﻴﺎﺕ – ﺗﻔﻜﻴﺮ ﺳﻠﻴﻢ – ﺩﻗﺔ ﻭﺗﻌﺎﻭﻥ – ﺻﺒﺮ ﻭﻧﻈﺎﻡ – ﺗﺬﻭﻕ ﺍﻟﺠﻤﺎﻝ ﺍﻟﻌﻠﻤﻲ. Mathematics- Proper Thinking- Accuracy and Cooperation- Patience and Discipline- Science Beauty sensation
Gradient of a Distance / Time Graph The speed of the car can be calculated by looking at the gradient of the Distance / Time graph. Speed is “Distance Travelled divided by Time Taken” Both these values can be read off the Distance / Time graph, and this is the same as the gradient of the line. ﺍﻟﺮﻳﺎﺿﻴﺎﺕ – ﺗﻔﻜﻴﺮ ﺳﻠﻴﻢ – ﺩﻗﺔ ﻭﺗﻌﺎﻭﻥ – ﺻﺒﺮ ﻭﻧﻈﺎﻡ – ﺗﺬﻭﻕ ﺍﻟﺠﻤﺎﻝ ﺍﻟﻌﻠﻤﻲ. Mathematics- Proper Thinking- Accuracy and Cooperation- Patience and Discipline- Science Beauty sensation
Look at the straight line part of this graph shown by the two arrows in a triangle. The car has travelled from 200 m to 800 m, = 600 m The car has taken from 16 s to 36 s to travel this distance = 20 seconds Therefore the speed is 600 divided by 20 = 30 m/s ﺍﻟﺮﻳﺎﺿﻴﺎﺕ – ﺗﻔﻜﻴﺮ ﺳﻠﻴﻢ – ﺩﻗﺔ ﻭﺗﻌﺎﻭﻥ – ﺻﺒﺮ ﻭﻧﻈﺎﻡ – ﺗﺬﻭﻕ ﺍﻟﺠﻤﺎﻝ ﺍﻟﻌﻠﻤﻲ. Mathematics- Proper Thinking- Accuracy and Cooperation- Patience and Discipline- Science Beauty sensation
Plotting the Speed / Time Graph Having looked at the distance-time graph, plot the speed-time graph. Copy the results table shown on the next slide and complete it as the movie is played. Record the speed of the car at five second intervals. Then graph your results. ﺍﻟﺮﻳﺎﺿﻴﺎﺕ – ﺗﻔﻜﻴﺮ ﺳﻠﻴﻢ – ﺩﻗﺔ ﻭﺗﻌﺎﻭﻥ – ﺻﺒﺮ ﻭﻧﻈﺎﻡ – ﺗﺬﻭﻕ ﺍﻟﺠﻤﺎﻝ ﺍﻟﻌﻠﻤﻲ. Mathematics- Proper Thinking- Accuracy and Cooperation- Patience and Discipline- Science Beauty sensation
Results table for Speed / Time Graph Time/Seconds 0 5 10 Speed/m/s 15 20 25 30 35 40 45 50 55 ﺍﻟﺮﻳﺎﺿﻴﺎﺕ – ﺗﻔﻜﻴﺮ ﺳﻠﻴﻢ – ﺩﻗﺔ ﻭﺗﻌﺎﻭﻥ – ﺻﺒﺮ ﻭﻧﻈﺎﻡ – ﺗﺬﻭﻕ ﺍﻟﺠﻤﺎﻝ ﺍﻟﻌﻠﻤﻲ. Mathematics- Proper Thinking- Accuracy and Cooperation- Patience and Discipline- Science Beauty sensation
ﺍﻟﺮﻳﺎﺿﻴﺎﺕ – ﺗﻔﻜﻴﺮ ﺳﻠﻴﻢ – ﺩﻗﺔ ﻭﺗﻌﺎﻭﻥ – ﺻﺒﺮ ﻭﻧﻈﺎﻡ – ﺗﺬﻭﻕ ﺍﻟﺠﻤﺎﻝ ﺍﻟﻌﻠﻤﻲ. Mathematics- Proper Thinking- Accuracy and Cooperation- Patience and Discipline- Science Beauty sensation
Results table for Speed / Time Graph Time/Seconds 0 5 10 15 20 25 30 35 40 45 50 55 Speed/m/s 0 6 16 26 30 30 20 10 0 0 ﺍﻟﺮﻳﺎﺿﻴﺎﺕ – ﺗﻔﻜﻴﺮ ﺳﻠﻴﻢ – ﺩﻗﺔ ﻭﺗﻌﺎﻭﻥ – ﺻﺒﺮ ﻭﻧﻈﺎﻡ – ﺗﺬﻭﻕ ﺍﻟﺠﻤﺎﻝ ﺍﻟﻌﻠﻤﻲ. Mathematics- Proper Thinking- Accuracy and Cooperation- Patience and Discipline- Science Beauty sensation
ﺍﻟﺮﻳﺎﺿﻴﺎﺕ – ﺗﻔﻜﻴﺮ ﺳﻠﻴﻢ – ﺩﻗﺔ ﻭﺗﻌﺎﻭﻥ – ﺻﺒﺮ ﻭﻧﻈﺎﻡ – ﺗﺬﻭﻕ ﺍﻟﺠﻤﺎﻝ ﺍﻟﻌﻠﻤﻲ. Mathematics- Proper Thinking- Accuracy and Cooperation- Patience and Discipline- Science Beauty sensation
The car is at rest here – with zero speed Car is accelerating here – the speed is increasing. The car is going at constant speed – acceleration is zero. The car is decelerating here – or slowing down ﺍﻟﺮﻳﺎﺿﻴﺎﺕ – ﺗﻔﻜﻴﺮ ﺳﻠﻴﻢ – ﺩﻗﺔ ﻭﺗﻌﺎﻭﻥ – ﺻﺒﺮ ﻭﻧﻈﺎﻡ – ﺗﺬﻭﻕ ﺍﻟﺠﻤﺎﻝ ﺍﻟﻌﻠﻤﻲ. Mathematics- Proper Thinking- Accuracy and Cooperation- Patience and Discipline- Science Beauty sensation
From both graphs we can see that the speed The is speed is and zero – decreasing The speed is 30 m/s. The Now compare the car is not the curve is increasing, and we Speed / Time graph (Using the moving downwards can see that the with the earlier value and we can see Distance / Time graph–Distance / Time calculated that the distance curves upwards. graph previously) that the car has travelled is not changing either. ﺍﻟﺮﻳﺎﺿﻴﺎﺕ – ﺗﻔﻜﻴﺮ ﺳﻠﻴﻢ – ﺩﻗﺔ ﻭﺗﻌﺎﻭﻥ – ﺻﺒﺮ ﻭﻧﻈﺎﻡ – ﺗﺬﻭﻕ ﺍﻟﺠﻤﺎﻝ ﺍﻟﻌﻠﻤﻲ. Mathematics- Proper Thinking- Accuracy and Cooperation- Patience and Discipline- Science Beauty sensation