Introduction Contents The data box The three modes


Introduction. Contents The data box The three modes of the data box: selection effects Designs for longitudinal studies Trend stud Cohort study Panel study Follow -up study Time series study 2

Introduction 3

Table 1. Key Design Features FEATURE KEY QUESTIONS DESIGN OPTIONS Intervention Will there be an intervention ? (What will the intervention entail ? What specific design will be used ? Experimental, quasi-experimental, nonexperimental design Control over How will extraneous variables be extraneous controlled? (Which extraneous) variables will variables be controlled? ) Matching, homogeneity, blocking, crossover, randomization, statistical control 4
. Key Design Features FEATURE Masking KEY QUESTIONS DESIGN OPTIONS From whom will")
Table 1(continue). Key Design Features FEATURE Masking KEY QUESTIONS DESIGN OPTIONS From whom will critical information be withheld to avert bias? Open versus closed study; single-blind, double-blind studies Comparisons What type of comparisons will be Within-subjects design, made to illuminate key processes or relationships? between-subjects design, external comparisons 5
. Key Design Features FEATURE Location KEY QUESTIONS Where will the study take")
Table 1(continue). Key Design Features FEATURE Location KEY QUESTIONS Where will the study take place? Timeframes How often will data be DESIGN OPTIONS Single site versus multisite; in the field versus controlled setting Cross-sectional, longitudinal design collected? (When, relative to other events, will data be collected? Retrospective, When will information on prospective design independent and dependent variables be collected-looking backward or forward? ) 6

The Time Dimension Research Design Cross-Sectional Design The collection of data at one point in time: the phenomena under study are captured during one period of data collection. Longitudinal-Design The collection of data at more than one point in time over an extended period. 7

The data box Longitudinal data can be conceptualized in framework of a data box, the axes of which are defined by p persons (N) p variables (M) p occasions (T) 8

persons i=1, …, N variables j=1, … , M occasions t=1, …, T Figure 1. Data Box 9
 variable mode")
The three modes of the data box: selection effects person mode (N) variable mode (M) occasion mode (T) 10

Table 2: 11

Repeated Cross-Sectional Designs 12

Repeated Cross-Sectional Designs Figure 2. Repeated Cross-Sectional Designs 13

Table 3: Cross-Sectional Design Age Group Sample Occasion Observed variables one point in time A 1 A 2. . . AG S 1 S 2. . . SG t 1. . . t 1 X 1, X 2, X 3, …XM. . . X 1, X 2, X 3, …XM 14

Table 4: Trend Study Age Group Sample Occasion same population Different samples repeated intervals A 1. . . A 1 S 2. . . ST t 1 t 2. . . t. T Observed variables X 1, X 2, X 3, …XM. . . X 1, X 2, X 3, …XM 15

Table 5: Panel Study Age Group Sample Occasion same or Different age samples repeated intervals S 1. . . S 1 t 2. . . t. T panel Observed variables X 1, X 2, X 3, …XM. . . X 1, X 2, X 3, …XM 16

Table 6: Time Series Study Age Group Sample Occasion different people samples repeated intervals A 1 A 2. . . AT S 1. . . S 1 t 2. . . t. T Observed variables X 1, X 2, X 3, …XM. . . X 1, X 2, X 3, …XM 19

Table 7 : Representation of Intervention Studies Age A 1 A 2. . . AT Experimental Treatment Control group No treatment E 1. . . E 1 C 1. . . C 1 Sample Occasion same samples repeated intervals S 1. . . S 1 t 2. . . t. T Observed variables X 1, X 2, X 3, …XM. . . X 1, X 2, X 3, …XM 20

Table 8: Cohort Study Age Group Sample Occasion specific agerelated subgroups experienced the same event at the same time. repeated intervals S 1. . . S 1 t 2. . . t. T 1936 1946 1956 1966 1976 Observed variables X 1, X 2, X 3, …XM. . . X 1, X 2, X 3, …XM 21
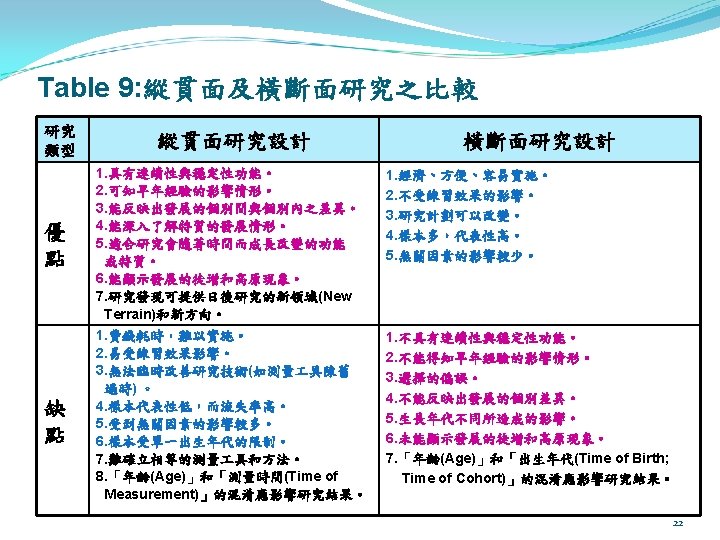

Longitudinal-Design Four situation : 1. Studying time-related processes Some research problems specifically concern phenomena that evolve over time (e. g. hearing, learning and physical growth). 2. Determing time sequence It is sometimes important to determine the sequencing of phenomina. 3. Making comparisons over time Some studies are undertaken to examine whether changes have occurred over time. 4. Enhacing research control Quantitative researchers sometimes collect data at multiple points to enhance interpretability of the results. 23

Designs for Longitudinal studies Five types: p Trend study p Cohort study p Panel study p Follow -up study p Time series study 24

Trend study Investigations in which samples from a popultion are studied over time with respect to some phenomenon. Different samples are selected at repeated intervals, but the sample always drawn from the same population. Research can to examine patterns and rates of change over time and to predict future developments. 25

Changes in Psychiatric Problems and Service Use Among 8 -Year. Old Children: A 16 -Year Population-Based Time-Trend Study Figure 3. Changes in Psychiatric Problems and Service Use Among 8 -Year-Old Children: A 16 -Year Population-Based Time-Trend Study 26

Advantages Flexibility : Can be based on a comparison of survey data originally constructed for other purposes. Of course in utilizing such secondary data, the research needs to recognize any differences in question wording, contexts, sampling, or analysis techniques that might differ from one survey to the next. Cost effectiveness : Since trend studies allow researchers to use secondary data, it saves time, money, and personnel. 27

Disadvantage internal validity : Trend analysis is to provide descriptive trends of some topic in a certain period of time. Therefore, there is less concerns on internal validity because it does not aim to provide causal inferences as in the case of experimental studies or some penal studies. instrumentation threat : If data are unreliable, for example, false trends will show up in the results. If trend analysis is based on inconsistent measures, the results will be biased. 28

Cohort study A particular kind of trend study in which specific subpopulations are examined over time. The samples are usually drawn from specific age -related subgroups. People who all have experienced the same event at the same time. 29

Graphical illustration of cohort study Figure 4. Graphical illustration of cohort study 30
")
Cohort study Two main types of cohort study : 1. Prospective (more usual type) --baseline information is collected when subjects enter the study and they are followed up over its duration 2. Retrospective --a 'historical cohort' is identified with reference to some point in the past 31

Prospective cohort study 32

Retrospective cohort study 33

Cohort study Cross sequential design ØTwo or more age cohort are studied longitudinally so that both changes over time and generational(cohort) differences can be detected. 34

Cross sequential design Table 10. Cross sequential design TIME OF MEASUREMENT BIRTH COHORT 1970 1960 1950 1940 2000 2010 2020 2030 30 Yr. Olds 40 Yr. Olds 50 Yr. Olds 60 Yr. Olds Who ? 30 -60 year olds What ? Age DIFFERENCES and age CHANGES in intelligence How? Measure two different groups of people (from two different birth cohorts) across time 35

Durg exposure opportunities and use patterns among college students : results of a longitudinal prospective cohort study 5. 36

Durg exposure opportunities and use patterns among college students : results of a longitudinal prospective cohort study 6. 37


Advantages 1. Does not require strict random assignment of subjects, which is, in many cases, unethical or improbable. 2. It is appealing and useful technique because it is highly flexible. It provides insight into the effects of maturation and social, cultural, and political change. In addition, it can be used with either original data or secondary data. 39

Disadvantages 1. threats to validity : Cohort studies are subject to the influence of factors over which the investigators most often do not have full control. 2. Cohort studies is that they can end up taking a very long time, since the researchers have to wait for the conditions of interest to develop. 40

Panel study The same people are used to supply data at two or more points in time. The same people are studied over time can identify individuals who did and did not change and then examine characteristics that differentiate the two groups. The sample is used over and over. 41

Panel study Types Ø Revolving panel design Ø Prospective panel design Ø Multiple point prospective panel design Ø Single panel design with replacement Ø Single panel design without replacement 42
 part of the sample is “replaced”")
Revolving panel design At each occasion a (fixed) part of the sample is “replaced” or so to say “refreshed” by new subjects. this advantage that subject will less easily develop ”survey boredom”. 43

A Panel Study of Physical. Activity in Taiwanese Youth : Testing the Revised Health-Promotion Model Procedures: Wave 1 data collection occurred when the students were in their eighth grade at the beginning of year and Wave 2 occurred in the following year when these students went to the ninth grade. The average time to complete the questionnaires was about 15 to 20 minutes. 44

A Panel Study of Physical Activity in Taiwanese Youth: Testing the Revised Health-Promotion Model Figure 7. A Panel Study of Physical Activity in Taiwanese Youth:Testing the Revised Health. Promotion Model 45

Advantages 1. Panel data are particularly useful in answering questions about the dynamics of change. 2. Useful in predicting long-term or cumulative effects which are normally hard to analyze in a one-shot case study (or cross-sectional study). 3. Since the research progresses over a period time, the research can allow for the influences of competing stimuli on the subject, which might increase external validity of the study. 46

Disadvantages 1. panel members are often difficult to recruit because of an unwillingness to fill out questionnaires or submit to interviews several times. 2. Mortality issue 3. Since the variables are measured over time , it is relatively more valid to make causal inferences with temporal order which might be difficult to get in cross -sectional studies. 4. testing threat 5. instrumentation threat 47

Follow -up study Undertaken to determine the subsequent development of individuals who have a specific condition or who have received a specific intervention. . Panel and follow-up study has a major challenge that is to retain study participants. 48

Follow -up study C: Documents and Settingsuser桌面folloe up study -2. pdf 49

Time-series Design Definition Why Need Time series design Major classes of Time series design 50

Definition Time Series Designs Collecting data at multiple time points, and compare “pre-treatment” data (baseline phase) with “post-treatment” data (treatment/ intervention phase). Collecting data at several points before the treatment allows one to understand the natural fluctuation of the phenomenon. 51

Why Need Time series design Addressing questions as: Is the intervention effective? When is the intervention most effective? What is the pattern of the intervention effect through time? Has a reliable change been produced? Can future changes in the variable be predicted? X Increase research’s validity A B O 1 O 2 O 3 O 4 O 5 O 6 O 7 O 8 52
 Objectives: Forecasting • Simulation • Decision making 4 elements:")
Why Need Time series design(con’t) Objectives: Forecasting • Simulation • Decision making 4 elements: Trend、 Cycle、 Seasonality、 Irregular fluctuation Figure 8. Trend、 Cycle、 Seasonality、 53

Major classes of Time series design Simple interrupted time series design Equivalent Time-Samples Design Non-equivalent control group design Recurrent institutional cycle design Counterbalanced designs Single case Experimental design Withdrawal design Multiple-baseline design Changing-criterion design 54
 Base line Figure 9 Simple Interrupted")
Simple Interrupted Time Series Design Intervention (Treatment Effect) Base line Figure 9 Simple Interrupted Time Series Design 55

Simple Interrupted Time Series Design p Example: 10. 56
 X")
The Equivalent Time-Samples Design X 1 O X 0 O X 1 (intervention) X 0 (control) Ø selection of X 1 or X 0 should be determined randomly Ø when there is reason to suspect that the experimental intervention produces results that are transient or reversible in character Ø only one participant group (or even just one participant, in N of 1 studies) 57

Time series non-equivalent control group design O 1 O 2 O 3 X O 4 O 5 O 6 O 1 O 2 O 3 O 4 O 5 O 6 Non-equivalent : No random assignment 58
 p Example: 59")
Time series non-equivalent control group design (CON’T) p Example: 59
 12. 60")
Time series non-equivalent control group design (CON’T) 12. 60

Counterbalanced Designs Other names: • rotation experiment • cross-over design • switch-over design p Four naturally-occuring groups (i. e. , Did not randomly select participants from a larger population nor did you randomly assign them to the four groups). p Four different experimental treatments, or variations on the same treatment, to be compared. p Four different occasions, which allows each group to receive all four treatments, but in a different order for each group. 61
 p Example: 62")
Counterbalanced Designs (CON’T) p Example: 62

Single-Case Experimental Designs These are designs where the researcher attempts to demonstrate an experimental treatment effect usingle participants, one at a time. Types of single-case designs: Withdraw design (A-B-A design, A-B-A-B design) Time series with multiple institutions of treatment Time series with intensified treatment Time series withdrawn and reinstituted treatment Multiple-baseline design Changing-criterion design 63
 O 16")
Withdraw design A-B-A time series design A-B-A-B time series design Treatment (B) O 16 O 17 O 18 O 19 O 20 Time series with multiple institutions of treatment O 1 O 2 O 3 X O 4 O 5 O 6 X O 7 O 8 O 9 Time series withdrawn and reinstituted treatment O 1 O 2 X O 3 O 4 (no X) O 5 O 6 X O 7 O 8 Time series with intensified treatment O 1 O 2 X O 3 O 4 X+1 O 5 O 6 X+2 O 7 O 8 64 64

A-B-A time series design B phase or treatment phase A phase or Baseline condition Reinforcement Contingency the second A phase or the return to baseline condition Extinction Figure 13. Walker, H. M. , & Buckley, N. K. The use of positive reinforcement in conditioning attending behavior. Journal of Applied Behavior Analysis, 1968, 1, 245 -250 65

A-B-A-B time series design Contingent Attention Baseline 2 Contingent Attention Baseline Figure 14. Hall, R. V. , et al The teacher as observer and experimenter in the modification of disputing and talking-out behaviors. Journal of Applied Behavior Analysis, 1971, 4, 141 -149. 66
 Features of Withdrawal Designs Primary strategy involves the systematic introduction and")
Withdrawal Designs (con’t) Features of Withdrawal Designs Primary strategy involves the systematic introduction and withdrawal of treatment Experimental control (internal validity) is demonstrated by showing that the target behavior changes as a function of the change in condition (phase change) Particularly well-suited for treatments involving environmental change strategies Not well-suited for treatments that exert an enduring effect Ethical and practical limitations associated with the withdrawal of treatment 67

Multiple-Baseline Design This is a design that investigates two or more people, behaviors, or settings to identify the effect of an experimental treatment The key is that the treatment condition is successively administered to the different people, behaviors, or settings. 68
 69")
Multiple-Baseline Design (con’t) 69
 Example: Table 12. 70")
Multiple-Baseline Design (con’t) Example: Table 12. 70
 6. 17. . 71")
Multiple-Baseline Design (con’t) 6. 17. . 71
 Features of the Multiple Baseline Design Similar in structure to the")
Multiple-Baseline Design (con’t) Features of the Multiple Baseline Design Similar in structure to the controlled case study. Involves the sequential introduction of treatment (phase change) across either multiple subjects, multiple target behaviors (symptoms), or multiple settings. Demonstrates experimental control (internal validity) by showing that the change in the target for each series occurs when the phase change is applied 72
 Features of the Multiple Baseline Design (con’t) The more replications, the")
Multiple-Baseline Design (con’t) Features of the Multiple Baseline Design (con’t) The more replications, the stronger the demonstration of internal validity Requires that each series be independent of the other Not appropriate in cases in which one would expect generalization to occur 73

Changing-Criterion Design The design is used when a behavior needs to be shaped over time or when it is necessary to gradually change a behavior through successive treatment periods to reach a desired criterion. collecting baseline data on the target behavior each intervention phase uses a different criterion of successful performance administering the experimental treatment across a series of intervention phases until the desired criterion is reached. 74
 Figure 18. 75")
Changing-Criterion Design (con’t) Figure 18. 75
 Example: 9. 76")
Changing-Criterion Design (con’t) Example: 9. 76

Changing-Criterion Design Features of the Changing-Criterion Design The criterion of each intervention phase should be large enough to detect a change in behavior but small enough to achieved. 77

Methodological Considerations in Using Single-Case Designs Baseline standard for assessment induced by experiment treatment condition, it must stable the characteristics of stable baseline 1. an absent of trend 2. little variability Changing one variable at a time only one variable can be changed from experimental phase to next 78
 Length of phases agreement dose not exit with")
Methodological Considerations in Using Single-Case Designs(con’t) Length of phases agreement dose not exit with regard to the length of phases Assessment of treatment effect visual inspection baseline data and intervention data do not overlap statistical analysis 1. there is a great deal of variability in data 2. baseline data is not stable 79

Advantage of time series design Uniquely suited for evaluation of treatment for a single case (goodness of fit) Can be used to test treatments of rare disorders that would not lend themselves to traditional group designs Avoids the legal and ethical problems associated withholding treatment (control groups) Well-suited for studying process of change Provides options for practitioners to be researchers 80

Threats to internal validity in Time series design History Maturation Testing Instrumentation – Statistical regression Experimental mortality Selection-maturation interaction (and other interactions) - 81

Threats to external validity in Time series design The hawthorn effects Novelty effects Interaction of history and treatment effects Experimenter effects Measurement effects 82

Thanks for your attention ! 83
- Slides: 83