
Introducing Barry Mein Programme Director 7 September 2016
Introducing Barry Mein Programme Director 7 September 2016
Recent background
Auckland Transport Alignment Project (ATAP) • Set up by Government and Auckland Council in August 2015 • Purpose: to develop an aligned strategic approach for the development of Auckland’s transport system over the next 30 years • Background: disagreement over funding tools and need to get alignment on what needs to be done before discussing how to fund • Multi-agency project across central and local government • Final report expected to be released this month • Some similarities and differences between ATAP and Let’s Get Wellington Moving which are useful to understand
ATAP: test for better return on transport investment Detailed objectives: • Support economic growth and increased productivity by ensuring access to employment/labour improves, relative to current levels, as Auckland’s population grows • Improve congestion results, relative to predicted levels, in particular travel time and reliability, in the peak period and to ensure congestion does not become widespread during working hours • Improve public transport's mode share, relative to predicted results, where it will address congestion • Ensure any increases in the financial costs of using the transport system deliver net benefits to users of the system
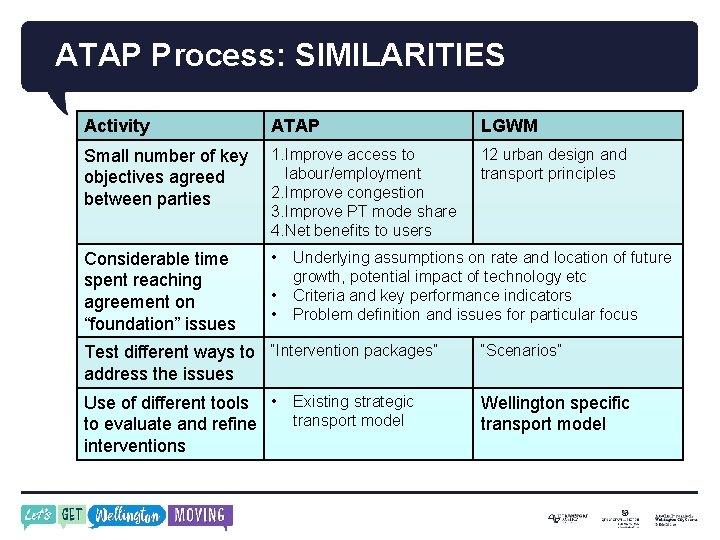
ATAP Process: SIMILARITIES Activity ATAP LGWM Small number of key objectives agreed between parties 1. Improve access to labour/employment 2. Improve congestion 3. Improve PT mode share 4. Net benefits to users 12 urban design and transport principles Considerable time spent reaching agreement on “foundation” issues • • • Underlying assumptions on rate and location of future growth, potential impact of technology etc Criteria and key performance indicators Problem definition and issues for particular focus Test different ways to “Intervention packages” address the issues “Scenarios” Use of different tools • Existing strategic transport model to evaluate and refine interventions Wellington specific transport model
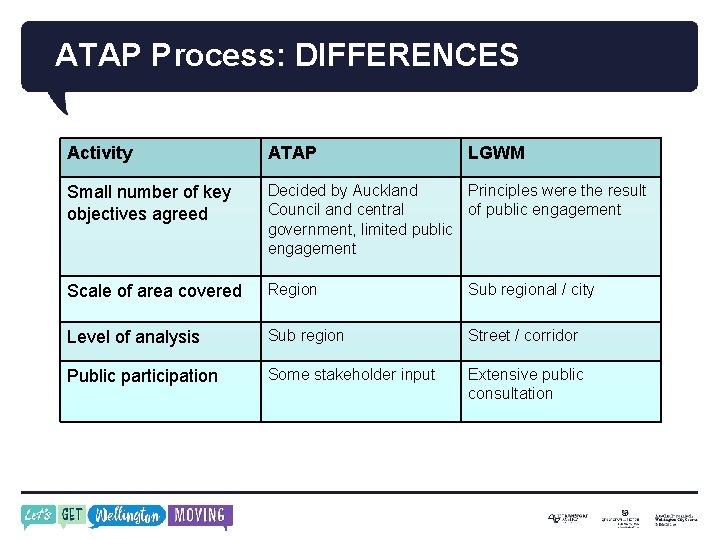
ATAP Process: DIFFERENCES Activity ATAP LGWM Small number of key objectives agreed Decided by Auckland Principles were the result Council and central of public engagement government, limited public engagement Scale of area covered Region Sub regional / city Level of analysis Sub region Street / corridor Public participation Some stakeholder input Extensive public consultation
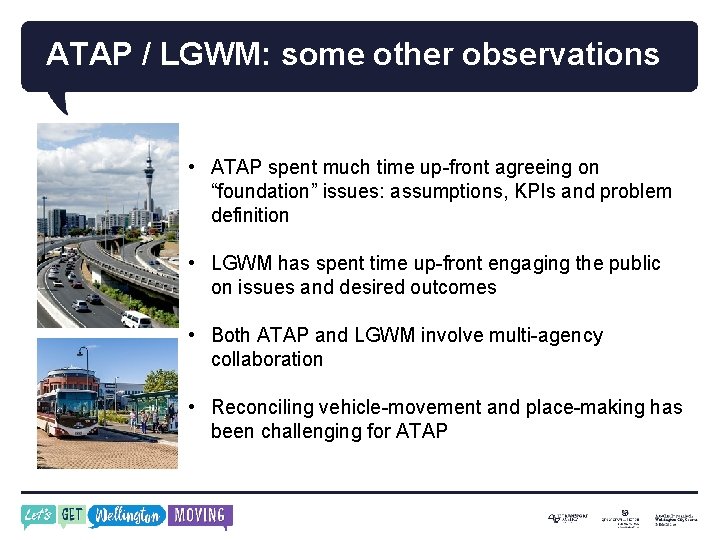
ATAP / LGWM: some other observations • ATAP spent much time up-front agreeing on “foundation” issues: assumptions, KPIs and problem definition • LGWM has spent time up-front engaging the public on issues and desired outcomes • Both ATAP and LGWM involve multi-agency collaboration • Reconciling vehicle-movement and place-making has been challenging for ATAP
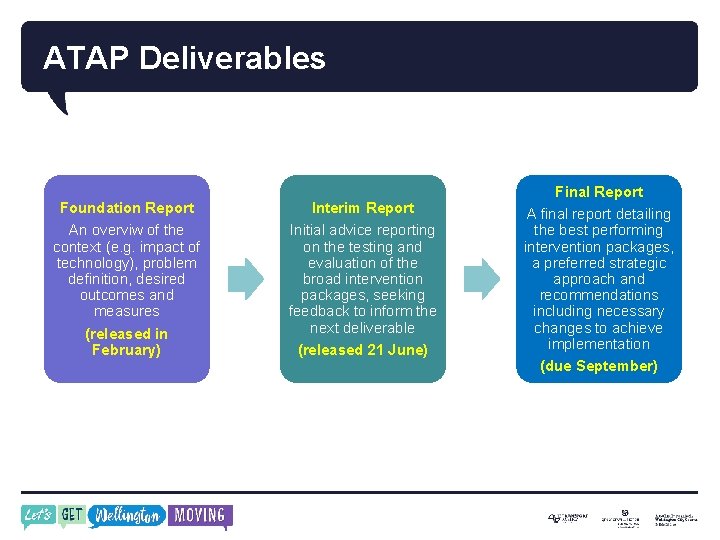
ATAP Deliverables Foundation Report An overviw of the context (e. g. impact of technology), problem definition, desired outcomes and measures (released in February) Interim Report Initial advice reporting on the testing and evaluation of the broad intervention packages, seeking feedback to inform the next deliverable (released 21 June) Final Report A final report detailing the best performing intervention packages, a preferred strategic approach and recommendations including necessary changes to achieve implementation (due September)
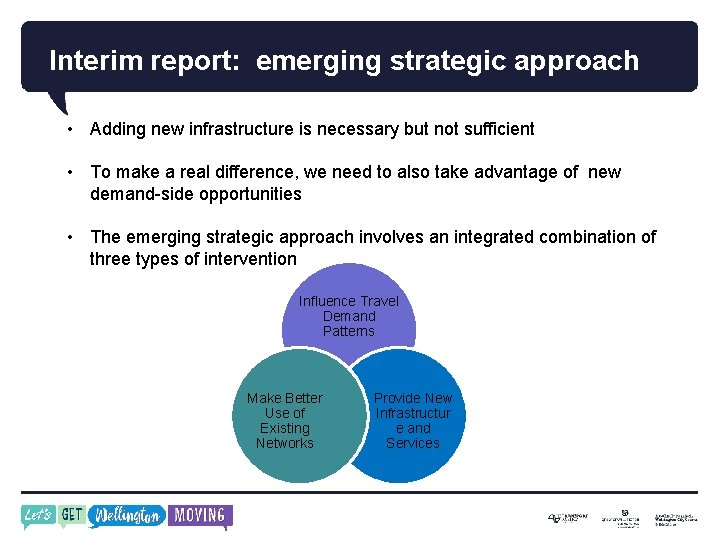
Interim report: emerging strategic approach • Adding new infrastructure is necessary but not sufficient • To make a real difference, we need to also take advantage of new demand-side opportunities • The emerging strategic approach involves an integrated combination of three types of intervention Influence Travel Demand Patterns Make Better Use of Existing Networks Provide New Infrastructur e and Services
QUESTIONS? info@getwellymoving. co. nz
Generating Criteria from Principles 7 September 2016
Considerations • Principles have been the result of wide engagement • Principles must be visible in the criteria • Principles and criteria will be used for the life of the programme and beyond • A number of criteria and indicators are already used by the partners, WCC, GWRC and NZ Transport Agency and these will be included where it makes sense • Criteria will help develop and assess scenarios
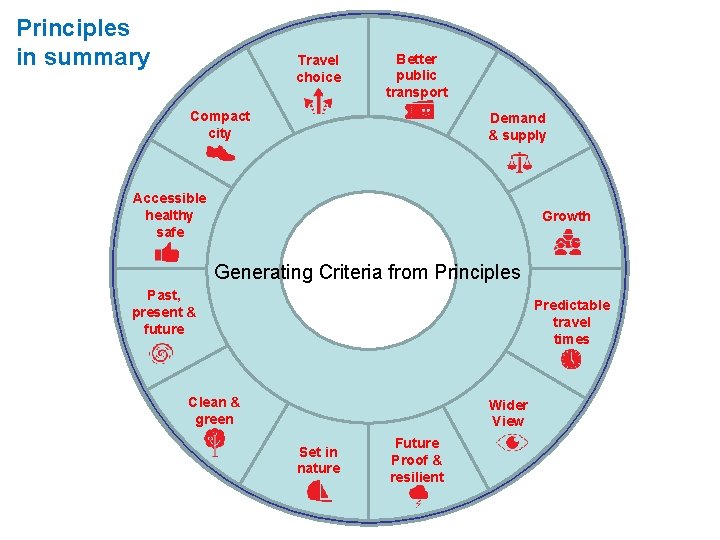
Principles in summary Travel choice Better public transport Compact city Demand & supply Accessible healthy safe Growth Generating Criteria from Principles Past, present & future Predictable travel times Clean & green Wider View Set in nature Future Proof & resilient
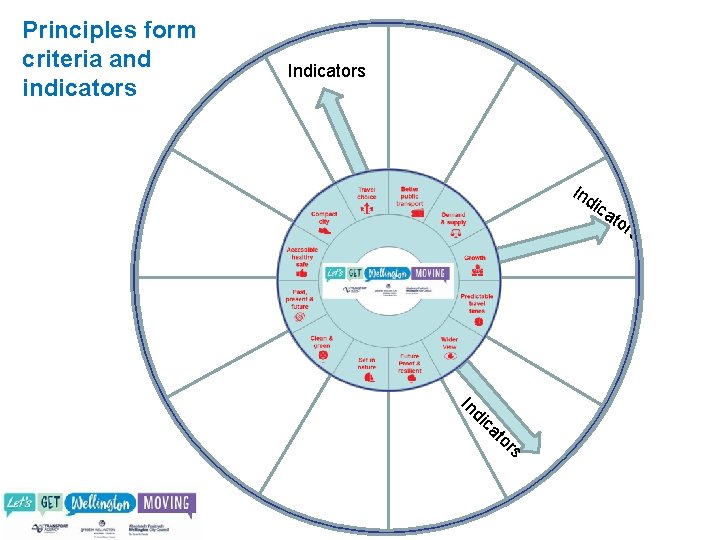
Principles form criteria and indicators Ind ica tor In d ic a to rs s
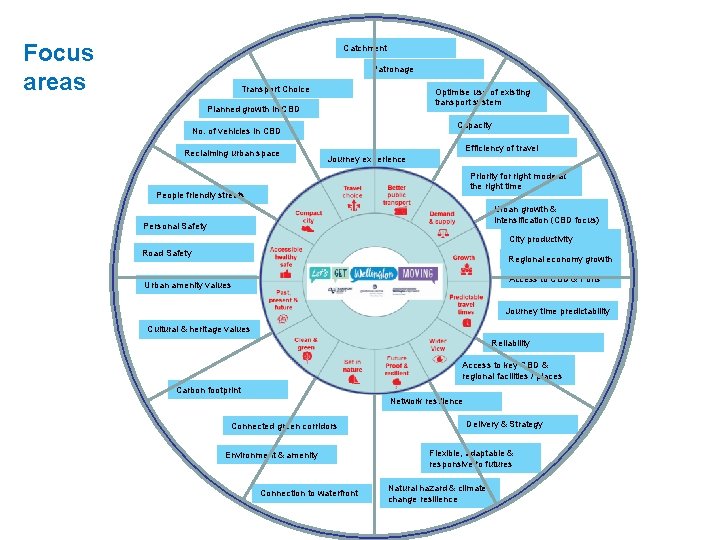
Focus areas Catchment Patronage Transport Choice Optimise use of existing transport system Planned growth in CBD Capacity No. of vehicles in CBD Reclaiming urban space Efficiency of travel Journey experience Priority for right mode at the right time People friendly streets Urban growth & intensification (CBD focus) Personal Safety City productivity Road Safety Regional economy growth Access to CBD & Ports Urban amenity values Journey time predictability Cultural & heritage values Reliability Access to key CBD & regional facilities / places Carbon footprint Network resilience Connected green corridors Environment & amenity Connection to waterfront Delivery & Strategy Flexible, adaptable & responsive to futures Natural hazard & climate change resilience
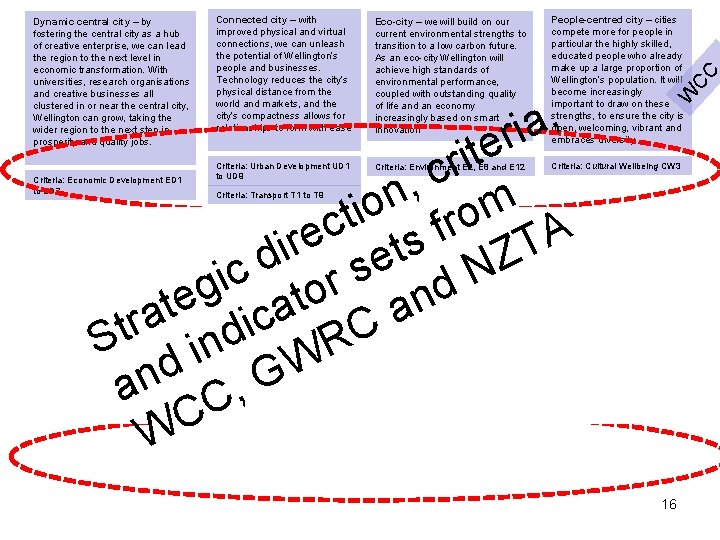
Connected city – with improved physical and virtual connections, we can unleash the potential of Wellington’s people and businesses. Technology reduces the city’s physical distance from the world and markets, and the city’s compactness allows for relationships to form with ease Eco-city – we will build on our current environmental strengths to transition to a low carbon future. As an eco-city Wellington will achieve high standards of environmental performance, coupled with outstanding quality of life and an economy increasingly based on smart innovation People-centred city – cities compete more for people in particular the highly skilled, educated people who already make up a large proportion of Wellington’s population. It will become increasingly important to draw on these strengths, to ensure the city is open, welcoming, vibrant and embraces diversity Criteria: Urban Development UD 1 to UD 9 Criteria: Environment E 2, E 8 and E 12 Criteria: Cultural Wellbeing CW 3 , a i er t i r c , n o m i t o r c f A e r s T i t Z d e s N c i r d g o t n e t a a a c r i St ind WRC d n G a , C C W Criteria: Economic Development ED 1 to ED 7 Criteria: Transport T 1 to T 9 Strong Economy A thriving and diverse economy supported by high quality infrastructure that retains and grows businesses and employment Connected Community People are able to move around the region efficiently and communications networks are effective and accessible Resilient Community A regional community that plans for the future, adapts to climate change and is prepared for emergencies Healthy Environment An environment with clean air, fresh water, healthy soils and diverse ecosystems that supports community needs Engaged Community People participate in shaping the regions' future, take pride in the region, value the region’s urban and rural landscapes, and enjoy the region’s amenities Criteria: Prosperous Community PC 001, PC 003, PC 007 Criteria: Connected CC 001 to CC 007 Criteria: RLTP IRTN 01, 02, 03 Criteria: HE 001, HE 002, HE 004, HE 014 to HE 016 Criteria: Healthy HC 003, HC 004 Criteria: RLTP EOTSEnv 01 to 04 RLTP Safer 01 to 03 Criteria: Sense of Place SP 001, SP 003 to SP 005 Quality Lifestyle QL 008, QL 011 Criteria: Strong & Tolerant ST 008 Criteria: Regional Foundations RF 003, RF 004 RLTP WPCITN 01 to 07 Network performance & capability Cost Safety Health Criteria: Throughput Criteria: Financial cost of using transport Criteria: Reduce DSI Criteria: Pollution Criteria: Infrastructure safety Criteria: Noise Criteria: Reliability Criteria: Travel time Criteria: Availability & access Criteria: customer experience W CC Dynamic central city – by fostering the central city as a hub of creative enterprise, we can lead the region to the next level in economic transformation. With universities, research organisations and creative businesses all clustered in or near the central city, Wellington can grow, taking the wider region to the next step in prosperity and quality jobs. Criteria: Pricing efficiency C R W G y c en Ag 16
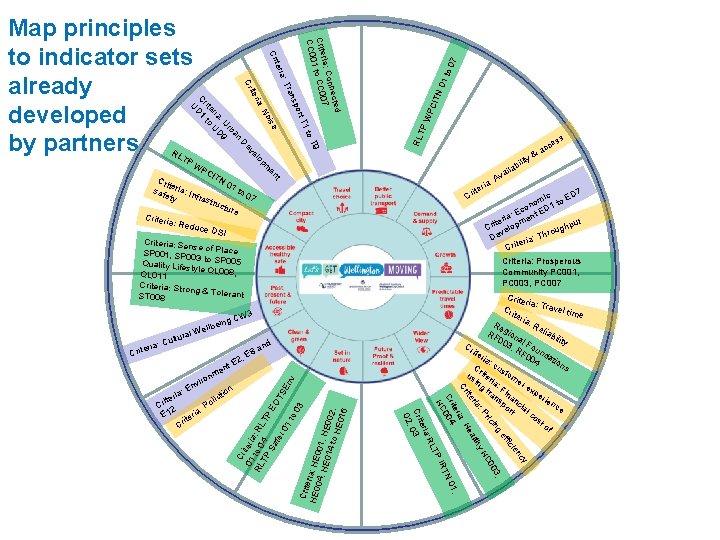
9 07 1 to N 0 CIT WP TP RL to T d an 2 L ia: R ter Cri 03 02, Crit e HE 0 ria: HE 0 04, HE 0 01, HE 0 14 t o H 02, E 01 6 Criter ia: Tr avel t Cr ime ite ria : R Re elia RF gion bili 00 al F ty 3, Cr o u RF ite n 00 dat ria ion 4 Cr : cus s i t o us ter in ia: mer g ex tra Fin pe ns an rie po cia nc e rt l c os to f cy ien fic ef , ing 03 ric C 0 : P y. H lth ria ea ite H Cr ia: r 1, ite Cr 04 N 0 0 IRT HC TP n : tio ria llu ite o r C 2 : P ria E 1 ir te C D 7 mic to E o on ED 1 Ec a: ent i r t m te hpu Cri velop roug h e T D : eria Criteria: Prosperous Community PC 001, PC 003, PC 007 3 8 , E c &a ia ter i Cr Cr 01 iteria RL to 0 : RL TP 4 TP Sa EO fer TS 01 En v to 03 n iro v En t t. E n me en C v : A ity bil a ail m lbe Wel ss ce op el ev ural cted onne ria: C C 007 Crite C 01 to CC 0 e ois : N D CW ing Cult 1 rt T spo ria ite WP CI TN Crit 01 eria to safe : 07 ty Infras truc ture Criteria : Redu ce DS I Criteria: Se nse of Place SP 001, SP 0 03 to SP 005 Quality Life style QL 008 , QL 011 Criteria: Str ong & Tolera nt ST 008 ia: riter ran Cr an rb : U 9 ia UD er rit to C D 1 U RL TP a: T teri Cri Map principles to indicator sets already developed by partners
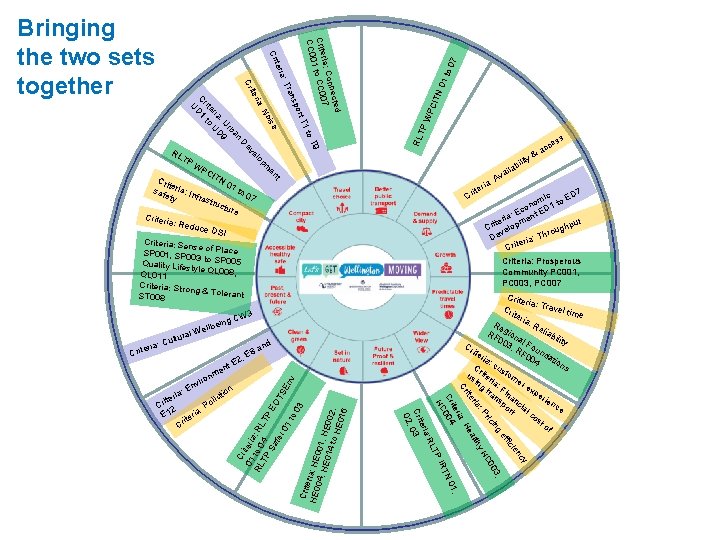
9 07 1 to N 0 CIT WP TP RL to T d an 2 L ia: R ter Cri 03 02, Crit e HE 0 ria: HE 0 04, HE 0 01, HE 0 14 t o H 02, E 01 6 Criter ia: Tr avel t Cr ime ite ria : R Re elia RF gion bili 00 al F ty 3, Cr o u RF ite n 00 dat ria ion 4 Cr : cus s i t o us ter in ia: mer g ex tra Fin pe ns an rie po cia nc e rt l c os to f cy ien fic ef , ing 03 ric C 0 : P y. H lth ria ea ite H Cr ia: r 1, ite Cr 04 N 0 0 IRT HC TP n : tio ria llu ite o r C 2 : P ria E 1 ir te C D 7 mic to E o on ED 1 Ec a: ent i r t m te hpu Cri velop roug h e T D : eria Criteria: Prosperous Community PC 001, PC 003, PC 007 3 8 , E c &a ia ter i Cr Cr 01 iteria RL to 0 : RL TP 4 TP Sa EO fer TS 01 En v to 03 n iro v En cted onne ria: C C 007 Crite C 01 to CC 0 t. E n me t C en ural Cult v : A ity bil a ail m CW ing lbe Wel ss ce op el ev WP CI TN Crit 01 eria to safe : 07 ty Infras truc ture Criteria : Redu ce DS I Criteria: Se nse of Place SP 001, SP 0 03 to SP 005 Quality Life style QL 008 , QL 011 Criteria: Str ong & Tolera nt ST 008 ia: riter 1 rt T spo e ois D RL TP : N an rb : U 9 ia UD er rit to C D 1 U ria ite ran Cr a: T teri Cri Bringing the two sets together
Bringing the two sets together Catchment Patronage Transport Choice Optimise use of existing transport system Planned growth in CBD Capacity No. of vehicles in CBD Reclaiming urban space Efficiency of travel Journey experience Priority for right mode at the right time People friendly streets Urban growth & intensification (CBD focus) Personal Safety City productivity Road Safety Regional economy growth Access to CBD & Ports Urban amenity values Journey time predictability Cultural & heritage values Reliability Access to key CBD & regional facilities / places Carbon footprint Network resilience Connected green corridors Environment & amenity Connection to waterfront Delivery & Strategy Flexible, adaptable & responsive to futures Natural hazard & climate change resilience
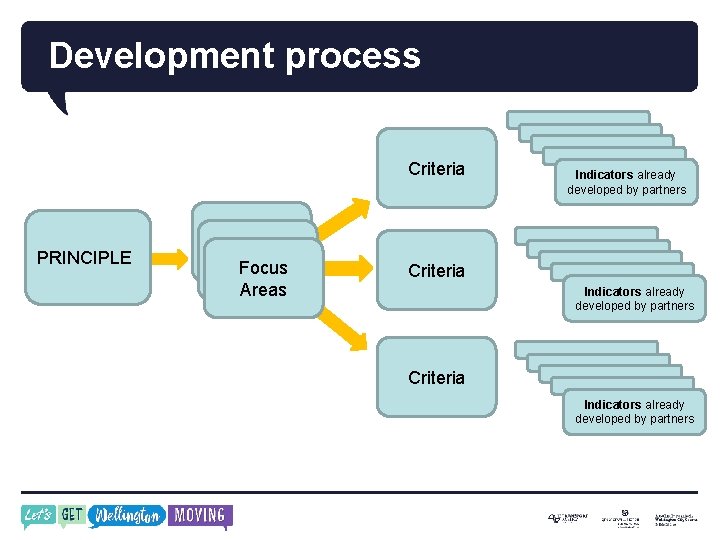
Development process Criteria PRINCIPLE Growth words Focus words Areas Indicators already developed by partners Criteria Indicators already developed by partners
Scenario analysis • ‘Qualitative’ judgement focus applicable when several scenarios / options to choose between • Multi-criteria analysis commonly used in assessments of scenarios / options for major infrastructure • MCA is just one of the inputs to select the preferred scenario
Next steps Using a number of mechanisms and participants: • Finalise criteria • Communicate the criteria to the community • Continuing developing scenarios • Test scenarios against criteria • Share results of scenario testing publically in New Year

CONTACT info@getwellymoving. co. nz
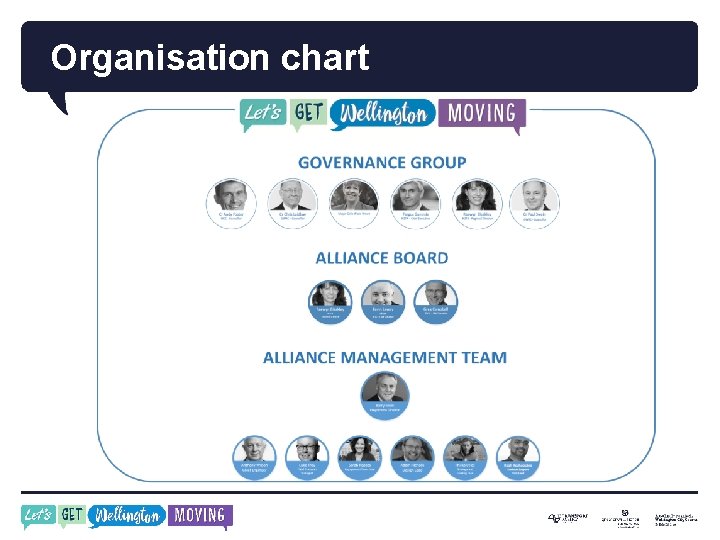
Organisation chart
- Slides: 24