Intro to Market Profile for the Day Trader


 • The Market Profile concept first appeared in")


 – http: //coxintl. com/xsprofits/presentations/Pivot%20 Points%20 Presentation%20")

- Slides: 43
Intro to Market Profile for the Day Trader Presented to OC Traders June 2, 2012 by Ray De Golia
• Your job as a trend trader is to locate the start of a directional move (trend) and to stay with it until you detect the congestion (nondirectional balancing) that signals end of trend. • If you are a congestion trader you want to sell tops of balances and buy balance bottoms.
• Your job as a trend trader is to locate the start of a directional move (trend) and to stay with it until you detect the congestion (non-directional balancing) that signals end of trend. • If you are a congestion trader you want to sell tops of balances and buy balance bottoms.
History of the Market Profile (tm) • The Market Profile concept first appeared in the CBOT Market Profile Manual (1985) and in 1986 in the book 'Markets and Market Logic', by J. Peter Steidlmayer and Kevin Koy. • Steidlmayer was a successful floor member at the Chicago Board of Trade (CBOT); Koy was a trader and a journalist. Their book created a completely new way of reading markets. For the first time, the public trader could measure value and the intentions of the participants (exchange members and the public). • These concepts provide the day-trader with an unparalleled depth of market understanding.
These books are considered the bible of the Market Profile concept.
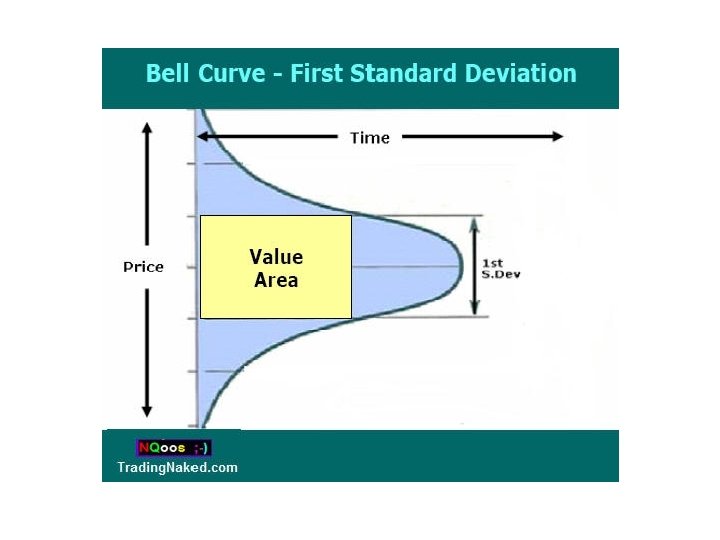
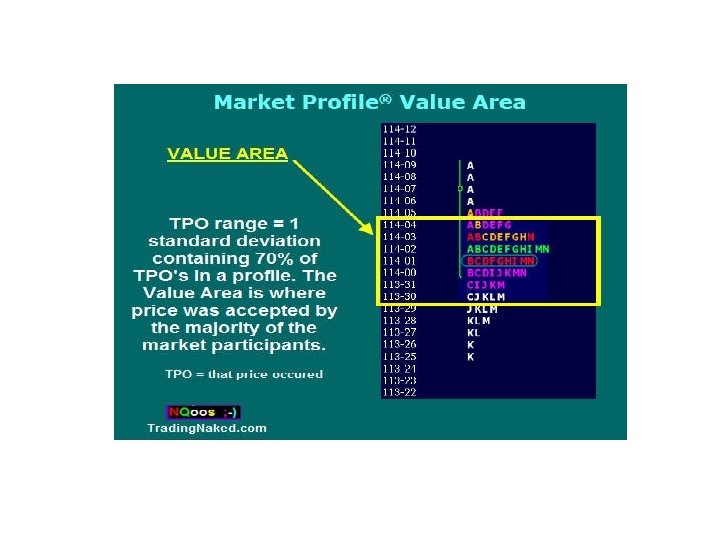
Market Profile Key Terms • Value area - price range in which approximately 70% of the market volume took place. • • • Value high Value low Point of control (POC) Initial balance Range extension -
Market Profile Key Terms • Value area - price range in which approximately 70% of the market volume took place. • Value high - the upper pivot of the value area • Value low - the lower pivot of the value area • Point of control (POC) • Initial balance • Range extension -
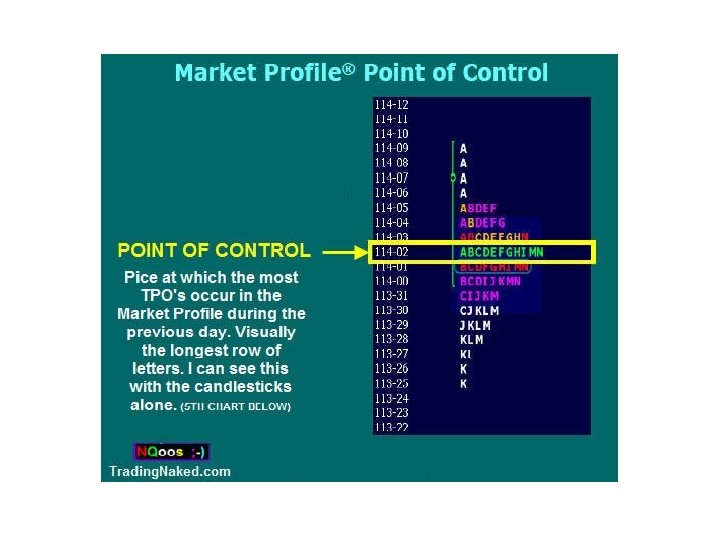
Market Profile Key Terms • Value area - price range in which approximately 70% of the market volume took place. • Value high - the upper pivot of the value area • Value low - the lower pivot of the value area • Point of control (POC) - price level of most volume. POC indicates an area of greatest market activity • Initial balance • Range extension -
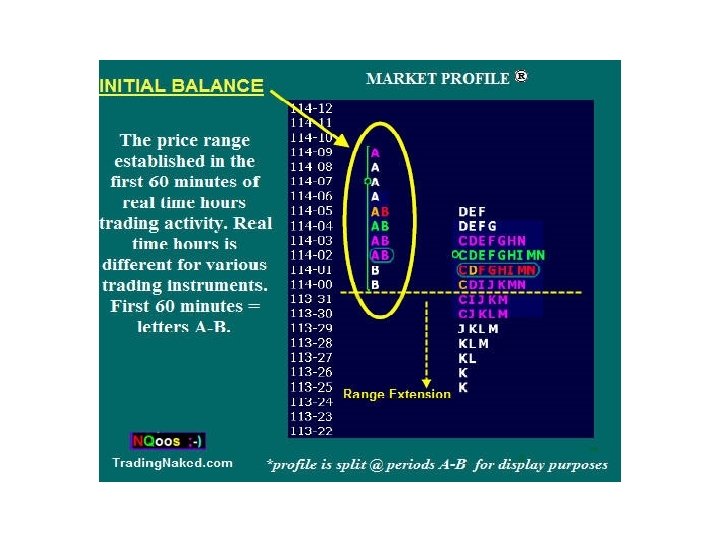
Market Profile Key Terms • Value area - price range in which approximately 70% of the market volume took place. • Value high - the upper pivot of the value area • Value low - the lower pivot of the value area • Point of control (POC) - price level of most volume. POC indicates an area of greatest market activity • Initial balance - market activity in the first hour of Regular Trading. The letters “A” & “B” on the next chart • Range extension -
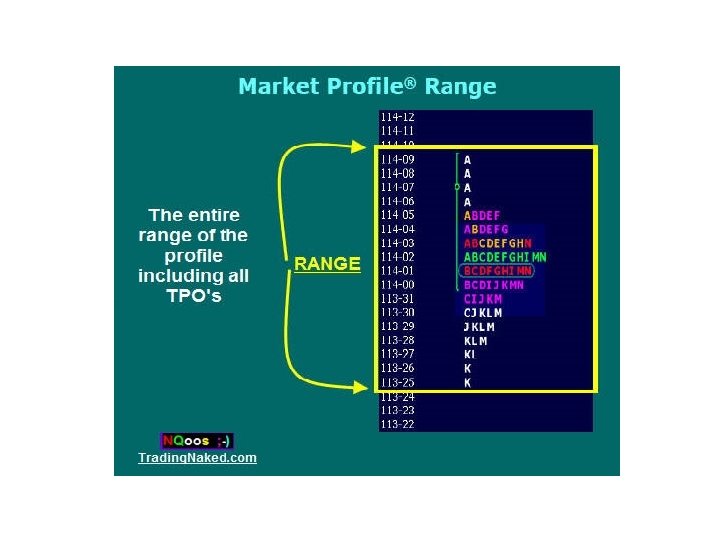
Market Profile Key Terms • Value area - price range in which approximately 70% of the market volume took place. • Value high - the upper pivot of the value area • Value low - the lower pivot of the value area • Point of control (POC) - price level of most volume. POC indicates an area of greatest market activity • Initial balance - - market activity in the first hour of Regular Trading. • Range - market activity from high to low for the current time period.
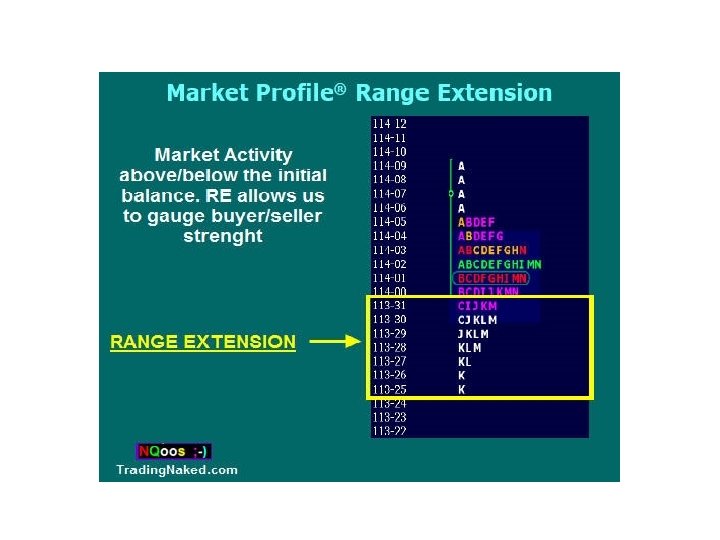
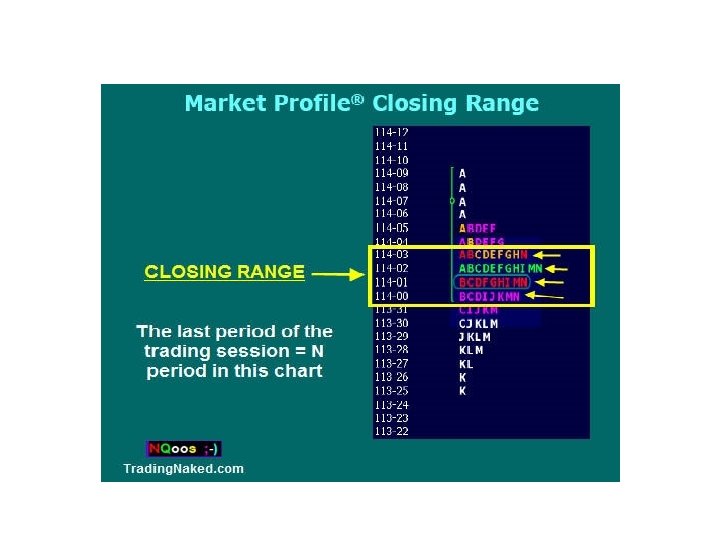
More Key Terms • Range extension - price action extending beyond the initial balance • TPO -stands for Time Price Opportunity. Letters are used to build the market profile structure. Each letter represents a half hour period. The letter is also known as the TPO. • Single print buying tails • Single print selling tails – • Closing Range
More Key Terms • Range extension - price action extending beyond the initial balance • TPO -stands for Time Price Opportunity. Letters are used to build the market profile structure. Each TPO letter represents a half hour period. • Single print buying tails • Single print selling tails • Closing Range -
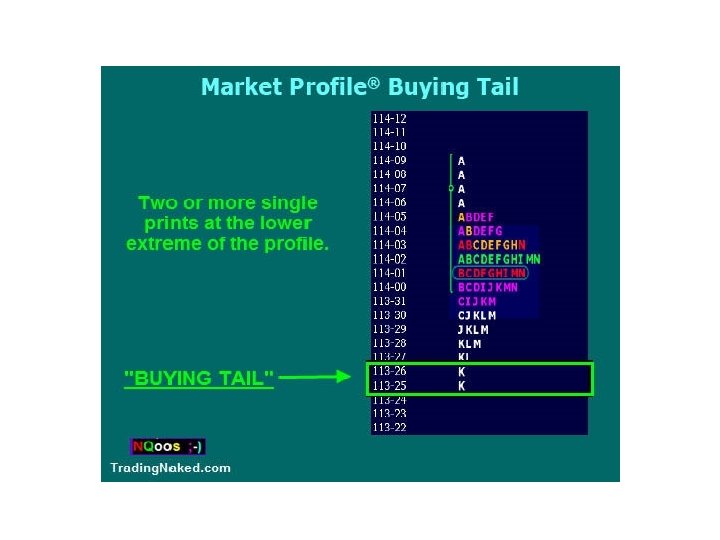
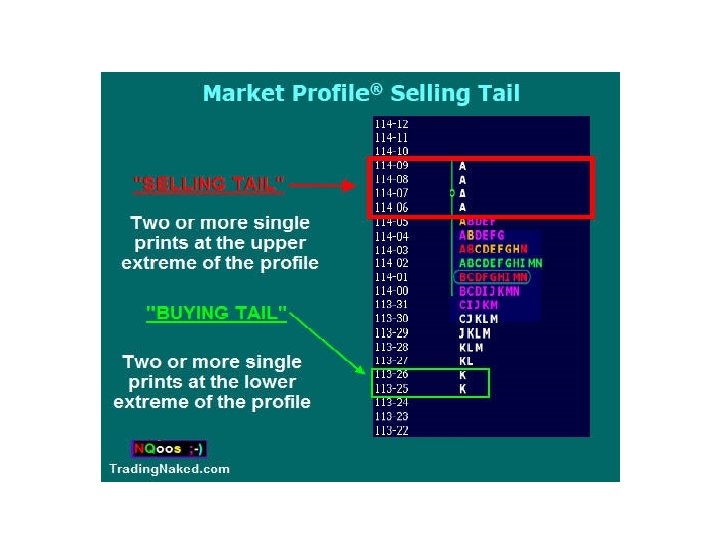
More Key Terms • Range extension - price action extending beyond the initial balance • TPO -stands for Time Price Opportunity. Letters are used to build the market profile structure. Each letter represents a half hour period. The letter is also known as the TPO. • Single print buying tails - any single print TPO's at the lower extreme of the profile • Single print selling tails -any single print TPO's at the upper extreme of the profile • Closing Range
More Key Terms • Range extension - price action extending beyond the initial balance • TPO -stands for Time Price Opportunity. Letters are used to build the market profile structure. Each letter represents a half hour period. The letter is also known as the TPO. • Single print buying tails - any single print TPO's at the lower extreme of the profile • Single print selling tails -any single print TPO's at the upper extreme of the profile • Closing Range – The Last period of the Trading Session. The letter “N” on the next chart.
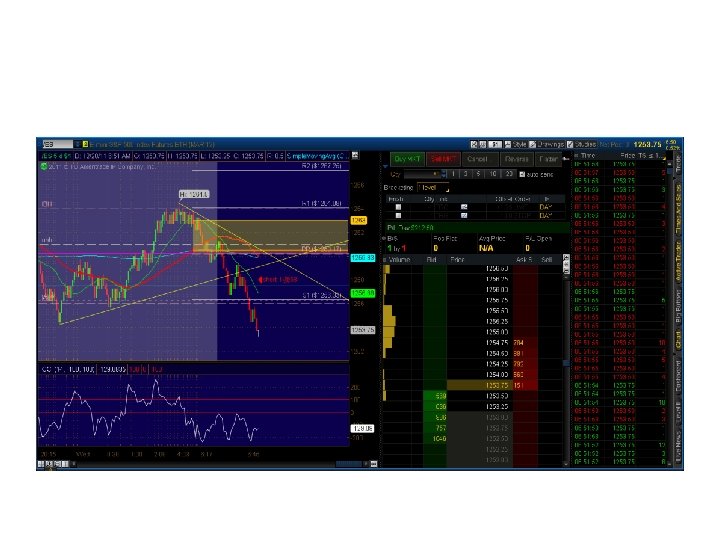
Candle overlay
Market Profile and Pivot Points
What are Pivot Points? • “Potentially” key support and resistance levels • Available on Shadow Trader and Prophet Charts (and other places too) • Base pivot calculated by High + Low + Close ÷ 3 of prior period time frame • Support 1, 2, 3 and Resistance 1, 2, 3 levels are calculated off of the base pivot level • Available on multiple time frames: Daily, Weekly and Monthly > often coincide with Fibonacci Levels
Market Profile and Pivot Points
PIVOTS • Are simple mathematical formulas based on previous day High, Low, Close data. • Futures use 24 -HOUR DATA from the PREVIOUS DAY. • Use a pivot point calculator found online to calculate three Support and three Resistance Levels (S 1, S 2, S 3 & R 1, R 2, R 3) • or get the Pivot Levels from Shadow. Trader.
www. mypivots. com/investmentcalculators/pivot-point-calculator
Pivots are: • Commonly known as floor trader pivots, they are: – A simple, effective entry/exit technique – Typically used on ES, YM NQ, TF – They also work with DIA, SPY, QQQ, IWM
Main Advantage • Price Based as opposed to Indicator based • Entry can be determined BEFORE the market opens • Can be used to get into a trade before a “buy/sell” signals are generated by stochastic or oscillator type indicators. – Especially true on choppy days
Other advantages • Can be used to determine the type of trading day it is going to be on – TRENDING DAYS- price will move to the pivot, hang there a while, then move thru it – CHOPPY DAYS – price moves to pivot, then hangs around, and then drifts back to where it came from.
Limitations on Market Profile • 1. The primary condition for a valid profile is a normal, equilibrium distribution. – If the market is not in equilibrium there is no valid POC or standard deviation. – A simple visual examination will often be enough to certify that the distribution is abnormal: – the day may have two distributions (two peaks) or the trading may be directional, etc.
2. Even in overall equilibrium markets • there can be days in which the market prices jump out of bounds (false breakouts) and then return later in the day or the next day. • A single day's Profile does not provide a reliable measure of market condition. • Research indicates that a three day measure is the minimum preferred.
3. Markets have changed since 1985/1991. • Pits are approaching extinction. In 1985 and earlier, trading by members in the pits was by open outcry; commercial traders were in view and the 'trade' dominated the markets. Today (2011) there are few pits and public traders dominate the trading volume. Certainly, an intelligent and alert trader like Steidlmayer in the pit had much more to go on than just the Profile graphic available today.
• Plot them on your chart • Begin at 5: 30 a. m. as that is when the first government reports come out and I am prepared to trade sooo early in the morn.
1 • Note where Daily Pivot Point is in relation to previous Days CLOSING PRICE (Settlement) • Next, watch where the OPEN is today (9: 30 ET) • How far away from the Pivot Point. • 90% of time price will test the previous pivot during the day.
Trend & Chop
Sources • The Chicago Board of Trade book store stocks the text 'CBOT Market Profile' (parts 1 -6). • Steidlmayer's revised 'Steidlmayer on Markets', is available from Wiley. • Currently the Chicago Mercantile Exchange offers Market Profile training courses by Dan Gramza
References • Pivot Point Presentation, Doug Allen (4/20/08) – http: //coxintl. com/xsprofits/presentations/Pivot%20 Points%20 Presentation%20 Power. Point. ppt • Market Profile Handbook - CME Group – www. cmegroup. com/education/. . . /marketprofile/handbook. pdf • Shadowtrader. net – http: //shadowtrader. net/archives-main/education/ • http: //www. tradingnaked. com/Market. Profile. ILLUSTRATIONS. htm#vah%20 val%20 va%2 0 poc%20 dval%20 dvah%20 dva%20 dpoc%20 naked%20 poc
the end