Intro Jan Ask Away Brandon ask ON Jan

• Intro - Jan • Ask. Away – Brandon • ask. ON – Jan • Conclusion – Jan • Q&A – you!
![[http: //www. slideshare. net/webbmedia/key-performance-indicator-for-libraries-presentation]](http://slidetodoc.com/presentation_image/6cde80bc90faa2be020d9297904544bc/image-4.jpg "[http: //www. slideshare. net/webbmedia/key-performance-indicator-for-libraries-presentation]")
[http: //www. slideshare. net/webbmedia/key-performance-indicator-for-libraries-presentation]

Performance Metrics and Value Indicators • Everything is based on user needs. Start with metrics that demonstrate satisfaction of user needs. Photo By Amanda Etches

• Pearl-grow your metrics and keep developing them. • Link them to tell the bigger story and the value • More than proving value: Ø Optimize workflow Ø Engages VR community: partners, staff, & visitors

Brandon Weigel, Ask. Away Coordinator brandonw@eln. bc. ca

Ask. Away Background 8 Launched in 2006 as public/post-secondary collaborative service Became post-secondary only in 2010 30 post-secondary libraries across BC Collaboratively staffed by all partners 7 days a week 67 service hours per week 39 weeks per year 235 staff hours per week 3 -5 staff per shift

Funding – Today 9 Formerly funded by BCcampus – until it dried up Now transitioning to being fully participant-funded Result: ever-greater need to prove value!

10

Why do we measure? 11 To prove our value… but what constitutes “value”?

Value – Libraries’ perspective: 12 Getting a return on investment: Students are using the service Service provided is high quality Professional development for staff Worth the time and resources put into it

Value – Consortial perspective 13 Provide consistent, quality service Limit wait times and costs with appropriate staffing levels Improvements to cost, staff resources, and overall service by working collaboratively

Value – Patrons’ perspective 14 Contributes to learning and information literacy Connects researchers with information they need Leaves patrons satisfied and willing to come back
 Question form fields Transcripts Patron exit surveys")
Tools for measuring 15 Usage statistics (traffic) Question form fields Transcripts Patron exit surveys Library commitments and cost data Institution data

Usage Stats/Traffic 16 Counts of all chat sessions: Initiated by patrons, per patron library Total handled by each library Number of own patrons handled, per library Number of other libraries’ patrons handled, per library The most commonly-used measure… And the most problematic

17

Usage Stats/Traffic: Uses 18 What it’s good for: Indicates patron awareness of the service Measuring effect of promotional activities or website changes Red flag for technical problems What it’s not good for: Measuring value!

Usage Stats/Traffic: Mis-uses 19 Assessment on service value “Return on investment” “If they’re not using it, they don’t need it” Comparisons with other institutions “We’re using it less, so we should pay less” Says nothing about quality of interaction, type of question, student outcomes

Usage Stats/Traffic: Value 20 Why is usage a poor indicator of value? No correlation between usage and patron value indicators Usage primarily correlates with: Visibility on library website Promotional activities

Usage Stats: Visibility Examples 21 # of sessions from this institution's patrons 80 70 60 Qwidget added to EBSCO search results 50 40 Spring Summer Fall 30 20 10 0 2008 2009 2010 2011 2012 2013

Usage Stats: Visibility Examples 22 # of sessions from this institution's patrons 500 450 400 350 Website redesign cuts Qwidgets and links 300 250 200 Spring Summer Fall 150 100 50 0 2008 2009 2010 2011 2012 2013

Usage Stats: Visibility Examples 23 # of sessions from this institution's patrons 3500 3000 2500 Discover y Layer launche d Qwidget added to Discovery Layer search results Spring 2000 Summer 1500 1000 500 0 Fall

Usage Stats/Traffic 24 Takeaway: Usage is under your control! (So it can’t tell you much about value. )

25

Question Form Fields 26 Detailed data about individual questions Key fields: Timestamp Patron’s institution Referring URL Session length Wait time Resolution code Descriptive codes

27

Form Fields: Uses 28 What it’s good for: Identifying and tracking problems Estimate the depth of the questions Find referral hotspots Top referrers: database search results, research guides, catalogue, database lists, discovery layer results… Essentially, pages where people are actively researching Determine staffing needs for each shift
 - Spring 2014 Form Fields: Uses 0. 0")
Calls per Staff per Shift (average) - Spring 2014 Form Fields: Uses 0. 0 0. 5 1. 0 1. 5 2. 0 2. 5 3. 0 3. 5 4. 0 H: mm: ss tt 29 H: mm: ss tt Monday Tuesday H: mm: ss tt Wednesday Thursday H: mm: ss tt H: mm: ss tt Friday Saturday Sunday

Form Fields: Uses 30 Descriptive Codes: added by librarian postchat Used to identify the type(s) of question Core codes: research, ready reference, directional, citation, technical, e-resource access, prank Plus 16 additional codes Useful for: Debunking myths! (And demonstrating value)

31

Form Fields: Cautions 32 Good data, but incomplete: Descriptive codes not always applied by busy librarians Currently, 70% rate of applying codes (not bad) Not much user-submitted information captured Difficult to read – which discourages use

33 Form Fields: What I wish we could do Compare data with other reference venues Collect more data! Get more people using it

Transcripts 34 Useful for: Examining problematic interactions Examples for training Potentially excellent for measuring service quality (But we don’t do that)

Transcripts: Cautions 35 Strong potential, but untapped 26/27 polled libraries do not use transcripts for staff evaluation General sense: “It’s creepy” Sense of being watched could hurt staff support Comparisons harm collaboration Result: Opinions on quality are based on feelings, not on data

Transcripts: In an ideal world… 36 The impossible dream: Consistent reference standards, with library buy-in Non-invasive transcript analysis (impossible? ) Work with coordinators to apply those standards More realistic: Annual anonymized random sample analysis

Exit Survey 37 Began in 2008 to measure patron satisfaction, and to collect qualitative data and useful quotes Rewritten in 2013 to measure learning outcomes

Exit Survey: What it tells us 38 How they discovered Ask. Away Why they’re using Ask. Away Satisfaction level Likelihood of returning What could be improved Learning outcomes Demographic info General comments

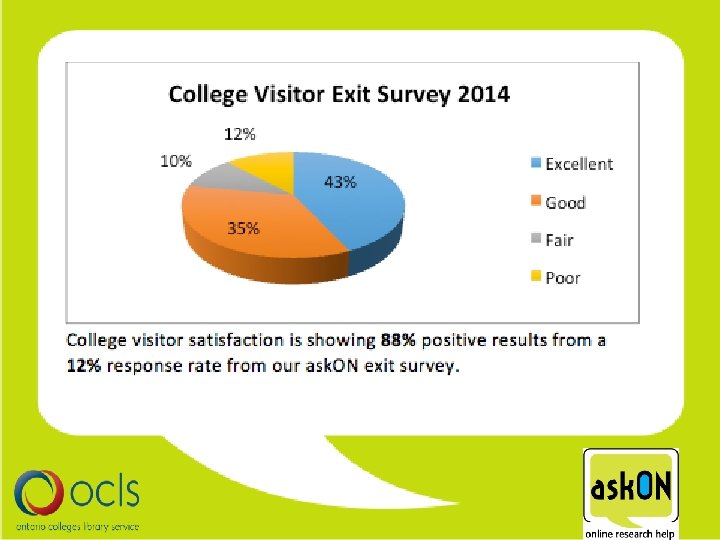
Exit Survey: Why it’s useful 39 Satisfaction level: rough measure of service quality 2014: 90% high satisfaction; 93% likely to return Demographics: Tells us who our patrons really are, and how different groups use Ask. Away

“Super fantastic help. Friendly, positive and informative. Exactly what I needed and didn't take much longer than a phone call. Thank you!” - TRU grad student “I was astounded at the ease with which the librarian found a specific paper for me, based on an incomplete name, an erroneous date, and context. This is a great service!” - UBC Faculty

Satisfaction vs. # of learning outcomes 100% 90% 42 80% 70% % satisfaction 60% 50% 40% 30% 20% 10% 0% No Change 1 2 3 4 Number of learning outcomes 5 "Thank you so much for your help once again. I really appreciate how you 'teach' us students strategies to use rather than just giving us the answer. Proves to be really effective in my learning!” - UFV Student

er O th t en o de m em tis dv er Pr in ta -c la ss In or af f st ru ct In st ry Li br a s tu de nt (s ) si te w eb er s O th ar y Li br How did you find out that Ask. Away was available? 90% 43 80% 70% 60% 50% 40% 30% 20% 10% 0%

44

45 Exit Survey: What I wish we could do Link survey responses to transcripts Improve response rates: Send dialog box to user when closing browser window Other ways? ? Post monthly survey analyses, not just tables

46 Inputs and Outputs: Return on Investment NOT ABOUT HOW MANY CHATS YOU GET Inputs vs. Outputs Staffing: Commitment hours per week: 3 to 34 (based on size) Majority contribute 3 or 5 hours weekly Return on investment: 235 staff hours per week 510% to 6830% return on staff time PLUS extended reference hours

47 Inputs and Outputs: Return on Investment – Financial Cost (including all staffing and ROI with support fees) Ask. Away Cost savings with Ask. Away Average per library Whole sector $10, 000 $308, 000 Go it alone (235 staff-hours/ week, part-time coordinator) Per library Whole sector 500% to $335, 000 7, 000% $10, 062, 000 83% to 99% 3170% 97% Go it alone - barebones service (67 staff-hours/week, minimal coordination) Per library Whole sector $98, 000 74% to 1958% 43% to 95% $2, 939, 000 855% 90%

48

What I wish we could measure 49 Larger student impact Assignment scores Long-term learning Reasons people don’t use Ask. Away Overall awareness of the service Quality of chats Librarian performance

Takeaways 50 The easiest tool to use is rarely the best for the job Choose metrics that tell you want to know Modify your tools to fit the problem Usage is under your control Think broadly about the investment

Stuff we measure: ask. ON’s performance metrics & value indicators Jan Dawson, ask. ON PM
 chat reference tool")
What is ask. ON chat? • secure, private, instant messaging (IM) chat reference tool • accessed via websites of Ontario partner libraries • connects visitors, one-on-one, with LIVE library staff • research skill & literacy building tool…NOT just an “answer” line • builds relationships with and between libraries (collaborative model) • opportunity for professional staff development • offers another channel of accessibility in partners’ suite of ref services

ask. ON service • 12 Colleges • 62 hrs/wk • ~2 staff per shift • Cost recovery nonprofit funding model • Mandate: “better information than the visitors could find on their own” • Access to resources to which they are entitled • Customer service: “honest and kind”

ask. ON today

What we evaluate

Metric 1. Traffic Learning Outcome • Visitor volume of need • Partner marketing efforts— where they put ask. ON buttons Value • ask. ON: Training & Schedule Development • Partner: traffic from their community, traffic from collaborative community • Is the button where visitors need it to be.
# of Chats -Overall -Busiest months -Per library")
Metric Learning Outcome Value 1. Traffic a)# of Chats -Overall -Busiest months -Per library b) Hourly traffic - Time of year traffic trends - Visitor community need - Time of need - Busiest hour(s) of need - Training to satisfy need and trend - Training for community need - Scheduling staff levels
 Daily traffic - Busiest day(s) of need")
Metric Learning Outcome Value 1. Traffic c) Daily traffic - Busiest day(s) of need - Time of week/month traffic trends - Training & scheduling to satisfy need d) “Offline” chats - Visitor need(s) outside service hours - Setting service hours e) “none of the above” - Visitor need outside partnership - Assessment of partner libraries for visitor needs

Metric 2. Visitors Learning Outcome Who is using ask. ON and why? Value • ask. ON: How to best satisfy the info need • Partner: Where to be and how to satisfy the info need
Pre-chat survey -Status - Demographics -Location - On")
Metric Learning Outcome Value 2. Visitors a)Pre-chat survey -Status - Demographics -Location - On or off campus -Repeat - Repeat visitors -Question - What is the info need -Service development: service quality training, resources, tools, staffing levels -If they don’t come back we’ve done a good job/if they come back we’ve done a good job

ask. ON visitors College 2013 visitors

ask. ON by the numbers College Chats 2013 *up 11%

Metric 3. Service Quality Learning Outcome • What level of service are we providing • Why are visitors using ask. ON Value • ask. ON & Partner: fulfillment of mandate
 RUSA guidelines rubric - Quality of")
Metric Learning Outcome Value 3. Service Quality a) RUSA guidelines rubric - Quality of customer service - Quality of reference interview b) Response rate - Chat answered in 90 secs or less? - Service quality training

2013 Service Evaluation – RUSA metrics ask. ON Staff Enthusiasm Attitude of ask. ON Staff Very Courteous Very enthusiastic Neutral 7% 14% 39% 54% 62% Enthusiastic 24% Neutral

2013 Service Evaluation – RUSA metrics ask. ON Staff Listening & Inquiring Skills 120 100 80 60 40 20 Ne ed bl e ila va t A No s I m Sa pr tis ov e fa m ct or en t y od Go ce lle nt 0 Ex Number of Chats

2013 Service Evaluation – RUSA metrics ask. ON Staff Patient with Users Neutral 19% ask. ON Staff Search Strategy N/A Very patient 35% 34 Satisfactory 47 Good Patient 46% Excellent 86 35

2013 Service Evaluation – RUSA metrics ask. ON Staff Teaching Users to Search Satisfactory 12% N/A 5% Excellent 31% Good 52%

ask. ON Staff Offering Better Searching Tips N/A 11 Satisfactory 54 Good 91 Excellent 56 ask. ON Staff Encourages Users to Return 10% 50% 40% Yes No NA
 Chat length - How much time")
Metric Learning Outcome Value 3. Service Quality c) Chat length - How much time spent on visitor need d) Volume by staff - How many questions are answered by staff from each library - Staffing levels - Professional development - Service quality

2013 Time Spent per Chat > 60 minutes 45 minutes < 60 minutes 30 minutes < 45 minutes 20 minutes < 30 minutes 10 minutes < 20 minutes 5 minutes < 10 minutes > 5 minutes 0 10 20 30 40 50 60
 Exit survey - How did they learn about ask.")
Metric Learning Outcome Value e) Exit survey - How did they learn about ask. ON -ask. ON presence & promotion -Marketing efforts - How did we help -How we satisfied need -Visitor needs - Used before? -Repeat users - Service rating -How did we meet expectations -What makes people return? What doesn’t -Service quality training - Recommend? -Referrals -More usage - Other comments -Testimonials -Marketing material, impact statements
 Transcript analysis - Question type - info need(s) trends")
Metric Learning Outcome Value f) Transcript analysis - Question type - info need(s) trends - staff performance - Service quality -Service quality training

1034 chat transcripts from Sept 2 to Oct 30, 2014 Visitor need observations: • 1 st weeks of semester involved many PIN/Login needs. • Consistent needs have been: • accessing articles and databases; • keyword searches; • writing essays; • how to use APA citation format. • how to borrow and renew materials • Other questions were about finding a tutor; editing help; eating in the library; lost items; quiet study areas; library hours; and room bookings.

Metric Learning Outcome Value 4. Presence Visitor points of access to ask. ON & Partner: Are we where ask. ON visitors need us to be? a) Links on askon. ca - Presence of partners on info site - Marketing efforts b) Buttons on partner sites - Contact us page - OPAC - e. Resources - LMS - Visitor access points - Comprehensive and easy points of access

Metric 5. Staff feedback Learning Outcome Staff workflow & quality of service Value Partners own and control the service a) Staff surveys - Feedback about service and - Ongoing assessment of workflow service infrastructure, workflow, training, b) Site Coordinator - Feedback & decisions about scheduling Communication service and workflow FEEDBACK • Steering Committee • Task Forces • ask. ON Marketing Group

Metric 6. Marketing Learning Outcome Visitor awareness and points of access Value • ask. ON & Partner: Are we where visitors need us? • Raising the profile of libraries in general Rebecca T. Editorial Miller, “Library Unlimited: Amazon and the Limits of the Book Brand, ” Library Journal (August 1, 2014), http: // lj. libraryjournal. com/2014/08/opinion/editorial/library-unlimited -amazon-and-the-limits-of-the-book-brand-editorial/#_.
 Social media reach Learning Outcome -Visitor engagement -Usage impact b) Monthly marketing")
Metric a) Social media reach Learning Outcome -Visitor engagement -Usage impact b) Monthly marketing plans c) Marketing other services - Including ask. ON as another point of access to services Value • ask. ON & Partner: Are we where visitors need us? • Raising the profile of libraries in general

Metric Learning Outcome 7. Staffing levels Do we have adequate staff support for best quality of service Value • ask. ON & partner: Training & Schedule Development • ask. ON: partner recruitment
 # of partners - Are we serving everyone who")
Metric Learning Outcome Value a) # of partners - Are we serving everyone who needs us? - Collaborative model is a big ROI – cost of the service goes down with more partners b) # of staff - Do we have enough staff to satisfy visitor needs? - Collaborative staff schedule is another big ROI – cost of staffing the service goes down when shared C = contribution hours T = total staff hours % ROI = (T-C)/C * 100 % ROI = (124 - 7)/7 * 100 = 16. 7 * 100 = 1, 670% ave. ROI for partners

What we want to evaluate more

Metric Learning Outcome Value 1. Transcript data mining How many more needs are we satisfying than reported? - Questions within chats - Keywords -How many questions are we -“true” traffic stats REALLY answering? Ie. 2. 5/per chat -Service quality training -Monitoring needs and trends More accurate need metrics

Metric 2. Staff community - Learning Outcome What can we teach other Value Staff knowledge share -Teachable moments from -Professional conference shares, lunch & learns, development etc. Feedback from staff -Service quality chats and portal enhancement shares Feedback from online & live events

Metric Learning Outcome 3. Partner evaluations What our partner libraries are evaluating - ask. ON service - Other library services -The value they find in ask. ON -The value they find in their other services that may apply to ask. ON Value Enhancements and supplemental value to ask. ON evaluations

Metric Learning Outcome Value 4. Knowledge base More detail about visitor needs Archiving visitor needs and resources for quicker and easier quality of service - Use by staff Use by visitor -Staff efficiencies -Visitor convenience

Value of VR Collaboratives

Value of VR Collaboratives • Extend the reach of the library via convenient, remote access • Extend the hours of service of the library • Provide an ROI with collaborative staffing and fee model • Provide professional development for staff • Provide visitors with info lit & research skills • Raise the profile of libraries and their services in the community

http: //www. eln. bc. ca/askaway/documents/Measuring. Value 2. pdf

Present & Future Trends • Chat has become the preferred medium of reference by students* *Chow, A. S. & Croxton, R. A. , “A Usability Evaluation of Academic Virtual Reference Services”, College and Research Libraries, 2014 • ONLINE Learning support !

…questions? jdawson@ocls. ca brandonw@eln. bc. ca
. Key Performance Indicator For Libraries: Presentation. Knight Foundation")
ask. ON References (2012, February 18). Key Performance Indicator For Libraries: Presentation. Knight Foundation Library Conference. Lecture conducted from, Miami. Are there birds in Canada? (n. d. ). Retrieved January 5, 2015, from https: //answers. yahoo. com/question/index? qid=20100117213414 AAo. Fgsn Ask. Away. (2010, January 29). Preliminary Approaches to Measuring Value. Retrieved January 5, 2015, from http: //www. eln. bc. ca/askaway/documents/Measuring. Value 2. pdf Bissessarsingh, M. (2014). An Evaluation of Ask Ontario’s 2013 Virtual Reference Service. Ottawa. Chow, A. , & Croxton, R. (2014). A Usability Evaluation of Academic Virtual Reference Services. College and Research Libraries, 75(3), 309 -361. Retrieved January 15, 2015, from http: //crl. acrl. org/content/75/3/309. full. pdf%20 html Miller, R. (Ed. ). (2014, August 1). Library Unlimited: Amazon and the Limits of the Book Brand. Retrieved December 5, 2014, from http: //lj. libraryjournal. com/2014/08/opinion/editorial/library-unlimited-amazon-and-the-limits-of-thebook-brand-editorial/#_ Ottens, W. (Ed. ). (n. d. ). Librarian Problems. Retrieved January 5, 2015, from http: //librarianproblems. com/
![Ask. Away References Barks, C. (Artist). Scrooge Mc. Duck [online image]. (n. d). Retrieved](http://slidetodoc.com/presentation_image/6cde80bc90faa2be020d9297904544bc/image-100.jpg "Ask. Away References Barks, C. (Artist). Scrooge Mc. Duck [online image]. (n. d). Retrieved")
Ask. Away References Barks, C. (Artist). Scrooge Mc. Duck [online image]. (n. d). Retrieved January 19, 2015, from http: //www. examiner. com/article/u-s-supreme-court-overturns-bulk-of-mccain-feingold-act-part -1 Ask. Away. (2015). Service Data. Retrieved from http: //askaway. org/staff/data-and-reports Chow, A. , & Croxton, R. (2014). A Usability Evaluation of Academic Virtual Reference Services. College and Research Libraries, 75(3), 309 -361. Retrieved January 15, 2015, from http: //crl. acrl. org/content/75/3/309. full. pdf%20 html Doing it wrong [online image]. (n. d). Retrieved January 19, 2015, from http: //www. dailyplacebo. com/2005_10_01_archive. html Facts are meaningless [online image]. (n. d). Retrieved January 19, 2015, from http: //memegenerator. net/instance/27267683 Weigel, B. (2014). Ask. Away: A Visibility Impact Study. Unpublished paper, British Columbia Electronic Library Network, Burnaby, BC. Your sample size is bad and you should feel bad [online image]. (n. d). Retrieved January 19, 2015, from http: //www. quickmeme. com/meme/3 s 6 cjz
- Slides: 100