Intro Financial Barriers to Opportunity for Higher Education

Intro Financial Barriers to Opportunity for Higher Education Socioeconomic Diversity Alliance University of Chicago January 18, 2016 Tom Mortenson Senior Scholar The Pell Institute for the Study of Opportunity in Higher Education

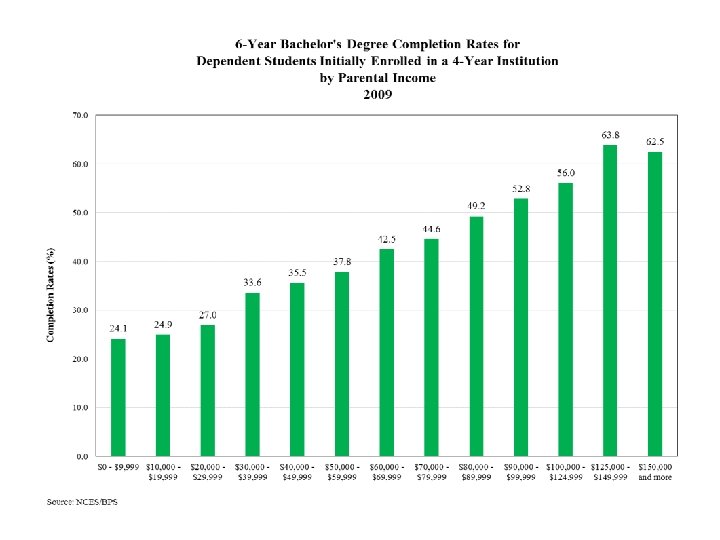
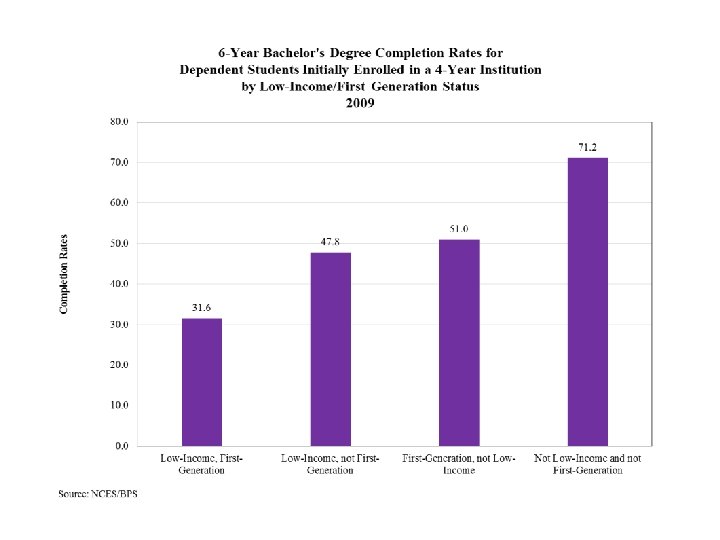
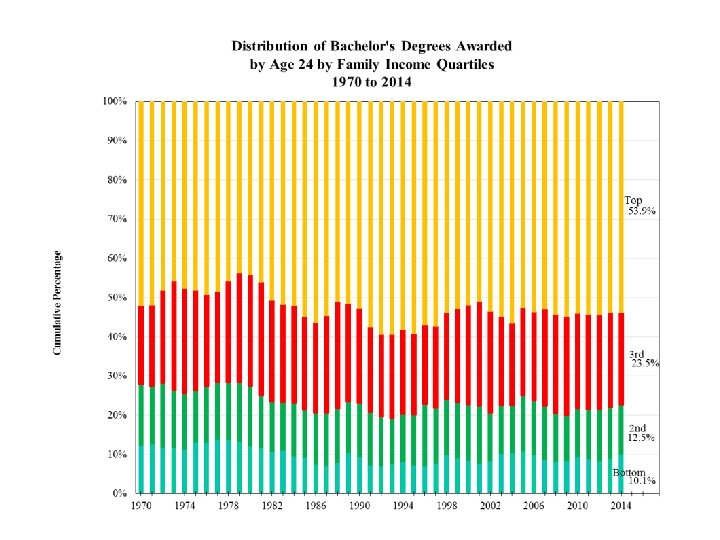
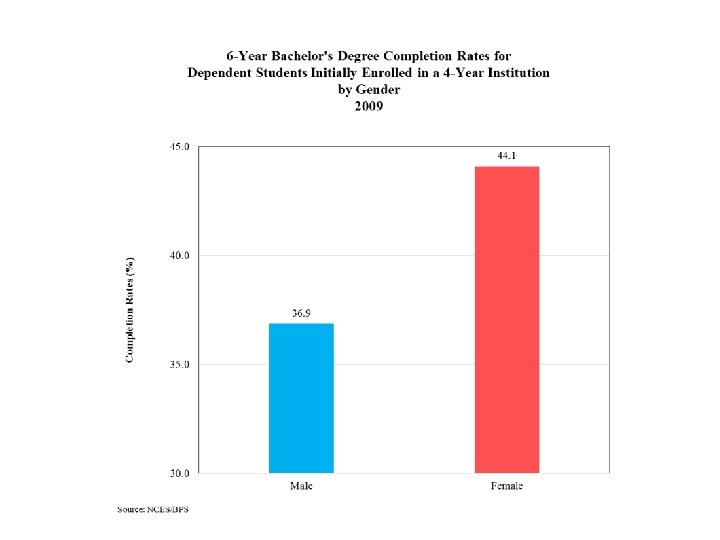
Financial Barriers • • • Education Pipeline Family Income Financial Barriers Consequences Restoring college affordability

Financial Barriers • • • Education Pipeline Bottleneck in Higher Education Financial Barriers Consequences Proposals

6 -Year Bachelor's Degree Completion Rates for Dependent Students Initially Enrolled in a 4 -Year Institution by Pell Grant Status 2009 70, 0 63, 7 60, 0 Completion Rates 50, 0 44, 4 40, 0 30, 0 20, 0 10, 0 Received Pell Grant Source: NCES/BPS Did Not Receive Pell Grant

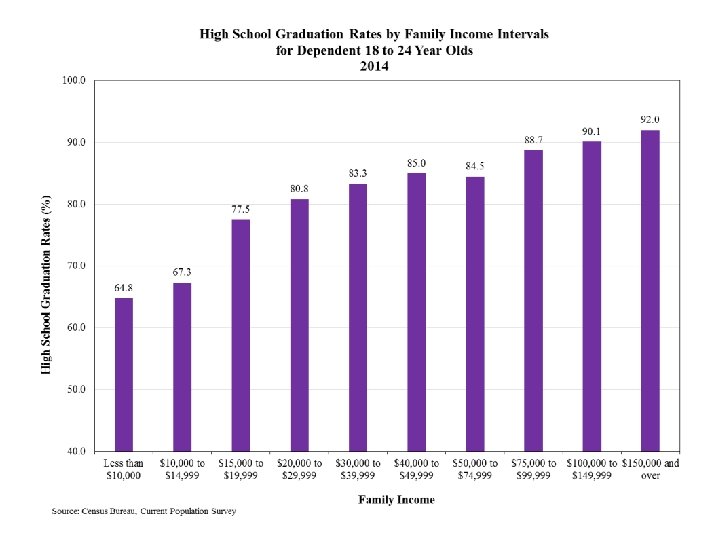
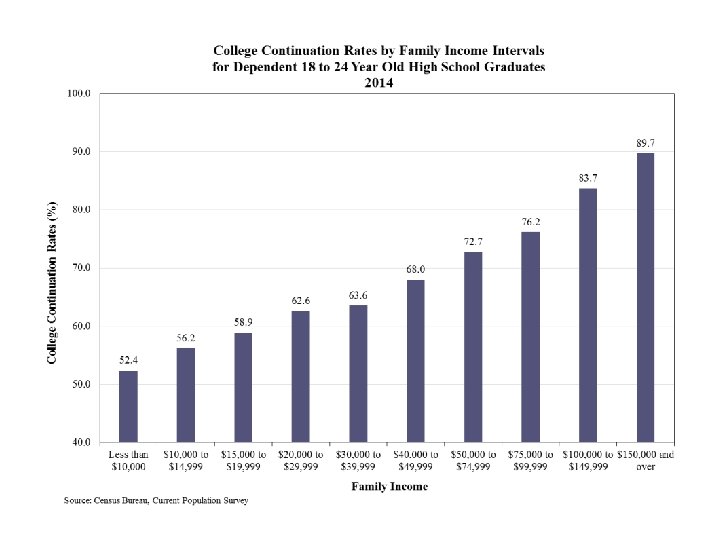
Overview of 6 -year Graduation Rates for Entire Population of Low-income Students Enrollment & Graduation Breakdown of the Bottom Income Quartile under Age 24 % of Low Income < 24 Population 100% COLLEGE ACCESS GAP (55% of total) 72% HS Grad Rate 45% 61% Enrollment Rate of HS Graduates 18% 6 -yr Bachelor’s Grad Rate of Enrolled Students % of Total Graduated from HS Total Population 19 While the college persistence gap is smaller than the access gap for low income students, there is far greater inequity between low and high income students who enroll in college. % of Total Enrolled in College COLLEGE PERSISTENCE GAP (37% of total) 8% % of Total With a Bachelor’s Degree High income student % 91% 81% 73% Size of gap b/t low and high income students 1. 3 x 1. 8 x 8. 8 x Source: Postsecondary Opportunity – postsecondary. org Note: The 18% 6 year graduation rate of enrolled students in the bottom quartile includes students who attend Community College

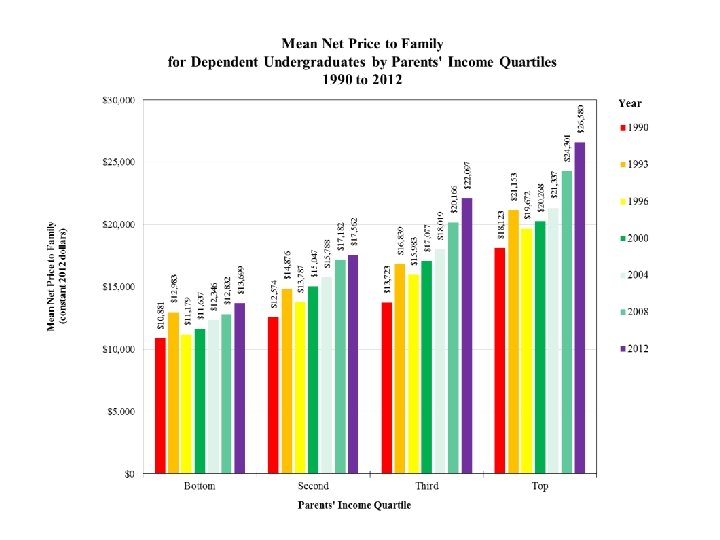
Financial Barriers • • • Education Pipeline Family Income Financial Barriers Consequences Restoring college affordability

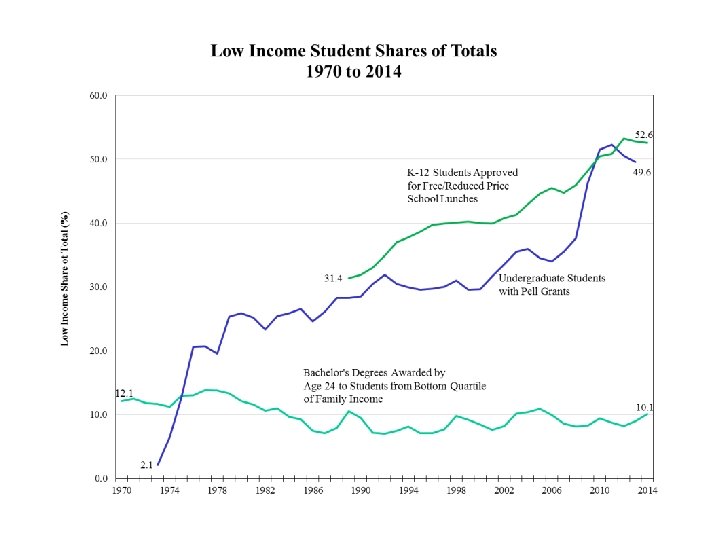
K-12 School Children Approved for National School Lunch Program 1989 to 2014 30, 0 20, 0 10, 0 1989 1991 Source: US Dept of Agriculture 1993 1995 1997 1999 2001 2003 2005 2007 2009 2011 2013 52, 6 52, 8 53, 3 50, 8 50, 4 48, 2 46, 0 44, 8 44, 6 42, 9 41, 3 40, 7 39, 9 40, 0 40, 2 40, 1 39, 9 39, 7 38, 6 37, 8 37, 0 34, 9 33, 0 31, 9 40, 0 31, 4 Approved (%) 50, 0 45, 5 60, 0

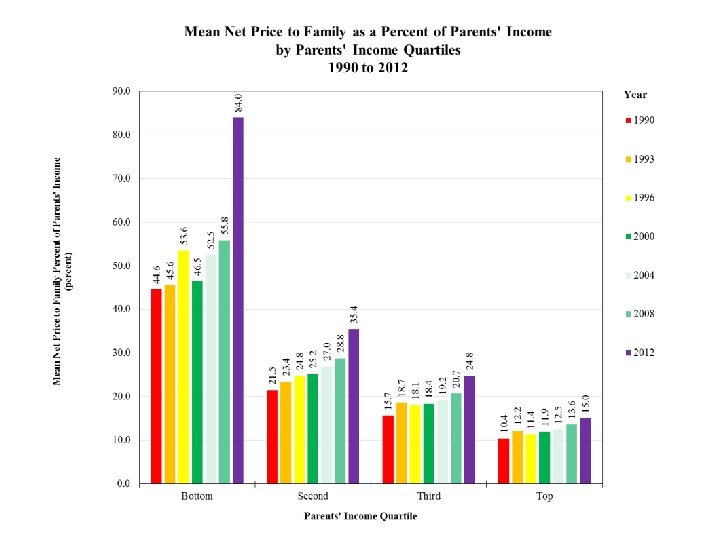
Financial Barriers • • • Education Pipeline Family Income Financial Barriers Consequences Restoring college affordability

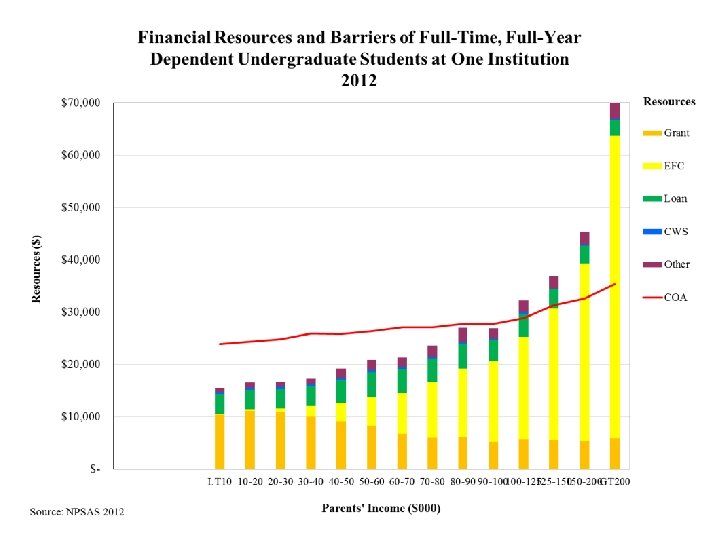
Financial Need Analysis Model Cost of Attendance Tuition and fees Room and board Books and supplies Personal and medical care Transportation Less: Expected family contribution Income and assets Family size Number of children enrolled in college Equals: Financial need Gift aid: grants, scholarships, waivers Earnings from work/study Education loans: subsidized/unsubsidized Stafford, PLUS Federal tax credits

Financial Barriers • • • Education Pipeline Family Income Financial Barriers Consequences Restoring college affordability

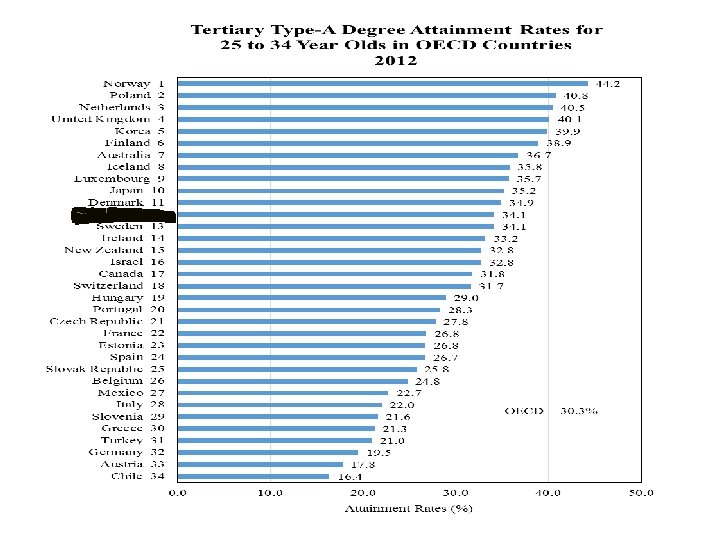
Tertiary Type-A Degree Attain 25 -34 yr olds OECD 2003
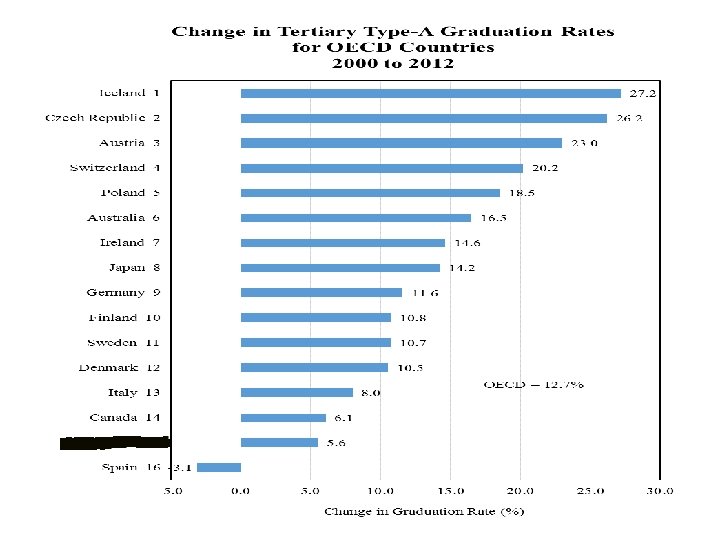

Projected Tertiary Type-A Degree attain OECD 2020

Financial Barriers • • • Education Pipeline Family Income Financial Barriers Consequences Restoring college affordability

Restoring College Affordability: Recommendations for Reauthorization of the Higher Education Act 1. 2. 3. 4. 5. 6. 7. $13, 000 Pell Grant maximum award $2000 Super Pell Grant Federal-State partnership for financing Pell Grant program College Work-Study for all students Income contingent education loan repayment Admissions lottery for class-selective Title IV institutions Rigorous evaluation of all financial aid programs for effectiveness

Contact Information: Email me to request this Power. Point: tom@postsecondary. org
- Slides: 51