Intro Bioinformatics Spencer Muse NCSU Statistics Hamid Ashrafi

Intro. Bioinformatics Spencer Muse, NCSU Statistics Hamid Ashrafi, NCSU Horticulutural. Science Fred Wright, NCSU Statistics/Biological Sciences Block 1: DNA Sequence Analysis 8/17 – 9/21 Spencer Muse

Genetics Basics

Basic Concepts For most organisms • DNA is the genetic material • DNA composes chromosomes • Chromosomes are found in the nucleus of cells • Chromosomes are inherited by offspring from parents

DNA, the Genetic Material • DNA is a chain of nucleotides, or bases. • DNA has 4 different nucleotides: – – A: adenine C: cytosine G: guanine T: Thymine – U: Uracil (in RNA) ATGCTACTTCACTGA |||||||| TACGATGAAGTGACT DNA is often found in a double-stranded form. A pairs with T, C pairs with G.

Genes A gene is a small region of a chromosome (and is thus simply a string of nucleotides). ATGCTACTTCACTGA

The Genetic Code • Protein-coding genes are composed of triplets of nucleotides called codons. • Each codon encodes one of 20 possible amino acids. • Chains of amino acids form proteins. ATG CTA CTT CAC TGA Met Leu His Stop M L L H *

Central Dogma DNA ATG CTA CTT CAC TGA Transcription RNA AUG CUA CUU CAC UGA Translation Protein M L L H

Anatomy of a Gene Introns Promoter Exons

DNA to RNA to Protein

Keywords • • DNA RNA Nucleotide Base Transcription Translation Intron Exon • • RNA polymerase Promoter Chromosome Gene Protein Amino acid Splicing Nucleus

Phenotypes • Which genes affect a phenotype? • Relating genetic variation to phenotypic variation

SNPs • Single Nucleotide Polymorphisms • Very dense SNP maps are currently being produced (1, 000+ in humans) • Fast, cheap to score

Gene Expression Profiling using DNA Microarrays Plasminogen activator inhibitor-2 HMG Co. A reductase Each spot corresponds to a single human gene Signal color and intensity reveal changes in gene activity

 • RFLP (Restriction Fragment Length Polymorphisms)")
Other Markers • SSRs (Simple Sequence Repeats; microsatellites) • RFLP (Restriction Fragment Length Polymorphisms) • SSCP (Single Sequence Confirmation Polymorphisms)

Statistics Overview

Overview 1. 2. 3. 4. Random Variables and Probability Distributions Parameter Estimation Hypothesis Testing 5. 6. 7. 8. Likelihood Conditional Probability Stochastic Processes Inference for Stochastic Processes

Probability The probability of a particular event occurring is the frequency of that event over a very long series of repetitions. • P(tossing a head) = 0. 50 • P(rolling a 6) = 0. 167 • P(average in a population sample is greater than 21) = 0. 25

Random Variables A random variable is a quantity that cannot be measured or predicted with absolute accuracy.

Probability Distributions • The distribution of a random variable describes the possible values of the variable and the probabilities of each value. • For discrete random variables, the distribution can be enumerated; for continuous ones we describe the distribution with a function.
 0 0. 125 1 0. 375 2")
Examples of Distributions x P(X = x) 0 0. 125 1 0. 375 2 0. 375 3 0. 125 Binomial Normal

Parameter Estimation One of the primary goals of statistical inference is to estimate unknown parameters. For example, using a sample taken from the target population, we might estimate the population mean using several different statistics: the sample mean, the sample median, or the sample mode. Different statistics have different sampling properties.

Hypothesis Testing A second goal of statistical inference is testing the validity of hypotheses about parameters using sample data. If the observed frequency is much greater than 0. 5, we should reject the null hypothesis in favor of the alternative hypothesis. How do we decide what “much greater” is?

Likelihood For our purposes, it is sufficient to define the likelihood function as Analyses based on the likelihood function are wellstudied, and usually have excellent statistical properties.

Maximum Likelihood Estimation The maximum likelihood estimate of an unknown parameter is defined to be the value of that parameter that maximizes the likelihood function: We say that is the maximum likelihood estimate of .

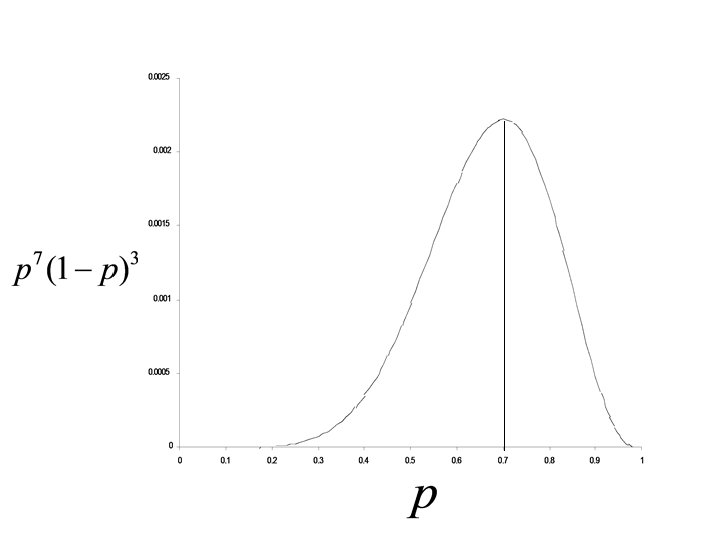
Example: Binomial Probability If , then Some simple calculus shows that the MLE of is , the frequency of “successes” in our sample of size n. If we had been unable to do the calculus, we could still have found the MLE by plotting the likelihood:

Likelihood Ratio Tests Consider testing the hypothesis: The likelihood ratio test statistic is:

Distribution of the Likelihood Ratio Test Statistic Under quite general conditions, where n-1 is the difference between the number of free parameters in the two hypotheses.

Conditional Probability The conditional probability of event A given that event B has happened is

Stochastic Processes A stochastic process is a series of random variables measured over time. Values in the future typically depend on current values. • Closing value of the stock market • Annual per capita murder rate • Current temperature

ACGGTTACGGATTGTCGAA t=0 ACa. GTTACGGATTGTCGAA t=1 ACa. GTTACGGATg. GTCGAA t=2 ACc. GTTACGGATg. GTCGAA t=3

Inference for Stochastic Processes We often need to make inferences that involve the changes in molecular genetic sequences over time. Given a model for the process of sequence evolution, likelihood analyses can be performed.
- Slides: 33