Intracavity Laser Spectroscopy of Pt O and Pt


 A” 1Σ+")

 theoretical calculations")


,")
- Slides: 25
Intracavity Laser Spectroscopy of Pt. O and Pt. C in the Near Infrared Leah O'Brien and Hui Liu Department of Chemistry, Southern Illinois University Edwardsville, IL 62026 -1652 S. Shaji, Sean Whittemore, and James O'Brien Department of Chemistry, University of Missouri St Louis, MO 63121 -4499
Spectroscopy of Pt. O • Electronic Spectroscopy – 1950, Feast observed Pt. O bands in electric discharge – 1970 s, Scullman et al. observed analyzed several electronic transitions of Pt. O – 1991, Bernath et al. observed new transition in near. IR – 2002, Lineberger et al. observed PES of Pt. O– • Vibrational Spectroscopy – 1999, Andrews et al. observed in matrix – 2001, Andrews et al. observed Pt(O 2) and OPt. O • Rotational Spectroscopy – 2005 Tanimoto et al. – 2005 Cooke and Gerry
Previous work on Pt. O in the red and infrared 15000 cm-1 a 2 1 A 2 0 A 3 0+ 10000 cm-1 A' 3Π 2 A' 3Π 1 Scullman (Physica Scripta 1982) A' 3Π 0+ Bernath (JMS 1991) 5000 cm-1 x 3 Σ- 1 0 cm-1 X 3 Σ- 0
Bonding in Pt. O • Pt ground state is 3 D 3 (5 d 96 s) • Several other low-lying states of Pt that arise from 5 d 86 s 2 and 5 d 10 (<10000 cm-1) • Many states expected with T 0 <30000 cm-1 • No theoretical calculations on excited states of Pt. O
MO Energy Level Diagram for Pt. O Fenske-Hall Calculation • Pt. O ground state is X 3Σ– • Spin-spin splitting in X 3Σ– state is ~1000 cm-1 – Ground state originally thought to be 1Σ+
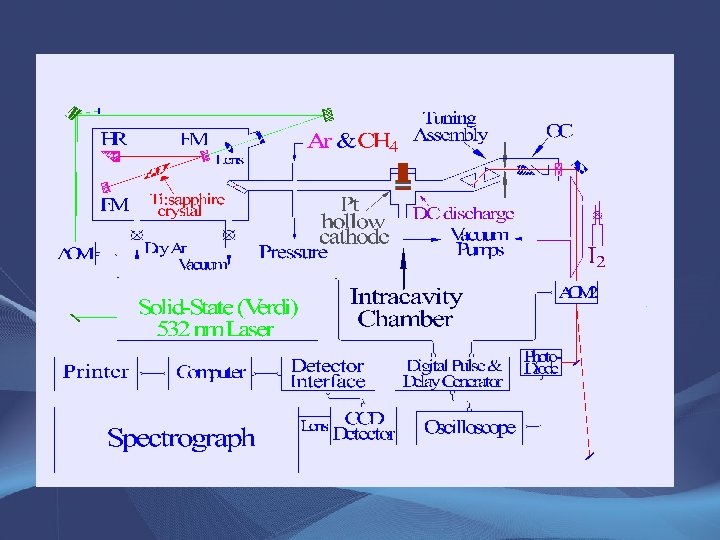
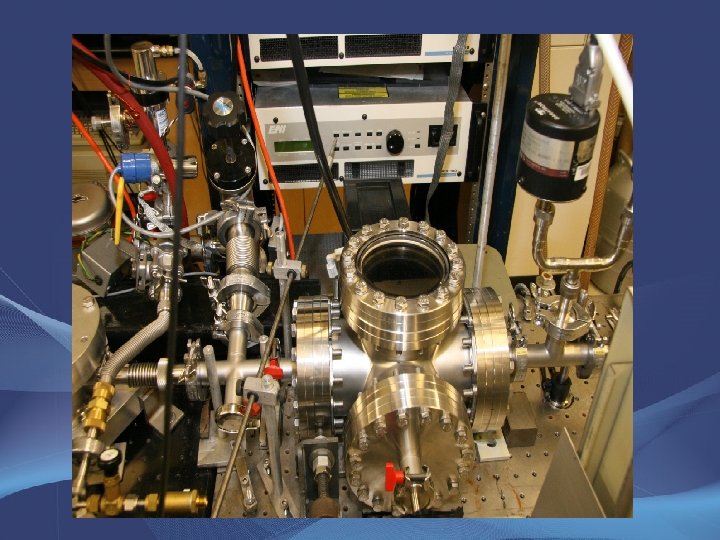
Experimental Method • Intracavity laser spectrometer at UM-St. Louis – Effective absorption pathlength is ~ 1 km – Use external I 2 cavity and Iodine Atlas • Spectrum originally obtained with ~2 Torr mixture of Ar and H 2 – Searching for Pt. H • Pt-lined hollow cathode, 0. 2 -0. 8 A plasma current • No O 2 added! – We presume that oxygen comes from residual water absorbed on chamber surfaces – Spectrum disappears when O 2 is added!
ILS Spectrum of Pt. O
ILS Spectrum of Pt. O
Analysis of the 12129 cm-1 band • 3 branches • Bandheads at 12129 and 12119 cm-1 • Originally we thought it could be a new [12. 1]Ω=1 – X 3Σ– 0 transition, but lower state B value from fit did not match with B value of the X 3Σ– 0 state • Lower state B value did match with B value of the x 3Σ– 1 state • Transition is identified as the A 3 0+ - x 3Σ– 1 transition, previously observed by Scullman
Completed Analysis • Improved line positions 15000 cm-1 – Scullman’s work at 0. 02 cm-1 accuracy – Our work at 0. 005 cm-1 10000 cm-1 accuracy (I 2 atlas) • Improved parameters for A 3 0+ state – Used x 3Σ– 1 parameters from Bernath • Pt isotope and hyperfine structure not resolved • Observed molecular absorption from excited electronic state – NEW for ILS! a 2 1 A 2 0 A 3 0+ Ω=1 A' 3Π 2 A' 3Π 1 A' 3Π 0+ 5000 cm-1 x 3 Σ- 1 X 3 Σ- 0 Bernath, 1991 Scullman, 1982
Spectroscopy of Pt. C • Electronic Spectroscopy – 1960 s, Scullman et al. observed analyzed several electronic transitions of Pt. C – 1990 s, Steimle et al. observed hyperfine structure and used optical Stark spectroscopy to determine dipole moments • Vibrational Spectroscopy – Nothing reported • Rotational Spectroscopy – Nothing reported
Previous work on Pt. C in the red and infrared 20000 cm-1 A 1Π 15000 cm-1 A' 1Π A" 1Σ 10000 cm-1 Steimle (JCP 1995) Scullman (Physica Scripta 1973) 5000 cm-1 X 1Σ
Molecular Beam LIF Spectrum of Pt. C • Pt major isotopes: R(2) A” 1Σ+ - X 1Σ+ – 194 Pt – – – (33%) 195 Pt (34%, I=½) 196 Pt (25%) 198 Pt (7%) • Observed up through J”=5 Steimle, 1999
Bonding in Pt. C • Pt ground state is 3 D 3 (5 d 96 s) • Pt. C ground state is X 1Σ+ • If a 3σ electron is excited to the 2π orbital, lowlying 3Π and 1Π states are expected Fenske-Hall calculation
Excited States of Pt. C 20000 cm-1 A 1Π • Recent (2000) theoretical calculations on excited states of Pt. C by Minaev • He concludes that the A' and A" states of Pt. C are spin-orbit components of the a 3Π state 15000 cm-1 a 3 Π 2 a 3 Π 1 a 3Π 0± Scullman, 1973 Steimle, 1995 A' 1Π A" 1Σ 10000 cm-1 5000 cm-1 Minaev, 2000 0 cm-1 X 1Σ
Experimental Method • Intracavity laser spectrometer at UM-St. Louis – Effective absorption pathlength is ~ 1 km – External iodine cell for calibration • Spectrum originally obtained with ~2 Torr mixture of Ar and H 2 – Still searching for Pt. H! • Pt-lined hollow cathode, 0. 2 -0. 8 A plasma current • Initially no CH 4 (or other carbon source) added! – We presume that carbon comes from residual methane absorbed on chamber surfaces – Adding CH 4 (3% in Ar) enhances signal
ILS Spectrum of Pt. C
Analysis of the 12656 and 12547 cm-1 bands of Pt. C • Bands readily identified as the (0, 0) and (1, 1) bands of the A" 1Σ+ - X 1Σ+ transition • Some isotope structure is observed Branches observed up through J = 40 • Improved high-J line positions – Accuracy 0. 005 cm-1 • Improved molecular parameters – Included low-J lines from Steimle in the fit
Current Projects • Still searching for Pt. H • New spectrum observed with bandhead at 11737 cm-1 – Pronounced Pt isotope and hyperfine structure • Contains 1 Pt atom – 4 branches • 1 P-form, 2 Q-form and 1 R-form branch observed • 2 P and 2 R branches with large spin-rotation interaction? – At this time, we believe this is Pt. N • Previous work by Field et al. (JCP 1994) and Steimle and Balasubramanian et al. (JCP 1995)
ILS Spectrum of Pt. N
ILS Spectrum of Pt. N
Conclusions • Observed Pt. O and Pt. C – Improved molecular constants – Improved line positions • Observed a new electronic transition in Pt. N (analysis in progress) – D 2 Σ+ - a 4 Σ– ½ • These ILS absorption spectra of Pt. O, Pt. C and Pt. N are very strong • Haven’t found Pt. H! Masked by the Pt. O, Pt. C and Pt. N spectra?
Acknowledgements • Funding – NSF – PRF • S. Shaji (former post-doc at UMSL), Univ. Autonoma de Neuvo Leon, Mexico • Hui Liu (M. S. student at SIUE, finishing this summer) • Sean Whittemore (summer student at UMSL) • Thank you for your attention!