Intracavity Laser Absorption Spectroscopy of Pt S in

Intracavity Laser Absorption Spectroscopy of Pt. S in the Near Infrared James J. O'Brien University of Missouri – St. Louis and Leah C. O'Brien and Kimberly Handler Southern Illinois University Edwardsville
 n n n Three")
Previous Work on Pt. S n 1995, Steimle Lab (ASU) n n n Three electronic transitions reported in the visible region Via LIF in a laser-ablation, molecular beam experiment The (0, 0) band of the B – X and (0, 0) and (1, 0) bands of the C – X transitions were recorded at high resolution and analyzed Observed states of Pt. S were assigned as X Ω=0, A Ω=1, B Ω=0, and C Ω=0 Pure rotation spectrum of Pt. S also presented Later that year, the group reported the electric dipole moment of Pt. S in the ground state Li, Jung, & Steimle, J. Mol. Spec. 170, 310 -322 (1995). Steimle, Jung & Li, J. Chem. Phys. 103, 1767 -1772 (1995)
 n n n Pure")
Previous Work on Pt. S n 2004 Gerry Lab (UBC) n n n Pure rotational spectrum Examined several different istopologues of Pt. S Their results support a ground state with X 3Σ¯ 0+ symmetry with Hund’s case (c) coupling, similar to Pt. O n n Based on significant hyperfine and Born-Oppenheimer breakdown parameters 2009 Andrews Lab (U. Virginia) n n n Infrared spectrum of Pt. S in a cryogenic matrix Weak vibrational bands of Pt 32 S and Pt 34 S at 491. 7 and 479. 3 cm-1, respectively Density Functional Theory (DFT) calculations for the lowest singlet and triplet states of Pt 32 S gave vibrational frequencies of 500. 6 cm-1, in good agreement with the experimental results Cooke & Gerry, J. Chem. Phys. 121, 3486 -3494 (2004). Liang, Wang & Andrews, J. Phys. Chem. A, 113, 3336 -3343 (2009).
 n n Ti: sapphire laser:")
Experimental Conditions n Used Intracavity Laser Absorption Spectroscopy (ILS) n n Ti: sapphire laser: 11400 – 13500 cm-1 range tg ~ 100 μsec Leff ~ 1 km Hollow Cathode Source n n n 50 mm Pt-lined hollow cathode 0. 5 Amp Discharge Current ~ 2 Torr Argon + trace SF 6

Measuring Absorption by Intracavity Laser Spectroscopy HR OC Laser Medium Tuning Elements HR OC Laser Medium Absorber HR OC Laser Medium HR = High Reflector OC = Output Coupler 5

Beer-Lambert Absorbance Relationship for ILS: n n When ILS laser observed at a well defined time after the onset of laser operation, the averaged time-resolved spectrum (for initial 500 μs– 1 ms) is: Absorbance = ln [I 0(ν)/I(ν)] = (ν) N [c • tg • l/L], where n n n n n I 0(ν), I(ν) = laser intensity without and with absorption at frequency ν (ν) is the absorption coefficient at ν N = number density [ pressure or concentration] c is the speed of light = 3 x 10⁸ meter/second tg is the generation time l/L is the fraction of cavity occupied by the absorber i. e. , Effective absorption pathlength (Leff) = c • tg • l/L tg determines sensitivity (Leff =100 km for tg = 500 µs, l/L = 2/3), and permits a huge dynamic range because it can be easily altered tg ~ 500 µs relatively easy for standing wave lasers; much longer times possible with special ring configured systems 1000’s miles of pathlength!

ILS Schematic Diagram

Intracavity Laser Chamber

2009 Pt. F Spectrum, RF 01

Pt + SF 6 n While recording and analyzing Pt. F spectra…. n Several bands looked different from those for Pt. F n Line spacing more dense n Rotational structure looked like a singlet (whereas, Pt. F is a doublet) n → These bands consistent with Pt. S
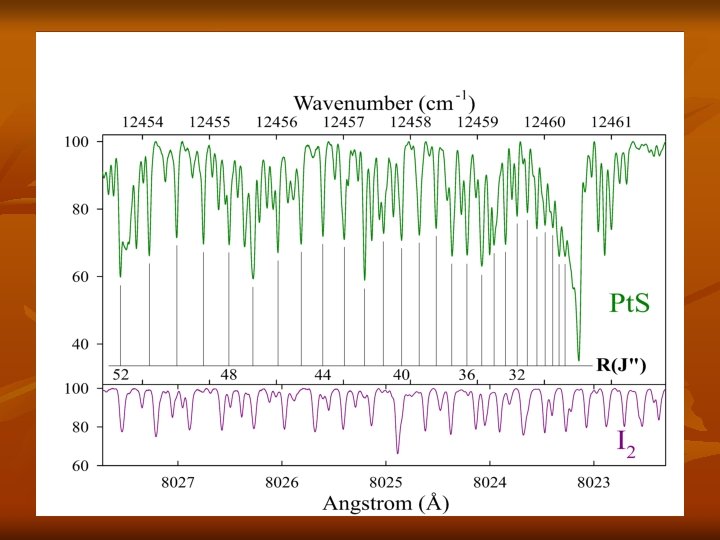

Results n n n Strong bandhead at 12460. 5 cm-1 1 P-branch and 1 R-branch identified Branch structure consistent with 0+ - 0+ transition No isotopologue structure of Pt. S was observed Conclusion: n (0, 0) band of a newly identified [12. 5] =0+ – X =0+ of Pt. S
")
Analysis n n n n Used Pt. S constants from Cooke and Gerry (2004) to calculate Δ 2 F values 66 R-lines and 45 P-lines and Δ 2 F values to obtain secure rotational assignment n Δ 2 F(J″) = F(J″+1) – F(J″-1) = R(J″-1) – P(J″+1) Definitely Pt. S, lower state is v=0 of the X 0+ state Our observed J-values ranged from 7 to 90 Ground state parameters were held fixed in fit 3 excited state parameters determined: E 00, B 0 and D 0 Average residual was ± 0. 005 cm‑ 1, consistent with our estimated experimental accuracy for strong, non-blended lines (referenced to I 2 Atlas)

Section of Pt. S Lines, Assignments and Residuals Observed J-values ranged from 7 to 90
 E B 0 D 0 x 108")
Molecular Constants for Pt. S (in cm-1) E B 0 D 0 x 108 r 0 (Å) [12. 5] Ω=0 12457. 4804(13) 0. 140411639(88) 4. 832(12) 2. 091 X Ω=0 a. Cooke and Gerry 2004 1σ given in parentheses 0. 0 0. 147180835 a 4. 8033 a 2. 042

MO diagram for Pt. S • Based on a Fenske-Hall calculation • π2 configuration gives rise to the X 3Σ-0, 1 states • 3σ to 4σ excitation would result in an excited 0+ state (from 3Σ-0, 1)

Conclusions n n n Recorded the 12460 cm-1 band of Pt. S by ILS (0, 0) band of a 0+ - X 0+ transition Molecular constants for the excited state determined: E 00, B 0′ and D 0′ Acknowledgements n n NSF and PRF for financial support Kimberly Handler is an undergraduate student at SIUE
- Slides: 17