Intersection Control Signal Timing for Different Color Indications


: that part of a cycle allocated")


 DHV = (Peak-Hour Volume /")
 depends on an")


 Signals o o o The signals at isolated intersections")
 Signals/ WEBSTER Method o Minimum intersection delay is obtained")


 + [2.")


 1. 2. 3. 4. When")


")


 = degree")
 ratio is uaually")
")
- Slides: 54
Intersection Control/ Signal Timing for Different Color Indications Chapter 8 Dr. TALEB AL-ROUSAN
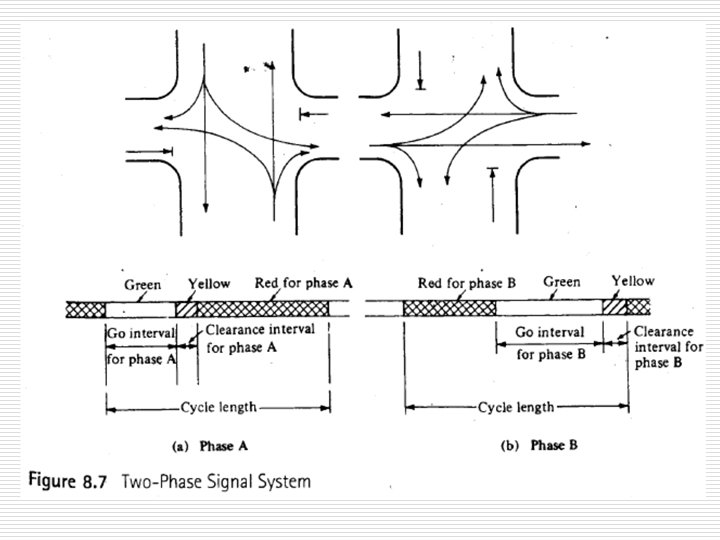
Signal Timing for Different Color Indications/ Definitions o o Efficient operation of the signal requires proper timing of different color indications. Controller: A device in a traffic signal installation that changes the color indicated by the signal lamp according to a fixed or variable plan. Cycle length: the time in seconds required for one complete color sequence of signal indication (the time that elapses from the start of green to the end of red indication). See Figure 8. 7.
Definitions Cont. o o o Phase (Signal Phase): that part of a cycle allocated to a stream of traffic, or combination of two or more streams, having the right-of-way simultaneously during one or more intervals (see Figure 8. 7). Interval: Any part of the cycle length during which signal indications do not change. Offset: the time lapse in seconds or the percentage of the cycle length between the beginning of a green phase at the intersection and the beginning of a corresponding green phase at the next intersection.
Definitions Cont. o o Change and Clearance Interval: Total length of time in seconds of the yellow and all-red signal indication. This time is provided for vehicles to clear the intersection after green interval before conflicting movements are released. All-Red Interval: The display time of a red indication for all approaches. Used some times as a phase exclusively for pedestrians crossing or to allow vehicles and pedestrians to clear very large intersections before opposing approaches are given the green indication.
Definitions Cont. o o Split-Phase: Part of a phase that is set apart from the primary movement, thus forming a special phase that relates to the parent phase. Peak-Hour Factor (PHF): Is a measure of the variability of demand during the peak hour. It is the ratio of the volume during the peak hour to the maximum rate of flow during a given time period within the peak hour. PHF = (volume during peak hour / 4 X volume during peak 15 minutes within peak hour). PHF may be used in signal timing design to compensate for the possibility that peak arrival rates for short periods during the peak hour may be much higher than the average for the full hour.
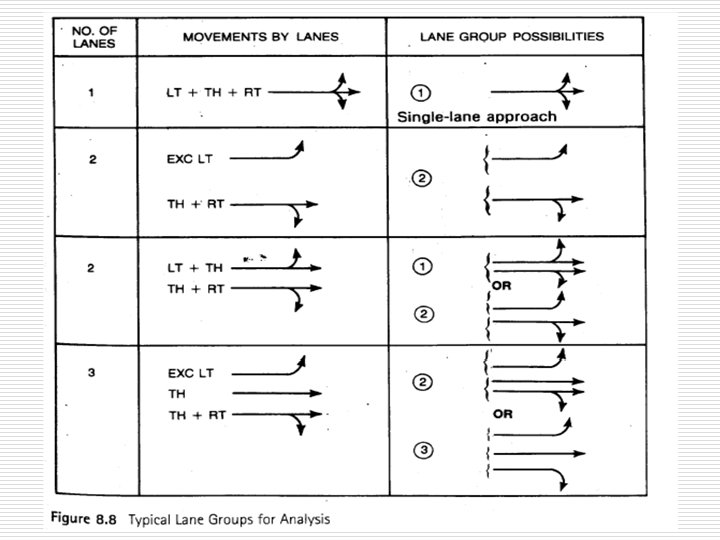
Definitions Cont. o o o Design Hour Volume (DHV) DHV = (Peak-Hour Volume / PHF) Lane Group: Consist of one or more lanes on an intersection approach and having the same green phase. (see Figure 8. 8 for typical lane groups). Critical Lane Group: Is the lane group that requires the longest green time in a phase. Saturation Flow Rate (S): The flow rate in (veh/h) that the lane group can carry if it has the green indication continuously (i. e. if g/C =1).
Saturation Flow rate o o o The saturation flow rate (S) depends on an ideal saturation flow (So = 1900 veh/h of green time per lane). The ideal saturation flow is then adjusted for the prevailing conditions to obtain the saturation flow for the lane group being considered. The adjustment is made by introducing factors that correct for: n n n n n o The number of lanes. Lane width. % of heavy vehicles. Approach grade. Parking activity. Local buses stopping within the intersection. Area type. Lane utilization factor. Right and left turns. Highway Capacity Manual provides an equation to compute saturation flow rate.
Saturation Flow rate Cont. S =So N f. W f. HV fg fp fbb fa f. LU f. LT f. RT f. Lpb f. Rpb S = saturation flow rate for the subject lane group, expressed as a total for all lanes in the lane group (veh/h) So= Base saturation flow rate per lane (pc/h/ln) N= number of lanes in the group. f. W = adjustment factor for lane width. f. HV = adjustment factor for heavy vehicles. fg = adjustment factor for approach grade. fp = adjustment factor for existing of parking lane or parking activity adjacent to lane group. fbb = adjustment factor for blocking effect of bus stops within the intersection area. fa = adjustment factor for area type. f. LU = adjustment factor for Lane Utilization. f. LT = adjustment factor for left turns in the lane group. f. RT = adjustment factor for right turns in the lane group. f. Lpb = pedestrian adjustment factor for left-turn movements f. Rpb = pedestrian adjustment factor for right-turn movements.
Main Objectives of Signal Timing 1. 2. o o Reduce average delay of all vehicles. Reduce probability of crashes. These objectives are achieved by minimizing the possible conflict points when assigning the right of way to different traffic streams at different times. The objective of reducing delay some time conflict with that of reducing crashes. n n o o o Number of phases should be kept min. to reduce delay. Need more phases to separate traffic streams. In such cases, Engineering judgment should be used to determine a compromise solution. Try to adapt a two-phase system whenever possible, using shortest practical cycle length that is consistent with the demand. At complex intersections it may be necessary to use a multi -phase system to achieve the main design objectives.
Traffic Signal Types 1. 2. 3. 4. Pre-Timed Signals. o Fixed Timing Patterns. o Used for predictable and constant traffic. Semi-Actuated Signals. o Detectors only on minor approaches. o Used for unpredictable and fluctuated traffic. Fully Actuated Signals. o Detectors on all approaches. o Used for unpredictable and fluctuated traffic. Volume-Density Signals o Detectors on all approaches with early detection required. o Used for unpredictable and fluctuated traffic.
Signal Timing At Isolated Intersections o o o Isolated Intersection: Is the one in which the signal time is not coordinated with that of any other intersection and therefore operates independently. Cycle length of this type should be short (35 to 60 seconds). When approach volumes are very high, longer cycle lengths can be used. Cycle lengths should be kept below (120 seconds) since very long cycle lengths will result in excessive delays. Methods to find optimum cycle length are: n Webster method. n Highway Capacity method. n Cycle failure method.
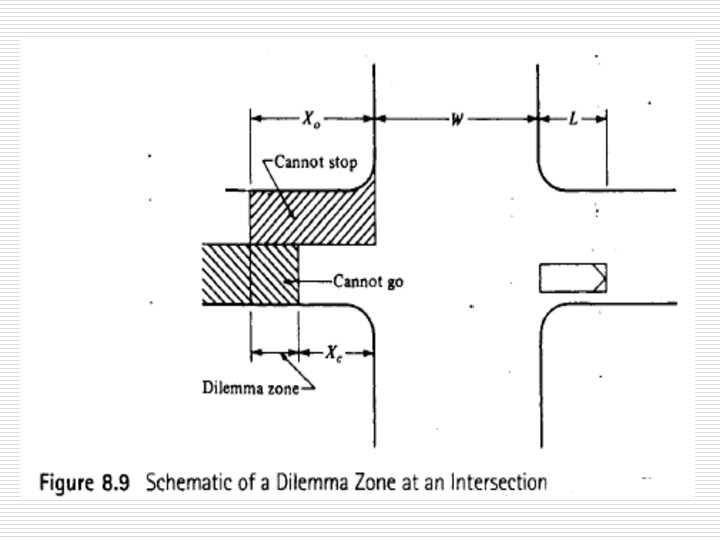
Yellow Interval o o o In most methods used to find the optimum cycle length, yellow is considered as component of the green time. Main purpose of yellow indication: n Alert motorists that green light is about to change to red. n Allow vehicles already in the intersection to cross it. Bad choice of yellow interval may lead to the creation of dilemma zone. Dilemma Zone: An area close to an intersection in which a vehicle can neither stop safely before the intersection nor clear the intersection without speeding before the red signal come on. The required Yellow interval is the time period that guarantees that an approaching vehicle can either stop safely or proceed through the intersection without speeding. See Figure 8. 9.
Yellow Interval Cont. o o For dilemma zone to be eliminated Xo distance should be equal to Xc. Let n min = yellow interval in (sec. ) n Uo ( min )= distance traveled during the change interval without accelerating. n Uo = speed limit on approach (ft/sec) Xc = Uo ( min ) - (W + L) ……………… Equ. (1) n Xc= distance within which a vehicle traveling at the speed (Uo) during the yellow interval ( min ) cannot stop before encroaches on the intersection. n Vehicles within this distance at the start of the yellow interval will have to go through the intersection. n W = Width of the intersection (ft). n L = Length of vehicle (ft).
Yellow Interval Cont. o For vehicle to be able to stop Xo = Uo d + (Uo 2/2 a) ………… Equ. (2) n n n Xo = min. distance from the intersection for which a vehicle traveling at the speed limit (Uo) during the clearance interval( min ) can not go through the intersection without accelerating. Any vehicle at this distance or greater has to stop. d = perception reaction time (sec) a = constant rate of braking deceleration ( 11. 2 ft/sec 2) For dilemma zone to be eliminated Xo = Xc Equaling equations 1 & 2 yields:
Yellow Interval Cont. For vehicle to be able to stop o min = d +[(W + L)/ Uo] + [Uo / 2(a + Gg)] G= grade of the approach. g= acceleration due to gravity (32. 2 ft/sec 2). o o Safety considerations preclude yellow intervals of less than (3 sec. ) To encourage motorists’ respect for the yellow interval , it is usually not made longer than (5 sec. ) When longer yellow intervals are required an all-red phase can be inserted to follow the yellow indication. The change interval, (yellow + all-red) phase can be at least the value computed from the equation above.
Cycle Lengths Of Fixed (Pre-timed) Signals o o o The signals at isolated intersections can be pre-timed (fixed), semi-actuated, or fully actuated. Pre-timed signals assign the right of way to different traffic streams in accordance with a preset timing program. Each signal has a preset cycle length that remains fixed for a specific period of the day or for the entire day.
Cycle Lengths Of Fixed (Pre-timed) Signals/ WEBSTER Method o Minimum intersection delay is obtained when the cycle length is obtained by : Co = [(1. 5 L + 5)/ (1 – SUM i-f Yi)] Co = optimum cycle length (sec). L = total lost time per cycle (sec). Yi = maximum value of the ratios of approach flows to saturation flows for all lane groups using phase (i) (i. e. qij/Sj). f = number of phases qij =flow on lane groups (1…j) having the right of way during phase (i). Sj = saturation flow on lane group (j).
WEBSTER Method/ Total Lost Time o o o See Figure 8. 10. Some time is lost before the vehicles start moving (start of green). Some time is lost too at the end of the amber (yellow phase) before turning to red. The maximum rate of discharge = saturation flow. if there are sufficient vehicles in the queue to use the available green time, the maximum rate of discharge will be sustained until the yellow phase occur. Rate of discharge will then fall to zero when yellow signal changes to red.
WEBSTER Method/ Total Lost Time
WEBSTER Method/ Total Lost Time o o The number of vehicles that go through the intersection is represented by the area under the curve. Effective green time = (Number of vehicle that go through the intersection / Saturation flow) Effective green time < (green + yellow) times The difference is considered lost time, since it is not used by any other phase for the discharge of vehicles.
WEBSTER Method/ Total Lost Time Li = Gai + i - Gei Li = lost time for phase (i) (sec) Gai = actual green time for phase (i) not including yellow time (sec). Gei = Effective green time for phase (i) (sec). i = yellow time for phase (i) (sec). L = (SUM Li )i - f+ R R = All-red time during the cycle.
WEBSTER Method/ Allocation Of Green Time o Total effective green time available per cycle is given by: Cte= C – L = C- [(SUM Li )i - f+ R] C= actual cycle length used (usually obtained by rounding off Co to the nearest 5 sec. ) o To obtain minimum overall delay, the total effective green time should be distributed among the different phases in proportion to their (Y) values to obtain the effective green time for each phase. Gei = ( Yi/ (Y 1 + Y 2 + … Yf)) (Gte) o The actual green time for each phase is obtained as: Gai = Gei + Li - i
WEBSTER Method/ Minimum Green Time o o o At intersection where significant number of pedestrians cross, it is necessary to provide a minimum green time that will allow the pedestrians to safely cross the intersection. The length of this minimum green time may be higher than that needed for vehicular traffic to go through the intersection. The green time for traffic moving in the North-South direction should not be less than the green time required for pedestrians to cross the East-West approach at the intersection, and visversa.
WEBSTER Method/ Minimum Green Time Gp = 3. 2 + (L /Sp) + [2. 7(Nped/We)] For We > 10 ft Gp = 3. 2 + (L /Sp) + [0. 27(Nped)] For We > 10 ft Gp = minimum green time (sec). L = cross walk length (ft). Sp = average speed of pedestrians (4 ft/sec). (3. 2) = pedestrian start up time (sec). We = effective cross walk width (ft). Nped = number of pedestrians crossing during an interval.
Traffic Signal Timing Procedure 1. 2. 3. 4. 5. 6. 7. 8. Select Signal Phasing. Calculate the equivalent straight-through passenger cars. Select critical lane volumes. Calculate change interval. Calculate minimum cycle length. Allocate green time. Check pedestrian crossing time. Prepare a signal indication summary.
Traffic Signal Timing Procedure/ 1. Select Signal Phasing o o o Try to keep number of phases to minimum as more phases increase lost time. See Figure 8. 13 for different phase plans. Separated protected left-turn phases should only be used when warranted.
P h a s e P l a n s
Determination of Left Turn Treatment o Left turn vehicles at signalized intersections can proceed under one of three signal conditions: n n n o o Permitted turning movements. Protected turning movements. protected/ permissive turning movements. Determination of specific treatment at a location depends on the transportation jurisdiction. HCM suggests guidelines for providing protected left turn treatment.
Permitted Left Turn Movements o o Are those made within gaps of an opposing traffic stream or through a conflicting pedestrian flow. The suitability of the permitted left turn depends on: n n n The geometric characteristics of the intersection. The turning volume. The opposing volume.
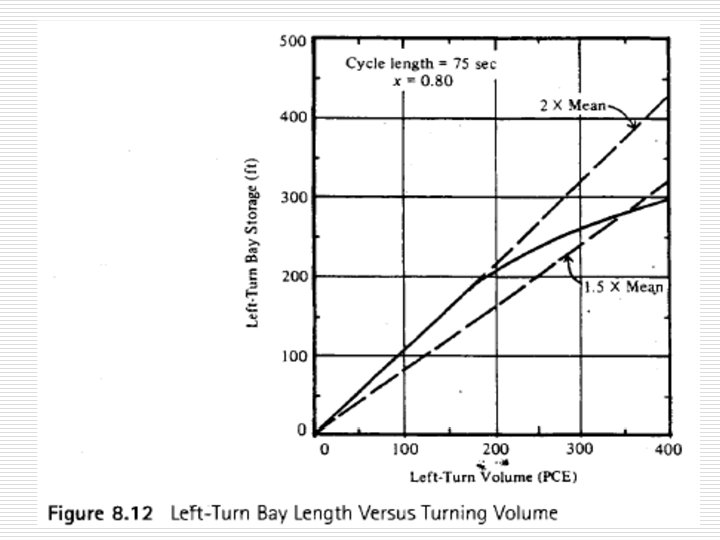
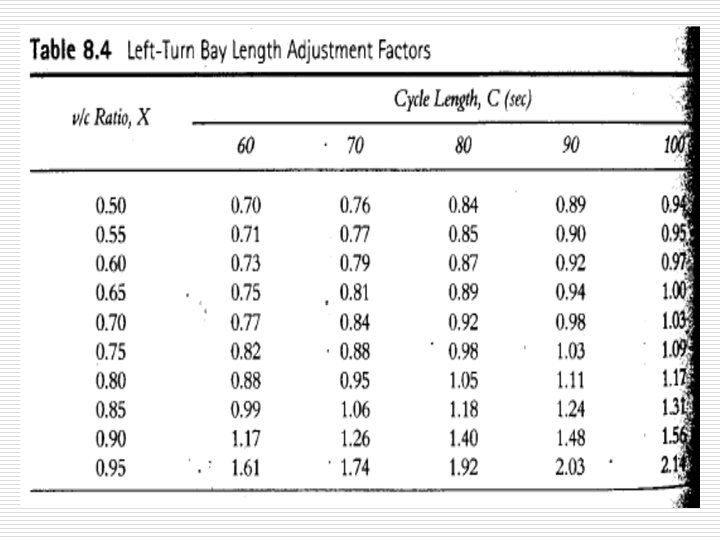
Protected Left Turn Movements o o o Are those turns protected from any conflict with vehicles in an opposing stream or pedestrians on a conflicting crosswalk. Takes less time and will use less time of the available green time than permitted turns. When a protected left turn phase is provided, an exclusive left turn lane must be provided. The length of this storage lane should be adequate for the turning volume so that the safety or capacity of the approach is not negatively affected. Length of the left turn lane can be determined from Figure 8. 12 and Table 8. 4.
Protected/Permissive Left Turn Movements o o Is a combination of the protected or permissive conditions. Vehicles are first allowed to make left turn under protected condition and then allowed to make left turns under the permissive conditions.
HCM Guidelines For Providing Protected Left Turn Treatment (Phase) 1. 2. 3. 4. When two or more left turn lanes are on the approach. When Left turn unadjusted volume is higher than 240 veh/h. When cross product of unadjusted left turn volume and the opposing main line volume (including the right turn volume) exceed: o [50, 000] for # of through lanes = 1 o [90, 000] for # of through lanes = 2 o [110, 000] for # of through lanes = 3 If the left turn equivalent factor is (3. 5) or higher. This factor is used to convert left turning vehicles to equivalent straight through vehicles. This factor value depends on the type of phasing (permitted. Protected, . . ), type of lane (exclusive or shared), proportion of left turn vehicle in a shared lane, and opposing flow when permitted turn is used.
Traffic Signal Timing Procedure/ 2. Calculate The Equivalent Straight. Through Passenger Cars Adjustment factor for equivalent straightthrough passenger cars Vehicle Type & Movement Adjustment Factor Passenger car (Straight. Through) Heavy Vehicle 1. 0 Left-turning 1. 6 Right-turning 1. 4 1. 5 Note: You might need to convert the peak hour volumes into design hour volumes by dividing the adjusted volumes by the PHF
Traffic Signal Timing Procedure/ 3. Select Critical-Lane Volume o o o For each phase find the lane group with highest volume (critical lane volume). Distribution of traffic over lanes is best done by traffic surveys. If surveys are not available, the amount of traffic in the most heavily used lane in the approach (criticallane volume) can be approximated as the total approach volume multiplied by a critical lane factor. n For through lanes or shared through and turning lanes the factor = 0. 525 for two lane approach and = 0. 367 for three lane approach. n For two-lane exclusive left turn approach = 0. 515 n For two-lane exclusive right turn approach = 0. 565
Traffic Signal Timing Procedure/ 4. Calculate Change Interval o o Change interval = yellow + all-red. min = d +[(W + L)/ Uo] + [Uo / 2(a + Gg)] Yellow Time = d + [Uo / 2(a + Gg)] All-Red = [(W + L)/ Uo] Yellow time = 3 -5 sec. n min = yellow interval in (sec. ) n Uo = speed limit on approach (ft/sec) n W = Width of the intersection (ft). n L = Length of vehicle (ft). n d = Driver perception reaction time (1. 0 sec) n a = constant rate of braking deceleration ( 11. 2 ft/sec 2). n G= grade of the approach. n g= acceleration due to gravity (32. 2 ft/sec 2).
Traffic Signal Timing Procedure/ 5. Calculate Minimum Cycle Length o o o Cycle length is the summation of individual phases. Cycle lengths From 40 -60 sec and at max of 120 sec. Cycles > 120 sec and unusual and used in exceptional cases. Co = [(1. 5 L + 5)/ (1 – SUM i-f Yi)] Co = optimum cycle length (sec) rounded to the nearest 5 sec. L = total lost time per cycle (sec) = total yellow and all-red times/cycle. Yi = maximum value of the ratios of approach flows to saturation flows for all lane groups using phase (i) (i. e. qij/Sj). Or ratio of critical lane volume to the per lane saturation flow for signal phase i. f = number of phases qij =flow on lane groups (1…j) having the right of way during phase (i). Sj = saturation flow on lane group (j).
Traffic Signal Timing Procedure/ 6. Allocate Green Time o o o Total effective green time available per cycle is given by: Cte= C – L = C- [(SUM Li )i - f+ R] the total effective green time should be distributed among the different phases in proportion to their (Y) values to obtain the effective green time for each phase. Or distributed to each phase in proportion to the ratio of critical lane volume of the phase to summation of all crirtical lane volumes of all phases. Gei = ( Yi/ (Y 1 + Y 2 + … Yf)) (Gte) o The actual green time for each phase is obtained as: Gai = Gei + Li - i
Traffic Signal Timing Procedure/ 7. Check Pedestrian Crossing Time Gp = 3. 2 + (L /Sp) + [2. 7(Nped/We)] For We > 10 ft Gp = 3. 2 + (L /Sp) + [0. 27(Nped)] For We > 10 ft Gp = minimum green time (sec). L = cross walk length (ft). Sp = average speed of pedestrians (4 ft/sec). (3. 2) = pedestrian start up time (sec). We = effective cross walk width (ft). Nped = number of pedestrians crossing during an interval. o Or PGT = 7 + (w/PWS) – YT - AR PGT= pedestrians green time, w= width of street, PWS = pedestrian walking speed, YT = yellow time, AR = all red time.
Signal Timing Of Arterial Routes o o o In urban areas the signals should be timed so that when a queue of vehicles is released by receiving the right of way (green) at an intersection, these vehicles should also have the right of way at the adjacent intersection. This is needed to reduce delay. All intersections should have the same cycle lengths. In rare instances, some intersections might have half or twice the common cycle length. Common cycle length is usually set with an offset that is suitable for main street. Traffic conditions at a given intersection are used to determine the appropriate phases of green, yellow, and red.
Signal Timing Of Arterial Routes Cont. The methods used to achieve the required coordination are: n n n o Simultaneous system Alternate system Progressive system Speed of Progression: speed at which a platoon of vehicles released at an intersection will proceed along the arterial (usually taken as the mean operating speed = distance between traffic signals/ corresponding travel time).
Simultaneous System All signals along a given arterials have the same cycle length and have the green phase showing at the same time, o When given the right of way, all vehicles move at the same time along the arterial and stop at the nearest signalized intersection when the right of way is given to the side street. U = X/ (1. 47 C) U= progression speed (mi/h) C= Cycle length (sec) X= average spacing for signals (ft) o
Alternate System Intersections on the arterials are formed into groups of one or more adjacent intersections. o Signals are then set such that successive group of signals are given the right of way alternately o Single alternate: when groups are made of individual signals. o Double alternate: when groups are made up of two adjacent signals. U = (n X)/ (1. 47 C) U= progression speed (mi/h) C= Cycle length (sec) X= average spacing for signals (ft) n= 2 for simple-alternate sys. n= 4 for double-alternate sys. n= 6 for triple-alternate sys. o Alternate system is most effective when the intersections are at equal distances from each other o
Progressive System o o Provides for a continuous flow of traffic through all intersections under the system when traffic moves at the speed of progression. The same cycle length is used for all intersections, but the green indication for each succeeding intersection is offset by a given time from that of the preceding intersection depending on: n Distance from preceding intersection. n Speed of progression for that section of the street. Limited or simple progressive system: when the offset and cycle length are fixed. Flexible progressive system: when the offset and cycle length can be changed to meet demands of fluctuating traffic at different times of the day.
Design Of Progressive Signal System Design involves the selection of best cycle length (C) using the criterion that the speed of progression is approximately equal to the mean operating speed of vehicles on the arterial street. o The selection is based on trial and error procedure. U = X/ (1. 47 C) U= progression speed (mi/h) C= Cycle length (sec) X= average spacing for signals (ft) o In addition, required cycle length for each intersection should be computed and compared to obtained cycle length found above. o If (C) is approximately equal to cycle length for majority of intersections, it can be selected on a trial bases. o However, it is a usual practice to use cycle lengths that have been established for intersecting or adjacent systems as guides for selecting a suitable cycle length. o Mostly done by softwares. o
Freeway Ramps o o o Ramps are usually part of grade-separated intersections. Some times are constructed between two parallel highways. Freeway ramps: n Entrance ramps n Exit Ramps n Access to the entrance or exit ramps is controlled, when necessary, in order to control number of vehicles entering or leaving a freeway. n This can be achieved by: o o Closure : by using (Don not enter) signs or barriers. Simple metering: by pre-timed signal with short cycle. Traffic response metering. Integrated system control
The Highway Capacity Method o o o Determine the cycle length based on the capacity (the maximum flow based on the available effective green time) of a lane group. Since the saturation flow rate is the max. flow rate on an approach or lane group when 100% effective green time is available, the capacity of an approach or lane group depends on the percentage of the cycle length that is given to that approach or lane group. Capacity of an approach or lane group is given by: ci = Si (gi/C) ci = capacity of lane group I (veh/h) Si = saturation flow rate for lane group or approach i (veh/h of green or veh/h/g). (gi/C) = green ratio for lane group or approach i. Gi = effective green for lane group or approach i. C = Cycle length.
The Highway Capacity Method Cont. o Ratio of flow to capacity (v/c) = degree of saturation can be expressed as : (v/c)i = Xi = [vi/ (Si (gi/C))] Xi = (v/c) ratio for lane group or approach i. Vi = actual flow rate for lane group or approach i. Si = saturation flow rate for lane group or approach i. gi = effective green time for lane group or approach i.
The Highway Capacity Method Cont. o o o The critical (v/c) ratio is uaually obtained for the overall intersection but considers only the critical lane groups or approaches (those with max flow ratios (v/S) for each signal phase). The critical (v/c) ratio for the whole intersection is given by: Xc = [SUM(V/S)ci] [C/(C-L)] Xc = Critical (v/c) ratio for the intersection. C = Cycle length (sec). SUM (v/S)ci = summation of the ratios of actual flows to saturation flow for all critical lanes, groups, or approaches. L = total lost time per cycle computed as the sum of the lost time (tl) for each critical signal phase L = SUMtl.
The Highway Capacity Method Cont. o o o This equation (Xc =. . ) can be used to estimate the signal timing for the intersection if a critical (v/c) ratio is specified. This equation can also be used to obtain indicators on sufficiency of the intersection by substituting the max permitted cycle length and obtaining the critical (v/c) ratio for the intersection. When (v/c) ratio < 1. 00 then the cycle length provided is adequate for all critical movements to go through the intersection. If the green time is proportionately divided among all phases. If green time is not properly allocated to different phases, it is possible to have (v/c) ratio <1. 0, but with one or more individual oversaturated movements within a cycle. See Examples 8. 6 & 8. 7.