Interpreting Center Variability Chebyshevs Rule The percentage of

Interpreting Center & Variability

Chebyshev’s Rule The percentage of observations that are within k standard deviations of the mean is at least where k > 1 This rule can be used with any distribution – regardless of its shape! If k = 2, then at least 75% of the observations are within 2 standard deviations of the mean.

Example-1: For a sample ofthe families with oneare At least 89% of observations preschool child, it was that the mean between 0 reported & 72 hours. Since time child care time week wasat approximately 36 can’t per be negative, most 11% of the hours with a observations standard deviation of approximately are above 72 hours. 12 hours. Using Chebyshev’s rule, at least 75% of the sample observations must be between __ and __ hours (within 2 standard deviations of the mean). At most, what percent of the observations are greater than 72 hours?

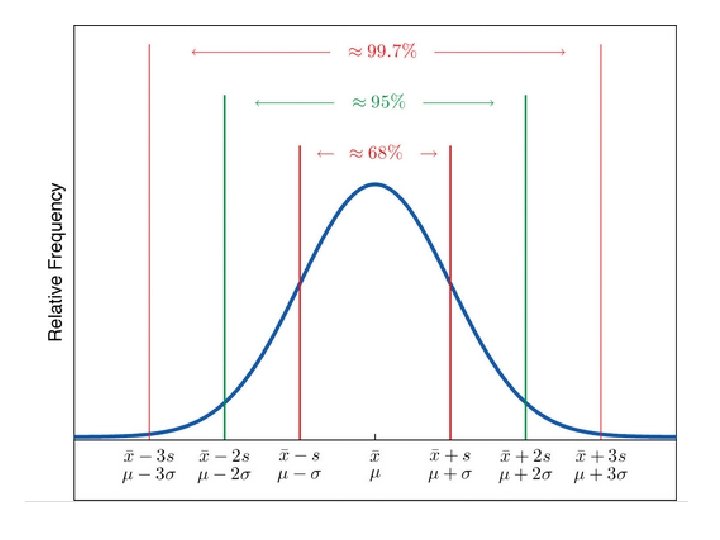
Empirical Rule • Approximately 68% of the observations are within 1 standard deviation of the mean. • Approximately 95% of the observations are within 2 standard deviation of the mean * Approximately 99. 7% of the observations are within 3 standard deviation of the mean Can ONLY be used with distributions that are mound (Normal) shaped!
 * Approximately 68% of the observations are")
Empirical Rule (68 -95 -99. 7 Rule) * Approximately 68% of the observations are within 1 standard deviation of the mean 99. 7% 68% 95% • Approximately 95% of the observations are within 2 standard deviation of the mean * Approximately 99. 7% of the observations are within 3 standard deviation of the mean

The height of female students at SFLS AP center is approximately normally distributed with a mean of 71 inches and standard deviation of 2. 5 inches. a) What percent of the female students are shorter than 66 inches? About 2. 5% b) Taller than 73. 5 inches? About 16% c) Between 66 & 73. 5 inches? About 81. 5%

Measures of Relative Standing Z-score A z-score tells us how many standard deviations the value is from the mean. standardized score.

What do these z-scores mean? -2. 3 1. 8 -4. 3 2. 3 standard deviations below the mean 1. 8 standard deviations above the mean 4. 3 standard deviations below the mean

Tracy is taking two different math achievement tests with different means and standard deviations. The mean score on test A was 56 with a standard deviation of 3. 5, while the mean score on test B was 65 with a standard deviation of 2. 8. Tracy scored a 62 on test A and a 69 on test B. On which test did Tracy score the best? Z-score on test A Z-score on test B She did better on test A.

Measures of Relative Standing Percentiles A percentile is the score below which a certain percentage of the data lies. A percentile is a value in the data set where r percent of the observations fall at or BELOW that value

Classwork Worksheet

Wednesday Test On chapter-3
- Slides: 17