Interpretation of sequential protocol biopsies in terms of

Interpretation of sequential protocol biopsies in terms of prognosis and clinical implications D. Serón Nephrology Department Hospital Vall d’Hebron Barcelona

SCr mol/l Biopsy 300 250 200 150 100 50 0 1 2 3 4 5 years

Lesions are too advanced The biopsy was done too late There is nothing we can do

The assumption that renal allograft histology should be perfectly normal during quiescence has not been adequately investigated Burdick JF et al, Transplantation 1984; 38: 679

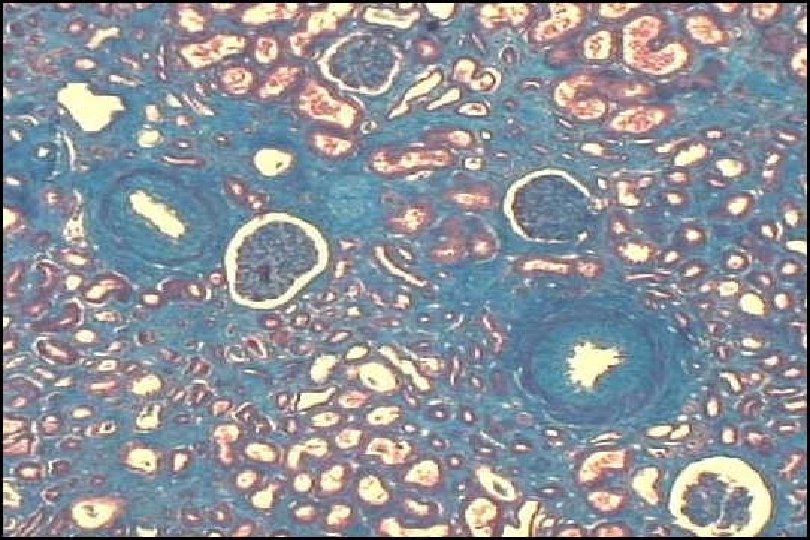
Characteristics of early routine renal allograft biopsies Protocol biopsies done at 1 -4 weeks Quantification of interstitial infiltrates with a morphometric technique in HE stained biopsies Diagnosis N cel/mm 2 interstitium _____________________ ATN in native kidney 9 451 101 Stable function 4 1290 179 Post-transplant ATN 7 1335 182 Acute rejection 5 2269 215* _____________________ Burdick JF et al, Transplantation 1984; 38: 679

Protocol biopsies Are lesions observed in protocol biopsies relevant from the clinical point of view?
 protocol biopsies predicts renal function deterioration N = 94 patients")
CAN in (2 y) protocol biopsies predicts renal function deterioration N = 94 patients Stable Deteriorated _____________________ CADI 1. 79 1. 89 5. 67 2. 94 <0. 0001 _____________________ Graft function deterioration: SCr >20% at 2 -4 y CADI: interstitial inflammation & fibrosis + glomerular sclerosis +mesangial matrix increase + vascular intimal proliferation + tubular atrophy Isoniemi H, Transplantation 1994

Chronic lesions at 6 m and graft survival N = 89 patients %graft survival 100 CGD<6 (n=54) 80 CGD>6 (n=35) 60 40 p=0. 0009 20 0 0 1 2 3 years Dimény E, Clin Transplantation 1995; 58(11): 1195

IF/TA is an independent predictor of graft survival % graft survival N=94 patients 100 80 Normal=53 CAN=41 60 40 p=0. 024 20 0 0 1 2 3 4 5 6 7 years RR 95% CI _______________ SCr 1. 026 (1. 005 -1. 0047) ( mol/l) CAN 5. 98 (1. 15 -31. 25) (yes vs. no) _______________ Serón D, Kidney Int 1997: 51: 310

Sirius red derived VInt. Fib and time to graft failure Grimm PC et al, J Am Soc Nephrol 2003

CAN, transplant vasculopathy and survival 3 m protocol Bx, n=282 % deatt censored graft survival 100 80 Normal IF/TA 60 Variable IF/TA (cv-score 1 40 20 p < 0. 001 0 0 20 40 60 80 100 120 Univariate Multivariate RR 95%CI _________________ SCr ( mol/l) 1. 009 (1. 001 -1. 016) - Prot (g/l) 1. 002 (1. 001 -1. 004) - IF/TA 4. 64 (1. 44 -14. 95) 4. 53(1. 39 -14. 82) IF/TA (cv-score) 13. 61(3. 73 -49. 62) 9. 45 (2. 32 -38. 41) meses Serón D, Transplantation 2000; 69: 1849

SCR + IF/TA and graft survival 95 pediatric recipients from a living donor 1 year protocol Bx Normal IF/TA without SCR IF/TA with SCR Shishido et al, JASN 2003; 14: 1046
, Tx 1998 -2001,")
Predicting decline in allograft function Biopsy at 1 year (living 69%), Tx 1998 -2001, n=292 Primary endpoint: death censored graft loss or > 50% GFR beyond 1 y Cosio FG et al, Am J Transplant 2005

SCR, CAN and graft survival Protocol Bx < 6 m; n=435 1 Normal=186 SCR=74 . 75 IF/TA=110 . 5 IF/TA+SCR=65 . 25 0 50 100 150 200 months Moreso F et al Am J Transplant 2006; 6: 747

Function and structure are independent predictors of outcome Moreso F et al. AJT 2006; 6: 747

Predictive value of clinical variables and different histological patterns on 7 y death censored graft survival n=361 pts, protocol Bx before 6 m, follow up > 7 y Surrogate Category Accuracy Sensitivity Specificity _______________________________ Acute rejection yes 72% 30% 80% 3 -month SCr >1. 8 mg/dl 73% 58% 76% Protocol biopsy IF/TA 67% 65% 67% Protocol biopsy IF/TA + cv-score 1 81% 21% 92% Protocol biopsy IF/TA + SCR 78% 31% 86% _______________________________ Seron D & Moreso F. Kidney Int 200; 72: 690

Poor predictive value of serum creatinine for renal allograft loss 1 st RT > 17 y, 1988 -1999, at least 2 y follow up SCr > 1. 8 mg/dl Variable Follow up Obs %Failed OR CI AUC _______________________________________ SCr at 1 y 2 y 74480 7. 2 2. 22 2. 13 -2. 31 0. 627 SCr at 1 y 7 y 35255 45. 2 2. 4 2. 31 -2. 50 0. 624 _______________________________________ While renal function is a strong risk factor and highly correlated with graft failure, the utility of renal function as a predictive tool for graft loss is limited Kaplan B et al. AJT 2003; 3: 1560

ROC AUC for graft failure at 5 y n=430 early protocol BX GFR AUC = 0. 679 (0. 581 - 0. 777); p=0. 001 Banff score AUC = 0. 685 (0. 598 - 0. 771); p=0. 001 Unpublished observation

Histology is not only a predictive variable but a surrogate variable

SRL and Cs. A withdrawal SRL > 5 ng/m. L + Cs. A 150 - 400 ng/m. L + Steroids N = 525 Randomization 3 m: n = 430 SRL+Cs. A, n = 215 SRL, n = 215

A reduction in CADI score is associated with improved survival Mota A et al. , AJT 2004; 4: 953 Oberbauer R, Transpl Int 2005; 1: 22

Benefit Risk

Questions How much contributes one protocol biopsy to predict outcome? Two sequential protocol biopsies improve the predictive value of histology

Questions How much contributes a protocol biopsy to predict outcome? Two Sequential protocol biopsies improve the predictive value of histology?

Inclusion criteria EARLY Prot Bx LATE Prot Bx Protocol Bx < 6 m GFR (MDRD 4) > 30 ml/min/1. 73 m 2 Proteinuria < 1 g/day Stable function > 5 years of follow up Protocol Bx > 12 -24 m

Patients and biopsies june 88 -december 2003 Bx < 6 m 458 Bx 12 -24 m 250 Bx < 6 m with tissue 430 Bx 12 -24 m with tissue 231

PREDICTIVE VALUE OF ONE BIOPSY n=430
 Predictive clinical variables b. ) Predictive")
Statistical approach Cox proportional hazard model a. ) Predictive clinical variables b. ) Predictive clinical and histological variables
 Recipient age Recipient sex (%male)")
Characteristics of patients n=430 Donor age Donor sex (%male) Recipient age Recipient sex (%male) PRA (%) HLA DR mm CIT (h) Retransplantation VHC DGF Acute rejection Graft loss Death censored graft loss 37± 17 70% 46± 14 63% 7. 5± 19 0. 63± 0. 58 22± 6 64/430 (17. 5%) 16% 17% 19% 146 (33. 2%) 104 (24. 2%) Time of biopsy (months) GFR ml/min/1. 73 m 2 Proteinuria g/d 4. 3± 1. 7 53± 14 0. 30± 0. 21

Histological data at the time of biopsy n=430 _______________ N glomeruli 13± 8 N arteries 5± 4 g 0. 15± 0. 48 i 0. 58± 0. 68 t 0. 38± 0. 61 v 0. 01± 0. 11 ah 0. 16± 0. 45 Acute score 1. 13± 1. 31 cg 0. 13± 0. 34 ci 0. 46± 0. 64 ct 0. 45± 0. 62 cv 0. 20± 0. 54 mm 0. 25± 0. 45 Chronic score 1. 24± 1. 65 _______________
 P")
Clinical variables and death censored graft survival Variable Univariate Multivariate RR (95% CI) P RR (95% CI) p Donor age 1. 013 (1. 002 -1. 025) 0. 027 1. 02 (1. 006 -1. 034) 0. 004 Recipient age 0. 98 (0. 97 -0. 99) 0. 015 0. 96 (0. 95 -0. 98) 0. 000 PRA (%) 1. 014(1. 007 -1. 021) 0. 000 1. 011 (1. 003 -1. 020) 0. 008 GFR (ml/min) 0. 97 (0. 96 -0. 99) 0. 000 0. 98 (0. 96 -0. 99) 0. 004 HCV pos 2. 29 (1. 49 -3. 52) 0. 000 1. 56 (0. 94 -2. 58) ns Proteinuria mg/d 1. 001 (1. 000 -1. 002) 0. 041 1. 001 (1. 000 -1. 001) ns

Histological diagnosis and graft survival No SCR - no IF/TA P = 0. 037 1 SCR - no IF/TA No SCR - IF/TA , 9 Cum. Survival SCR - IF/TA , 8 , 7 no SCR - IF/TA , 6 SCR - IF/TA , 5 0 50 100 150 Time (months) 200 250
 P")
Clinical variables and death censored graft survival Variable Univariate Multivariate RR (95% CI) P RR (95% CI) p Donor age 1. 013 (1. 002 -1. 025) 0. 027 1. 02 (1. 007 -1. 034) 0. 003 Recipient age 0. 98 (0. 97 -0. 99) 0. 015 0. 97 (0. 95 -0. 98) 0. 001 PRA (%) 1. 014(1. 007 -1. 021) 0. 000 1. 011 (1. 003 -1. 020) 0. 008 GFR (ml/min) 0. 97 (0. 96 -0. 99) 0. 000 0. 98 (0. 96 -0. 99) 0. 009 HCV (pos) 2. 29 (1. 49 -3. 52) 0. 000 1. 62 (0. 99 -2. 67) ns Proteinuria mg/d 1. 001 (1. 000 -1. 002) 0. 041 1. 001 (1. 000 -1. 001) ns SCR-IF/TA 1. 92 (1. 18 -3. 12) 0. 009 1. 75 (1. 06 -2. 89) 0. 029

Is it worth to include histology in multivariate models to predict graft survival?

The contribution of histology to predict death-censored graft failure Model 1 Clinical variables Donor age Recipient age, PRA, GFR Model 2 Clinical + histological variables Donor age Recipient age PRA GFR Histology

The contribution of histology to predict death-censored graft failure Model 1 Clinical variables Donor age Recipient age, PRA, GFR Model 2 Clinical + histological variables Donor age Recipient age PRA GFR Histology

The contribution of histology to predict death-censored graft failure Donor age Recipient age PRA GFR Histology years % ml/min/1. 73 m 2 yes/no

First classification of acute rejction

The contribution of histology to predict death-censored graft failure Donor age Recipient age PARA GFR Histology years % ml/min yes/no risk
=H 0(t) x exp")
Beta coefficient of Cox regression model to calculate risk scores H(t)=H 0(t) x exp (β 1 x 1+ β 2 x 2+ β 3 x 3+…+ βkxk) Variable β coefficient without histology with histology __________________________ Donor age (year) Patient age (year) GFR (ml/min) PARA (%) +0. 020 -0. 035 -0. 024 +0. 011 (+2. 0) (-3. 5) (-2. 4) (+1. 1) +0. 020 -0. 035 -0. 022 +0. 011 (+2. 0) (-3. 5) (-2. 2) (+1. 1) SCR&IF/TA n. a. +0. 559 (+55. 9) __________________________

Beta coefficient of Cox regression model to calculate risk scores Risk score without histology=(2*Donor age)+ (-3. 5*patient age)+ (-2. 4*GFR)+ (1. 1*PRA) Risk score with histology=(2*Donor age)+ (-3. 5*patient age)+ (-2. 2*GFR)+(1. 1*PRA)+(55. 9*SCR&IF/TA)

Classification of patients according to risk scores Q 1 Q 2 Q 3 Q 4 Risk score

Without histology With histology Q 1 Q 2 Q 3 Q 4 Q 1 99 5 1 O Q 2 6 92 6 2 Q 3 0 9 81 16 Q 4 0 0 18 87 p<0. 0001

Changes in quartile classification due to inclusion of histology in the statistical model: 15%

Death censored graft failure using quartiles of risk scores Without histology With histology 1 1 Q 1 , 8 , 6 Q 3 , 4 Q 2 Cum. Survival Q 2 , 6 Q 3 , 4 Q 4 , 2 0 0 0 50 100 150 Time 200 250 months

Validation Modelling sample Testing sample

TWO BIOPSIES <6 m and 12 -24 m N=231
")
Two sequential biopsies N=231 6 m 12 -24 m _______________________ Time of biopsy (M) 4. 3± 1. 7 16. 5± 6. 0 GFR ml/min/1. 73 m 2 53± 14 52± 15 ns Proteinuria g/d 0. 30± 0. 21 0. 37± 0. 49 0. 01 _______________________

Acute score P=0. 003 Chronic score P=0. 0001

Reliability of IF/TA diagnosis Protocol Bx N I II III 2 nd without 2 nd with IF/TA ___________________ 1 st without IF/TA 54 (34. 8%) 39 (25. 2%) progression 1 st with IF/TA 19 (12. 2%) 43 (27. 7%) regression ___________________ Serón D et al. KI 2002; 61: 727

Error associated with the diagnosis of IF/TA in sequential protocol biopsies Progression to IF/TA Regression of IF/TA 25. 2% 12. 2% Sampling + intraobserver error 25% Serón D et al. KI 2002; 61: 727

Two sequential Bx 1 st diagnosis 2 nd. Bx 2 nd diagnosis Integrated diagnosis Prediction of graft survival

Interpretation of sequential protocol biopsies in terms of prognosis and clinical implications Normal 2 nd SCR 2 nd IF/TA 2 nd SCR+IFTA 2 nd 53 5 34 16 SCR 1 st 15 4 12 7 IF/TA 1 st 16 1 26 9 SCR+IF/TA 1 st 9 1 15 8 Normal 1 st normal SCR IF/TA + SCR
 (n = 231) 1 p=0. 04 No IF/TA -")
Two sequential biopsies (integrated diagnosis) (n = 231) 1 p=0. 04 No IF/TA - no SCR , 9 Cum. Survival No IF/TA - SCR , 8 IF/TA - no SCR , 7 IF/TA - SCR , 6 , 5 0 50 100 150 Time 200 250 300
 Early Late 1 1 P = 0. 12 ,")
Early and late biopsies (n=231) Early Late 1 1 P = 0. 12 , 9 , 8 , 7 , 6 , 5 0 50 100 150 200 250 300 P = 0. 29 0 50 100 250 300 Time No. SCR-no. IF/TA 150 SCR-no. IF/TA No SCR-IF/TA

Comments Histology contributes to better define patients at risk for graft failure Two sequential biosies done 1 year apart increase the predictive value of histology on graft failure

Acknowledgements F Moreso D Hernandez M Hueso C Fernandez Gamiz M Gomà JM Cruzado O Bestard JM Grinyo M Carrera
- Slides: 59