Interpretation of Data Interpretation of data Although the


 and")


")


- Slides: 16
Interpretation of Data
Interpretation of data Although the information contained in charts and diagrams is normally clear, it usually requires some written comment It is usual to introduce the information with a general comment and then describe or comment on the most significant or important information
Vocabulary aid As can be seen/according to/as it is shown in/it can be seen from (the chart, diagram, table, graph) From the table/figures/data/results/information it can be concluded/seen/estimated/calculated
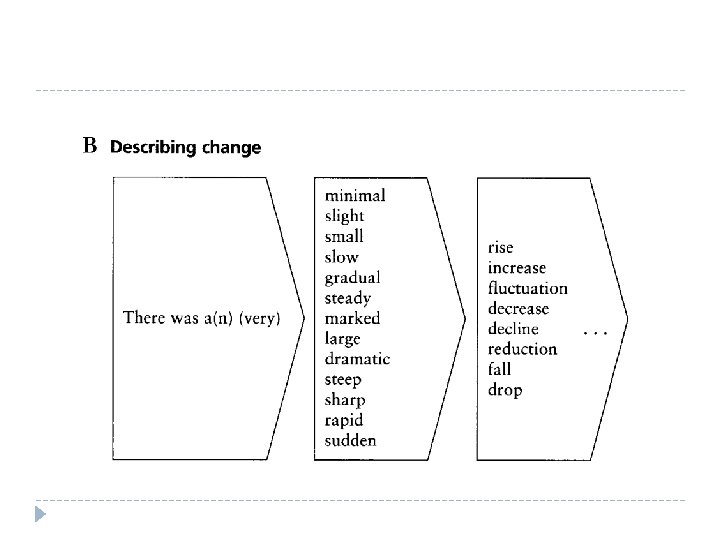
Describing change There was a minimal/slight/small/slow/gradual/steady/marked/larg e/ dramatic/sharp/rapid/sudden (rise, fluctuation, decrease, decline, reduction, fall, drop)
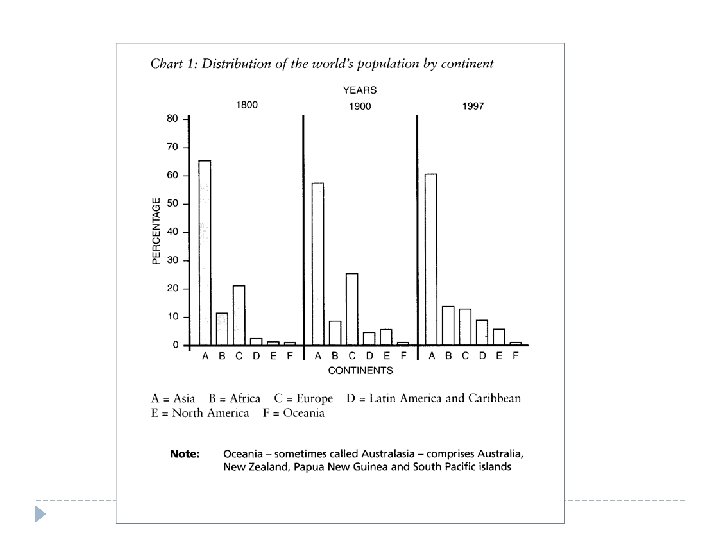
Exercise Look at the Chart 1 (Distribution of the world’s population by continent) and comment on the percentage of the world’s population living in Europe in 1900 using the information from the chart
Suggested answer As can be seen from the chart, Europe had the second-largest population in 1900. It accounted for 25% of the world’s population in that year, while Asia accounted for more than 50%. It had a considerably larger population than Africa, Latin America, North America and Oceania.
Exercise Comment the information in the graph 1: Population of the UK Estimate the UK population for the year 2021. Base your prediction on the trend shown in the graph:
Suggested answer As can be seen from the graph 1, during the period 1811 to 1991 there was a steady increase in the population growth in the UK. At the beginning of the period the population was around 13 million and by the end it had grown to 56 million. The fastest growth was recorded from 1811 to 1911; thereafter, the growth was more gradual. On the basis of the information from the graph, it can be prediected that the population of the UK will continue to grow gradually.
DESCRIPTION Describe the population of your country and its trend.
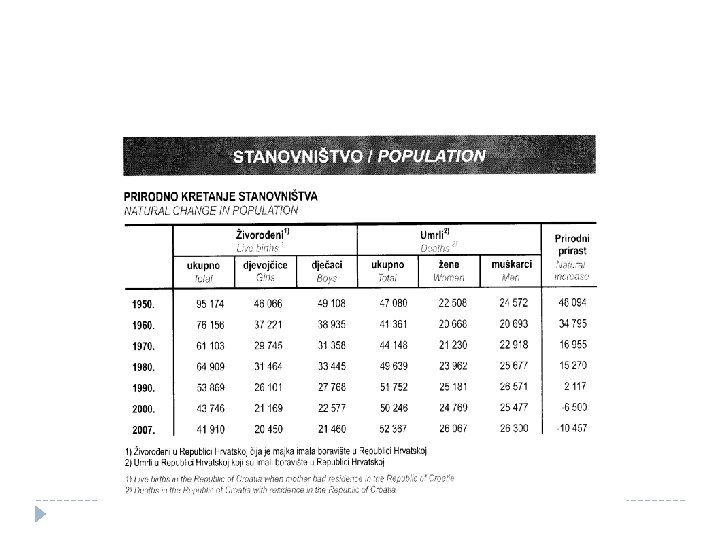
Suggested answer The diagram shows the numbers of live births and deaths in the period from 1950 to 2007. The total number of deaths remained close to 50, 000 throughout the period. An exception is the period around 1960 which recorded particular lows of slightly above 40, 000, but the trend soon recovered. As concerns live births, the situation is vastly different. In the period of 57 years, the number of live births dropped dramatically from as many as 95, 000 in 1950 to slightly over 40, 000 in 2007. The decrease has been relatively steady.
Generalised comments Look at Diagram 2: Average weekly expenditure per family in Britain (1996) and write generalised comments
Comment the following trends in expenditure:
Thank you for your attention!