Interpretation of Arterial Blood Gases Indications Diagnosis Clinical

Interpretation of Arterial Blood Gases

Indications • Diagnosis • Clinical Monitoring • Effect of Changes in Therapy

Information Obtained from an ABG: • Acid base status: p. H, – Metabolic Acid base indices : HCO 3 -, BE (base excess) – Respiratory Acid base index : Pa. CO 2 • Oxygenation – Oxygen content of blood • Dissolved O 2 (Pa. O 2) • Saturation of hemoglobin (Sa. O 2) • Ventilation [Pa. CO 2]
 2)")
The Key to Blood Gas Interpretation: Four Equations, Three Physiologic Processes Equation 1) 2) 3) 4) Pa. CO 2 equation Alveolar gas equation Oxygen content equation Henderson-Hasselbalch equation Physiologic Process Alveolar ventilation Oxygenation Acid-base balance These four equations, crucial to understanding and interpreting arterial blood gas data

Pa. CO 2 equation: Pa. CO 2 reflects ratio of metabolic CO 2 production to alveolar ventilation VCO 2 x 0. 863 Pa. CO 2 = VCO 2 = CO 2 production --------VA VA = VE – VD VE = minute (total) ventilation VD = dead space ventilation 0. 863 converts units to mm Hg Pa. CO 2 >45 mm Hg 35 - 45 mm Hg <35 mm Hg Condition in blood Hypercapnia Eucapnia Hypocapnia State of alveolar ventilation Hypoventilation Normal ventilation Hyperventilation
")
Oxygenation Indices: No click • O 2 Content of blood (Ca. O 2 ) – (O 2 carried by Hb) + (O 2 in solution) – = (1. 34 x Hb x Sa. O 2 x 0. 01) + (0. 023 x Pa. O 2) • (Sp. O 2) = 100%, Hb = 15 g/100 ml and (Pa. O 2) = 13. 3 k. Pa, • (Ca. O 2) is: 20. 1 +0. 3 = 20. 4 ml/100 ml • Alveolar / arterial gradient of oxygen tension – (A-a gradient = PAO 2 − Pa. O 2) – Useful to classify respiratory failure (O 2 carried by Hb)
 • • Normal value in healthy adult breathing")
Arterial Oxygen Tension (Pa. O 2) • • Normal value in healthy adult breathing room air at sea level 97 mm Hg. progressively with age Dependant upon 1. Fi. O 2 2. Patm Hypoxemia is Pa. O 2 < 80 mm Hg at RA

Acceptable Pa. O 2 Values on Room Air Age Group Adults upto 60 yrs & Children Newborn 70 yrs 80 yrs 90 yrs Accepable Pa. O 2 (mm Hg) > 80 40 -70 > 60 > 50 60 yrs 80 mm Hg 1 mm Hg/yr
 Predicted Min Pa.")
Inspired O 2 – Pa. O 2 Relationship FIO 2 (%) Predicted Min Pa. O 2 (mm Hg) 30 150 40 200 50 250 80 400 100 500 Fi. O 2 × 5 = Pa. O 2 If Pa. O 2 < FIO 2 x 5, pt probably hypoxemic at RA
 where")
Alveolar Gas Equation PAO 2 = PIO 2 - (Pa. CO 2 /RQ) where PAO 2 is the average alveolar PO 2, and PIO 2 is the partial pressure of inspired oxygen in the trachea RQ or respiratory coefficient (0. 8)= CO 2 eliminated / O 2 consumed PIO 2 = FIO 2 (PB – 47 mm Hg) FIO 2 is fraction of inspired oxygen and PB is the barometric pressure. 47 mm Hg is the water vapor pressure at normal body temperature.
O 2 Room Air O 2 = 21 % =159 mm.")
Alveolar-arterial Difference - P(A-a)O 2 Room Air O 2 = 21 % =159 mm. Hg Inspired O 2 pi. O 2 = (760 -47) x. 21 = 150 mm. Hg O 2 CO 2 palv. O 2 = pi. O 2 – pa. CO 2 / RQ = 150 – 40 / 0. 8 = 150 – 50 = 100 mm H Pa. O 2 = 90 mm. Hg Palv. O 2 – part. O 2 = 10 mm. Hg {Normal P(A-a)O 2 ranges from @ 5 to 25 mm Hg breathing room air (it increases with
O 2 • P(A-a)O 2 does not actually result from an O 2 pressure")
P(A-a)O 2 • P(A-a)O 2 does not actually result from an O 2 pressure gradient in the lungs. • Instead, it results from gravity-related blood flow changes within the lungs (normal ventilation-perfusion imbalance). • Except for right to left cardiac shunts, an elevated P(A-a)O 2 signifies some sort of problem within the lungs.

No click Alveolar- arterial Difference Oxygenation Failure WIDE GAP Ventilation Failure NORMAL GAP pi. O 2 = 150 p. CO 2 = 80 Pa. O 2 = 45 pi. O 2 = 150 p. CO 2 = 40 Pa. O 2 = 45 palv. O 2 = 150 – 40/. 8 = 150 -50 = 100 P(A-a)O 2 = 100 - 45 = 55 O 2 CO 2 palv. O 2= 150 -80/. 8 =150 -100 = 50 P(A-a)O 2 = 50 - 45 = 5 PAO 2 => PIO 2 - (Pa. CO 2 /RQ) PIO 2 =(760 – 47) x Fi. O 2= 713 x. 21 = 150 - ( Pa. CO 2 /. 8 )

RULES OF PHYSICAL CHEMISTRY • Electrical neutrality: In aqueous solutions, in any compartment the sum of all the positively charged ions must equal the sum of all the negatively charged ions. • Dissociation equilibriums: The dissociation equilibriums of all incompletely dissociated substances, as derived from the law of mass action, must be satisfied at all times. • Mass conservation: The amount of a substance in a given compartment remains constant unless it is added, removed, generated, or destroyed. The total concentration of an incompletely dissociated substance is the sum of concentrations of its dissociated and undissociated forms.

APPROACHES TO ACID-BASE BALANCE • descriptivebased on changes in the Henderson-Hasselbalch equation; uses the interrelationship between Pco 2 and [HCO − 3 ] to detect and diagnoseacid-base abnormalities. • semiquantitativebased on calculations and nomograms bufferbase concept, uses the standardized base deficit-excess, and the basedeficit gap. • Quantitativebased on physical chemistry. uses SID and ATOT and is quantified using the strong ion gap (SIG).

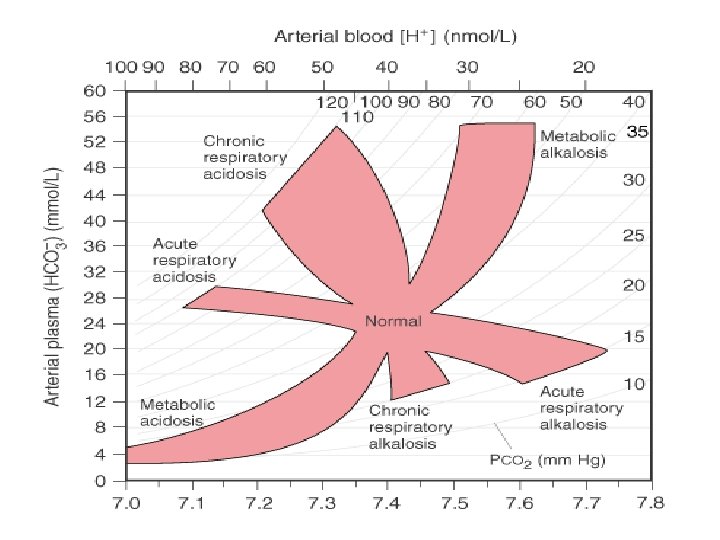
BOSTON APPROACH • Their formulation uses acid-base maps and the mathematic relationship between CO 2 tension and serum HCO 3 -(or total CO 2), derived from the Henderson-Hasselbalch equation to classify acid-base disturbances in terms of two independent variables: Paco 2 and [HCO 3−]

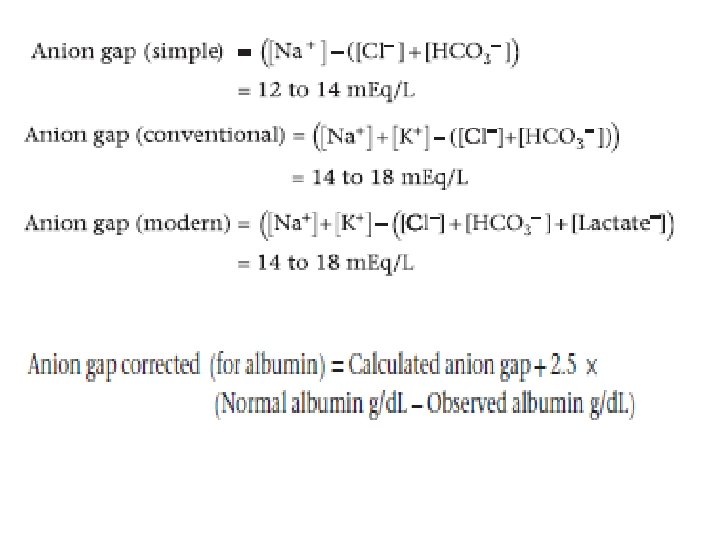
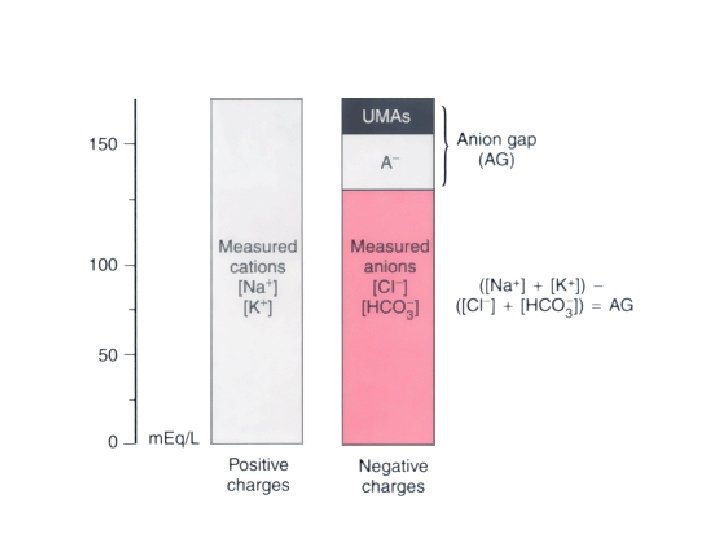
ANION GAP APPROACH • Developed by Emmet and Narins in 1975. • Based on the law of electrical neutrality. • The anion gap represents the difference in charge between measured cations and measured anions. • The missing negative charge is made up of weak acids (A−), such as albumin and phosphate, and strong unmeasured anions (UMAs), such as lactate.

DELTA ANION GAP


COPENHAGEN APPROACH • The buffer base represented the sum of the HCO− 3 and the nonvolatile buffer ions (essentially the serum albumin, phosphate, and hemoglobin). • Applying the law of electrical neutrality buffer base = [Na+] + [K+] − [Cl−] • buffer base increases in metabolic alkalosis and decreases in metabolic acidosis.
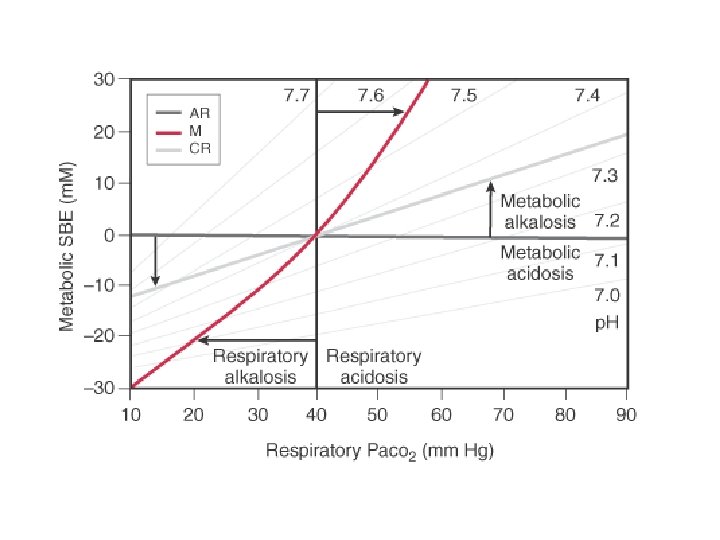

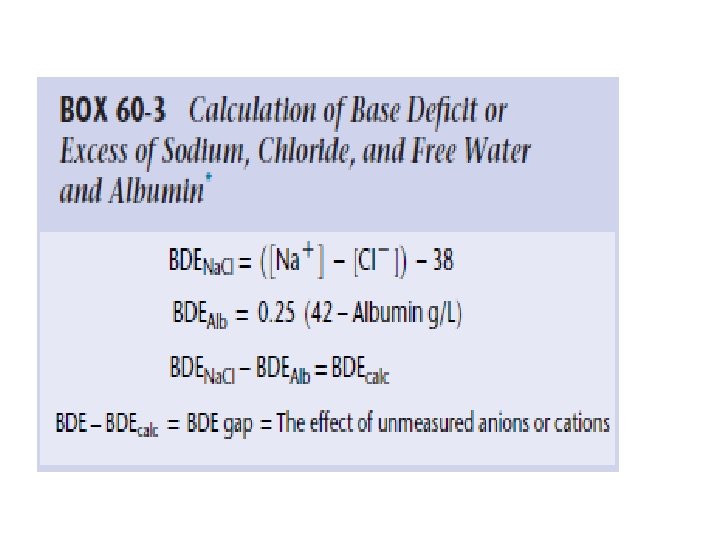
• the BDE is the amount of strong acid or base required to return the p. H to 7. 4, assuming that Pco 2 is constant at 40 mm Hg and that the temperature is 37° C.

CHANGES IN STANDARD BASE DEFICIT OR EXCESS IN RESPONSE TO ACUTE AND CHRONIC ACID-BASE DISTURBANCES Disturbance SBDE versus Paco 2 Acute respiratory acidosis ΔBDE = 0 Acute respiratory alkalosis ΔBDE = 0 Chronic respiratory acidosis ΔBDE = 0. 4 ΔPaco 2 Metabolic acidosis ΔPaco 2 = ΔBDE Metabolic alkalosis ΔPaco 2 = 0. 6 ΔBDE

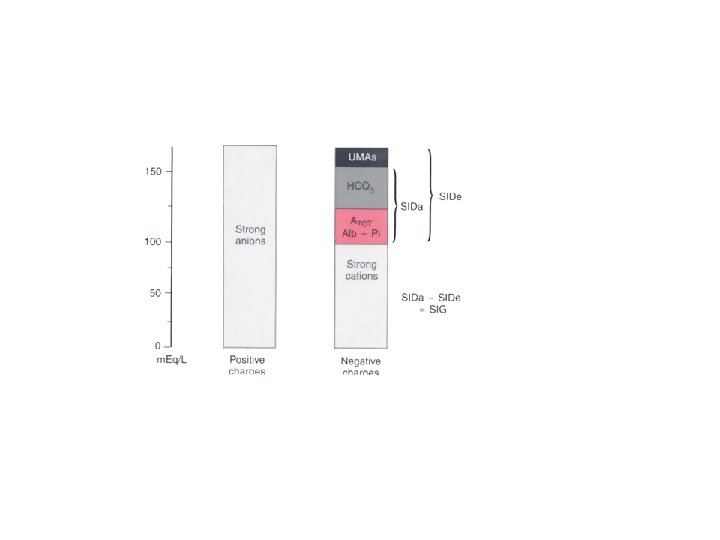
STEWART-FENCL APPROACH Plasma p. H is dependent on the following three independent variables: • 1. Pco 2 (the plasma CO 2 tension) • 2. Atot, the total plasma concentration of all nonvolatile buffers (albumin, globulins, and PO 43−) • 3. Strong ion difference (SID),
![SIDa =([Na + ]+[K + ]+[Mg 2 +]+[Ca 2 +])-[Cl − ] SIDe =](http://slidetodoc.com/presentation_image/0d924f4828dda7d77cb10b66ddeb39b7/image-30.jpg "SIDa =([Na + ]+[K + ]+[Mg 2 +]+[Ca 2 +])-[Cl − ] SIDe =")
SIDa =([Na + ]+[K + ]+[Mg 2 +]+[Ca 2 +])-[Cl − ] SIDe = [HCO 3− ] +[Charge on albumin] + [Charge on Pi] (in mmol/L) SIG = SIDa − SIDe normal” SIG is 8 ± 2 m. Eq/L.

CLASSIFICATION OF PRIMARY ACID-BASE ABNORMALITIES Abnormality Respiratory Metabolic Abnormal SID Caused by water excess or deficit Acidosis Increased Pco 2 Water excess = dilutional Alkalosis Decreased Pco 2 Water deficit = contraction ↓ SID + ↓ [Na+] ↑ SID ↑ [Na+] Caused by electrolytes Chloride excess Chloride deficit Chloride (measured) ↓ SID ↑ [Cl−] ↑ SID + ↓ [Cl−] Other (unmeasured) anions, such as ↓ SID ↑ [UMA−] — lactate and keto acids Abnormal ATOT Albumin [Alb] ↑ [Alb] (rare) ↓ [Alb] Phosphate [Pi] ↑ [Pi]

A stepwise approach to acid-base disorders 1. Is the patient acidemic or alkalemic? 2. Is the overriding disturbance respiratory or metabolic? 3. If respiratory… is it acute or chronic? 4. Calculate the Expected degree of Compensation? 5. If metabolic… is there an high anion gap? 6. For an increased anion gap metabolic acidosis, are there other derangements?

A stepwise approach to acid-base disorders Step 1. Is the patient acidemic or alkalemic? TO determine whether the patient is acidemic (p. H < 7. 35) or alkalemic (p. H > 7. 45) Step 2. Is the overriding disturbance respiratory or metabolic? Øwhether the primary process is metabolic (initiated by a change in HCO 3 -) Øor respiratory (initiated by a change in Pa. CO 2)

Step 3. If respiratory… is it acute or chronic? Acute, p. H should change 0. 08 (p. CO 2 -40) / 10 (for every 10 mm Hg change in Pa. CO 2) Chronic, p. H should change 0. 03 (p. CO 2 -40) / 10 (for every 10 mm Hg change in Pa. CO 2) So. . if the p. CO 2 is 80 mm Hg Ø if acute the change is 80 – 40/10 = 4 the p. H should change by 0. 08 (4) = 0. 32 [p. H =7. 4 -3. 2=7. 08] Ø if chronic the p. H should change by 0. 03 (4) = 0. 12 [p. H =7. 4 -1. 2=7. 28]

Step 4. Calculate the Expected degree of Compensation Disorder Respiratory acidosis Acute Chronic Compensatory response [HCO 3 -] 1. 0 meq/L per 10 mm. Hg Pco 2 3. 0 meq/L per 10 mm. Hg Pco 2 Respiratory alkalosis Acute Chronic [HCO 3 -] 2. 0 meq/L per 10 mm. Hg Pco 2 4. 0 meq/L per 10 mm. Hg Pco 2 Metabolic acidosis Metabolic alkalosis PCO 2 =(1. 5 X HCO 3 -) + 8± 2 (Winter’s equation) ( in maximally compensated met. acidosis PCO 2 Should be the last 2 digits of arterial Ph ) PCO 2 0. 7 mm. Hg per 1. 0 meq/L HCO 3 -

Measure the urinary chloride concentration • Chloride sensitive- urinary Cl- < 10 m. Eq/L – Volume depletion with loss of Cl- – • Renal - diuretics, & • GIT - vomiting & continuous loss of gastric secretions • Chloride resistant – > 20 m. Eq/L Mineralo corticoid excess – cushing syn, hyper aldosterinism & bartters syn

Step 5. If metabolic… is there an high anion gap? AG based on principle of electroneutrality: • Total Serum Cations = Total Serum Anions • Na+ + (K+ + Ca++ + Mg++) = HCO 3 - + Cl- + (PO 4 -- + SO 4 -- + Protein + Organic Acids) • Na+ + (UC)= HCO 3 - + Cl- + UA • Na+– (HCO 3 - + Cl-) = UA – UC = AG • =144 -(24+108)=10 m. EqL A normal anion gap is 12+/- 4 ↑AG UA rise or UC fall Unmeasured cations =UC Unmeasured anions =UA

Corrected anion gap • Hypoproteinamia common in critical illness • Albumin has a lot of negative charge • Low albumin will reduce the ‘normal’ gap : 12 4 • Therefore in severe hypoalbuminemia if AG is normal, one must suspect an additional metabolic cause for increased AG • Albumin Gap = 40 – apparent albumin • Anion Gapcorr = AG + (albumin gap/4) • Or. . . Reduce AG by 2. 5 for every 10 mmol/l fall in Albumin from baseline

Evaluation of Met Acidosis • • SERUM AG URINARY AG Total Urine Cations = Total Urine Anions Na + K + (NH 4 and other UC) = Cl + UA (Na + K) + UC = Cl + UA (Na + K) – Cl = UA – UC (Na + K) – Cl = AG • • Normal UAG -10 to +10.
![• PLASMA OSMOLAL GAP – Calc P Osm = 2[Na+] + [Gluc]/18 +](http://slidetodoc.com/presentation_image/0d924f4828dda7d77cb10b66ddeb39b7/image-41.jpg "• PLASMA OSMOLAL GAP – Calc P Osm = 2[Na+] + [Gluc]/18 +")
• PLASMA OSMOLAL GAP – Calc P Osm = 2[Na+] + [Gluc]/18 + [BUN]/2. 8 N Meas P Osm > Calc P Osm (upto 10 m. Osm/kg) Meas P Osm - Calc P Osm > 15 -20 m. Osm/kg presence of abn osmotically active substances (usually an alcohol) • URINE OSMOLAL GAP - similar to P. Osm gap Calc U Osm = 2[(Na+u ) + (K+u)] + [Gluc u]/18 + [UUN]/2. 8 Meas P Osm > Calc P Osm excretion of NH 4+ with non Cl- anion (e. g. hippurate) [NH 4+ u] usually 50% of osmolal gap

Step 6: For an increased anion gap metabolic acidosis, are there other derangements? Delta ratio = ∆ Anion gap/∆ [HCO 3 -] or ↑anion gap/ ↓ [HCO 3 -] = Measured anion gap – Normal anion gap = (AG – 12) Normal [HCO 3 -] – Measured [HCO 3 -] (24 - [HCO 3 -]) AG/ HCO 3 - = 1 -2 Pure High AG Met Acidosis AG/ HCO 3 - > 2 Assoc Met Alkalosis AG/ HCO 3 - < 1 Assoc N AG Met Acidosis Based on assumption that for each 1 meq/L increase in AG, HCO 3 will fall by 1 meq/L.

Capnography

Terminology • Capnography : graphic display of instataneous CO 2 Vs time ( time capno) or vs volume (volume capno) • Capnograph : machine that generates waveform • Capnogram : actual waveform • Capnometer : measuring device

Physics Methods to measure CO 2 levels include : infrared spectrography Raman spectrography, mass spectrography, photoacoustic spectrography and chemical colorimetric analysis.

CONT. . • Infrared rays are absorbed by non-elementary gases (i. e. those composed of dissimilar atoms). • The intensity of IR radiation projected through a gas mixture containing CO 2 is diminished by absorption; this allows the CO 2 absorption band to be identified and is proportional to the amount of CO 2 in the mixture.

The Effect of Atmospheric Pressure on CO 2 • An increase in pressure proportionately increases the number of IR absorbing CO 2 molecules and thereby increases the CO 2 signal. • This effect is eliminated by calibrating the capnograph with a known partial pressure of the CO 2 gas (mm. Hg=vol%* atmospheric pressure) using a commercially available calibrating gas. The influence of water vapor • Water vapor in expired air (at 37 o. C) condenses at lower room temperature on sampling tube walls. • Water has a high IR absorbance : erroneous results • Effective water trap system : necessary

Types of Capnographs

Mainstream Vs Sidestream Mainstream • • More accurate Quick response & no delay No sample tube Cannot be used in spontaneous breathing Risk of burns Circuit disconnection Dead space Only CO 2 Sidestream Less accurate Transport Delay Sample tube blockade Can be used in spontaneous breathing • Requires scavenging & addition of gases as it takes gas from circuit • Does not add dead space • CO 2 , N 2 O • •

Correlation b/w arterial & end tidal CO 2 • • • ü ü ü • Usually end tidal less than arterial (gradient is positive) Gradient negative : obese, pregnants (d/t low FRC) For Et. CO 2 to reflect Pa. CO 2 accurately Increase exp time Decrease fresh gas flows Add dead space b/w the breathing system & gas sampling pt Hypothermia-decreases soubility of gas (increased gradient)
")
Normal capnogram Alpha angle: Increased – airway obstruction (all alveoli do not empty simultaneously) Decreased – obstructive lung diseases (slow exhalation of dead space volume) Beta angle: Increased- rebreathing Decreased-if slope of phase 3 increases

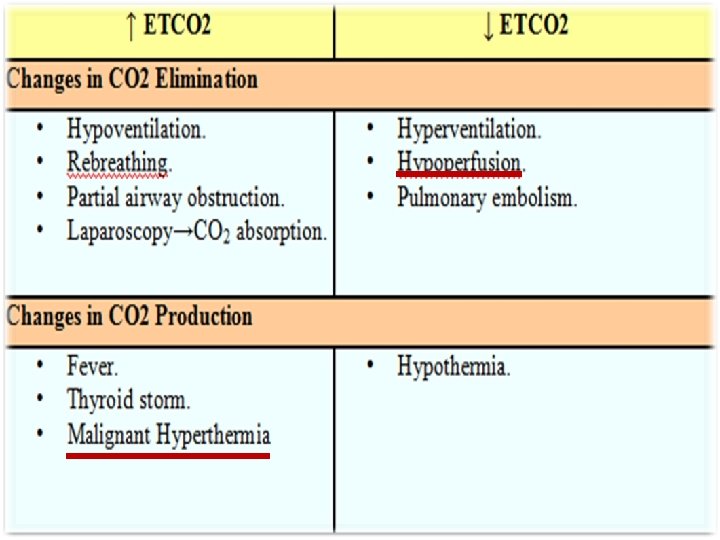
Low Et. CO 2 • Hyperventilation • Increased dead space ventilation High Et. CO 2 • Hypoventilation • Increased CO 2 delivery to the lungs

Curare cleft • Spontaneous breathing in mechanically ventilated pt. • Inadequate reversal • Flail chest • Pnuemothorax • Hiccups Lack of synchrony b/w intercostal muscles & diaphragm

Cardiogenic oscillations Low resp rate Low tidal volumes Low I: E Negative intrathoracic pressure • Muscle relaxation • Low vital capacity : heart size Avoided by giving low PEEP • • Heart beating against lungs Cardiac action causes to-and-fro movement of the interface between exhaled and fresh gas. The CO 2 concentration in gas entering the sampling line therefore alternates between high and low values

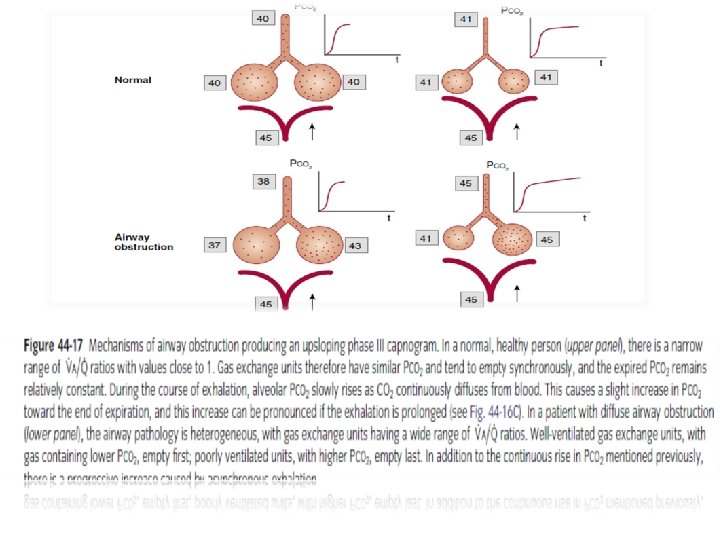
Prolonged expiratory upstroke • • Airway obstruction Bronchospasm COPD Obstructed tracheal tube • Expiration prolonged as all alveoli cannot empty simultaneously • Inspiration begins before exp ends • First, obstructed (slow) lung units with low V/ Q and high Pco 2 empty slower and later than “fast” alveoli with normal V/ Q and low Pco 2. This is manifested as a linear upsloping of phase III instead of the typical “plateau. ” Second, as lung volume decreases during exhalation and CO 2 excretion from capillaries remains constant, Pco 2 slowly rises throughout expiration and causes an upsloping plateau

Elevated baseline Rebreathing • Exhausted absorbent or failure of unidirectional exp valve in circle system • Malfunctioning inner tube of bains • Low flows in mapleson • Rebreathing under drapes in spontaneous breathing Return to spontaneous ventilation

Biphasic wave Severe Kyphoscoliosis • Leak • in sampling line during • Single lung vent transplant positive pressure (not in • Bronchial intubation spontaneous) unilateral hypoventilation, high airway resisitance Reason: thed/tpositive pressure of The first peak represents CO 2 from the transplanted (normal) lung. next inspiration transiently Exhalation end of CO 2 from the remaining (obstructed) lung is delayed, pushes undiluted tidal gas producing through thereby sampling line the second peak

Sudden drop to zero • • • Circuit disconnection Complete tube obstruction Esophageal inutbation Extubation Plugged sample line exponential fall • Sudden hypotension ü Circulatory failure ü Massive blood loss • Obstruction of a major blood vessel • Pulm embolism

Sudden drop non zero • Partial occlusion of tracheal tube • Partial disconnection sudden drop but recovered • Small pulm embolus which resolved spontaneously

Sudden rise with spontaneous resolution • Release of clamps on a major vessel • Release of tourniquet

Volume capnograph In negative Paco 2 -Petco 2 gradient conditions Petco 2 is clearly not an accurate estimate of Paco 2, and the average alveolar Pco 2 obtained from a volume capnograph may be more indicative of Paco 2 Pco 2 vs exhaled volume • The area under the Pco 2 curve is the total volume of CO 2 (Vco 2) exhaled for that single breath

Area under graph=Ve. CO 2 Fe. CO 2=Ve. CO 2/Vt Pe. CO 2=Fe. CO 2*atm pressure vtds= Vt * [(pa. CO 2 -pe. CO 2)/Pa. CO 2] Valv ds=Vtds-Vanatds: from vol capnograph (phase 1)

Advantages of volume capnograph • reliable detection of incompetent inspiratory valve & rebreathing • Good indicator in pulmonary embolism

Clinical aspects of capnography Capnography provides 3 sources of information: - from numbers-PEt. CO 2 values: capnometry, - from shapes of capnograms – capnography - from (a-ET) PCO 2 differences.

Pressure volume loops • Volume is plotted on the y axis and pressure on the x axis (can also be plotted the other way around) • The bottom of the loop will be at the set PEEP level or be at 0 if there is no PEEP set
 Pressure-Volume Loop (Type of Breath) E E I I I Controlled E")
Vol (ml) Pressure-Volume Loop (Type of Breath) E E I I I Controlled E Paw (cm H 2 O) Assisted I: Inspiration E: Expiration Spontaneous
 PEEP Paw (cm H 2 O)")
PEEP and P-V Loop VT Volume (m. L) PEEP Paw (cm H 2 O) PIP

COMPLIANCE Pressure Targeted Ventilation Increased Normal Decreased VT levels Lung Compliance Changes and the P-V Loop Volume (m. L) Paw (cm H 2 O) Preset PIP

Lung Compliance Changes and the P -V Loop Volume Targeted Ventilation Preset VT COMPLIANCE Increased Normal Decreased Volume (m. L) Paw (cm H 2 O) PIP levels
 ELASTIC WORK")
Hysteresis-is the lagging of one of the two associated variable. Volume (ml) ELASTIC WORK Normal Hysteresis Abnormal Hysteresis RESISTIVE WORK INCREASED – OBSTRUCTIVE DISORDERS Pressure (cm H 2 O)

Inflection Points RECOIL CHARACTERISTICS Upper Inflection Point OPENING PRESSURES OF LUNG HIGHER – STIFFER SETTING PEEP AT LIP – OPTIMIZE ALVEOLAR RECRUITMENT Volume (m. L) Lower Inflection Point Pressure (cm H 2 O)

Initial point of inflection : Point of Increase in compliance due to alveolar recruitment as pressure increases Gives an idea about degree of peep to be appiled for adequate recruitment Upper inflection of point : Point of decrease in compliance Due to alveolar overdistension Indicates need to decrease tidalk volume
- Slides: 74