Interpretation and Construction of Topographic Maps Goals of


 Model (Map")
 the “ratio scale” or “unitless scale” 1 : 24,")


- Slides: 23
Interpretation and Construction of Topographic Maps
Goals of the Topographic Map Interpretation Lab • Understand how surface features are expressed on the earth’s surface 1 st • Observe a 2 -dimensional map and “convert” it to a Lab 3 -dimentional relief map • Locate geographical positions using the PLSS system (a legal description) • Students will understand the nature of contour lines and how contour lines can determine: 2 nd surface features Lab river gradients map relief and elevation • Develop skills that enable the student to construct topographic maps and topographic profiles
Topographic Map Lab Types of maps Planimetric Maps – a typical road map with cities Shows streets, roadways “sometimes not very accurate” Topographic Maps – a planimetric map as well as a 3 -d representation of the “lay of the land” converts a 2 -D to a 3 -D map elevations Shows accurate scaling, elevation and geographic locations.
What can one do with a Topographic Map Calculate river gradients Hiking- how rigorous is the trail Hunting – where would game hang out? Navigate your way Interpret various geological features
Interpreting SCALE on a topographic map • Representative Fraction Scale (RF scale) Model (Map size) 1: 18 scale Actual Size 1: 1 scale • Graphic Bar Scale (graphical representation) feet 50 100 150 200 Graphically shows distance • Verbal Scale (what does the map say? ) “What is the map telling you? ? ? ”
Representative Fraction Scale (RF scale) the “ratio scale” or “unitless scale” 1 : 24, 000 or 1/24, 000 – can apply any units (: ) or (/) means equal (=) How does this scale work? (let’s use inches and the scale of 1: 24, 000 1 map inch = 24, 000 real earth inches OR 1 map inch = 2000 feet OR 1” = 2000 feet Which scale shows more map detail? 1: 24, 000 1: 5, 000 1: 1000 1: 525, 000
Graphic Bar Scale: graphical representation of distance 0 0 1 2 3 Kilometers 4 4 Comparing a map distance (from point A to B) to the Bar scale (at the bottom of map) What about a meandering river? ? ? STRING
The Verbal Scale: • The map “tells” you what the scale is (just listen? ) • Usually located at the bottom of the map • ALL verbal scales should match the RF scale and bar scale • Example: • 1 inch equals 2000 feet
Map Orientation – Where does your compass point ? ? Magnetic Declination: True North (Santa Claus) vs. Magnetic North (Santa Claus) Map points to TN X Magnetic Declination (MD) Bakeo Compass needle points to MN EARTH The angle between TN and MN is the magnetic declination Map Symbol TN MD MN
NEWS West North MAP South East
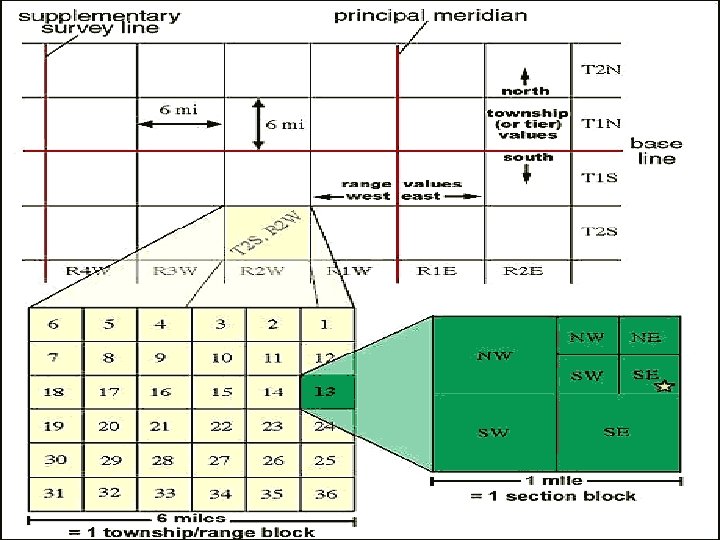
T 1 N R 2 W T 1 S R 3 W T 1 S R 2 W R 3 W R 2 W 1 mile T 1 N R 3 W T 2 N R 1 W T 1 S R 1 W T 2 N R 1 E T 2 N R 2 E T 2 N T 1 N R 1 E T 1 N R 2 E T 1 N T 1 S R 1 E T 1 S R 2 E R 1 W R 1 E Principal Meridian 1 mile NW 1/4 20 SW 1/4 NW ¼ of NE 1/4 SW 1/4 of X NE 1/4 SE ¼ of NE 1/4 Base Line T 1 S 6 miles T 2 N R 2 W T 2 N R 3 W Townships North/South Ranges East/West T 2 N, R 2 E 6 5 4 3 2 1 7 8 9 10 11 12 18 17 16 15 14 13 19 20 21 22 23 24 30 29 28 27 26 25 31 32 33 34 35 36 6 miles Sections SE 1/4 T 2 N, R 2 E, Sec 20, 1/4 NE, 1/4 SW
Creating a Topographic map with Contour Lines Contour line – a line that connects points of equal elevation equal points of elevation 40 40 5 important rules of contour lines 1. Contours line do not cross or divide 2. Contour lines will eventually close – they don’t stop 3. Steep slopes – contour lines are close together Gentle slopes – contour lines are widely spaced 4. Depressions shown with hachures pointing downward 5. Contour lines intersecting streams will always “V” in the upwards direction (streams flow through the open “V”)
Contour lines never cross or divide 100 200 Contour lines eventually close – Don’t stop 50 0
Close together contour lines = STEEP SLOPES Separated contour lines = GENTLE SLOPES Gentle Steep
Depressions are shown with hachures pointing inward Rivers always flow in the direction of the open “V” of a contour line NORTH WEST
The Contour Interval How many contour lines can fit in a determined Space? ? ? The Index contour line – the “dark numbered” elevation line The contour interval – the amount of contour lines in-between the index contour lines 300 Contour Interval = 20 CI = 20 200 500 100 Contour Interval = 100 CI = 100
Calculating the gradient • how steep is the slope? ? Higher slope # = steeper Rise Run Rise = highest elevation – lowest elevation Run = the length (distance) Rise and Run MUST be in the same units preferably “feet”
Making a Topographic Profile • represents a “cross-section” or side view of topography • uses a horizontal and vertical scale • gives the map reader a “picture” of the “lay of the land”. How do you make a Topographic profile ?
• Lay a strip of paper over the topographic area • “Mark off” contour lines that intersect the paper strip – recording their elevations Intersecting contour lines
• Remove strip of paper and place it on graph paper – plot elevation points (on strip) to match vertical scale elevation points potting points on the graph paper Strip of paper
• Outline the topography by “connecting” the dots --- Use your artistic ability to construct a “smooth” picture
B E D C F A