Interpolation vs Extrapolation Evaluating the Model Dependency of


 n Launch")

: Bayesian inference via Markov chain Monte Carlo")


 are model dependent n But how")

 than extrapolation, assuming minimal")


: 124 post-WWII civil wars; study")

 ############################ ## ## What. If (Version 1. 4 -2, built 2006")
 Total Number")
 n Few counterfactuals")


- Slides: 29
Interpolation vs. Extrapolation: Evaluating the Model Dependency of Counterfactuals Using R Heather Stoll Department of Political Science University of California, Santa Barbara
Plan of Attack 1. 2. 3. 4. The methodologist’s dilemma All about R Example: assessing counterfactual model dependency (King and Zeng 2006 a, 2006 b) Implementation via R package What. If (Stoll, King and Zeng 2006)
The Methodologist’s Dilemma You’ve developed cutting edge statistical techniques: Now what?
Three Choices n Assume applied researchers will write their own code to implement new techniques n Wait for commercial software packages to implement them n Costner approach: “Build it and they will come”
All About R
Why R? Open source statistical computing environment n UNIX/LINUX, Windows, and Mac. OS versions n Object-oriented, user-friendly programming language “not unlike” S of SPLUS n Widely used by statisticians and methodologists in many fields n Implements range of statistical and graphical techniques, both commonplace and specialized n
R’s Default Capabilities Linear and nonlinear modeling n Clustering and classification analysis n Classical statistical tests n Non-parametrics n Time series analysis n Matrix and algebraic operations n Publication-quality graphics n And much, much more… n
A Picture is Worth 1000 Words © R Foundation, from www. r-project. org
What the Methodologist Does Write functions to implement techniques n Incorporate functions, sample data sets, help files in a “package”, a mechanism for loading optional code and attached documentation n Build package and make available for download from CRAN and/or personal website n Can also simply make functions available as text files for users to individually input (“source”) into R n
What the User Does Install R from CRAN (http: //www. r-project. org) n Launch R n Type: install. packages(“Package. Name”) and then library(Package. Name) n Call desired functions n And … n
R Add-on packages aa. MIMutual information for protein sequence alignments abind. Combine multi-dimensional arrays accuracy. Tools for testing and improving accuracy of statistical results. acepackace() and avas() for selecting regression transformationsactuar. Actuarial functionsadapt -- multidimensional numerical integration ade 4 Analysis of Environmental Data : Exploratory and Euclidean methodadehabitat. Analysis of habitat selection by animals adlift. An adaptive lifting scheme algorithm agceanalysis of growth curve experimentsakima. Interpolation of irregularly spaced data. Alg. Design alr 3 Methods and data to accompany Applied Linear Regression 3 rd editiamap. Another Multidimensional Analysis Package AMOREA MORE flexible neural network package. Analyze. FMRIFunctions for analysis of f. MRI datasets stored in the ANALYZE foraod. Analysis of Overdispersed Data ape. Analyses of Phylogenetics and Evolutionap. Treeshape. Analyses of Phylogenetic Treeshape. Ar. Dec. Time series autoregressive decompositionarules. Mining Association Rules and Frequent Itemsetsash. David Scott's ASH routinesassist. A Suite of S-Plus Functions Implementing Smoothing Splines aster. Aster Modelsasypow. Calculate Power Utilizing Asymptotic Likelihood Ratio Methods aws. Adaptive Weights Smoothing. BACCOBundle of emulator, calibrator bayesm. Bayesian Inference for Marketing/Micro-econometrics bayesmix. Bayesian Mixture Models with JAGSbayes. Surv. Bayesian Survival Regression with Flexible Error and Random Effec. Bayes. Tree. Bayesian Methods for Tree Based Modelsbaymvb. Bayesian analysis of multivariate binary data betareg. Beta Regression. Bhat. General likelihood exploration. BHH 2 Useful Functions for Box, Hunter and Hunter II bicreduc. Reduction algorithm for the NPMLE for the distribution function obim. Bayesian Interval Mapping Diagnostics bindata. Generation of Artificial Binary Data. Biodemography functionsbiopara. Self-contained parallel system for R bitops. Functions for Bitwise operationsbivpois. Bivariate Poisson Models Using The EM Algorithm blighty. United Kingdom coastlines. BMABayesian Model Averaging boa. Bayesian Output Analysis Program (BOA) for MCMC Bolstad functions boolean. Boolean logit and probitboost. Boosting Methods for Real and Simulated Data boot. Bootstrap R (SPlus) Functions (Canty)bootstrap. Functions for the Book "An Introduction to the Bootstrap" bqtl. Bayesian QTL mapping toolkit Bradley. Terry. Bradley-Terry modelsbrlr. Bias-reduced logistic regression. BRugs. Open. BUGS and its R interface BRugs BSDABasic Statistics and Data Analysis Bs. MDBayes Screening and Model Discrimination butler. Unit testing, profiling and benchmarking for Rcalibrate. Calibration of Biplot Axes ca. Mass. Class. Processing & Classification of Protein Mass Spectra (SELDI) Data car. Companion to Applied Regression cat. Analysis of categorical -variable datasets with missing valuesca. Tools. Miscellaneous tools: I/O, moving window statistics, etc. catspec. Special models for categorical variables cba. Clustering for Business Analyticscclust. Convex Clustering Methods and Clustering Indexes. CDNmoney. Components of Canadian Monetary Aggregatescfa. Analysis of configuration frequencies (CFA)CGIwith. RCGI Programming in Rchange. LOSChange in LOSchplot. Augmented Convex Hull Plots…
Recent Poli. Sci R Packages MCMCpack (Quinn): Bayesian inference via Markov chain Monte Carlo n Anchors (Wand): Analyzing survey data with anchoring vignettes n eco (Imai and Lu): Bayesian ecological inference in 2 x 2 tables n Matching (Sekhon): Multivariate and propensity score matching software for causal inference n
Counterfactual Model Dependency
What would happen if pigs could fly? n Much social science inference is counterfactual The first known attempt to answer this question was in 1909 by J. T. C. Moore. Brabazon, who earlier the same year was the first British pilot to fly in Britain. On the left is Moore-Brabazon in his personal French-built Voisin aero plane. On the right is a pig in a wicker basket behind a sign that says "I am the first pig to fly. "
The Problem n Counterfactuals far from data (unrealistic) are model dependent n But how far is too far? n Model dependence usually studied via sensitivity analyses but this has many drawbacks Example of extreme model dependence for out-of-sample predictions
Assessing Dependence via Distance n Two procedures for assessing distance of counterfactual from data: 1. 2. n Determine whether counterfactual involves extrapolation or interpolation Calculate proportion of observations “nearby” counterfactual using Gower’s non-parametric (or any other) distance metric Neither requires sensitivity analyses of any sort
Interpolation vs. Extrapolation n n Interpolation less model dependent (safer) than extrapolation, assuming minimal smoothness of conditional expectation function Interpolation = counterfactual vector x falls in convex hull of data, X; extrapolation = x outside of convex hull of X Convex hull well-known, but computationally difficult to identify; also hard to determine membership No existing implementations for high dimensional data common in social science research
Convex Hulls Source: Wikipedia Source: http: //www. ifor. math. ethz. ch/ ~fukuda/polyfaq. html
Solution n Check whether or not x can be expressed as convex combination of all points in X; bypass identification of hull n Done by checking if feasible solution to standard form linear programming problem with degenerate objective function exists n Computationally efficient even for large n and k; makes use of existing algorithms
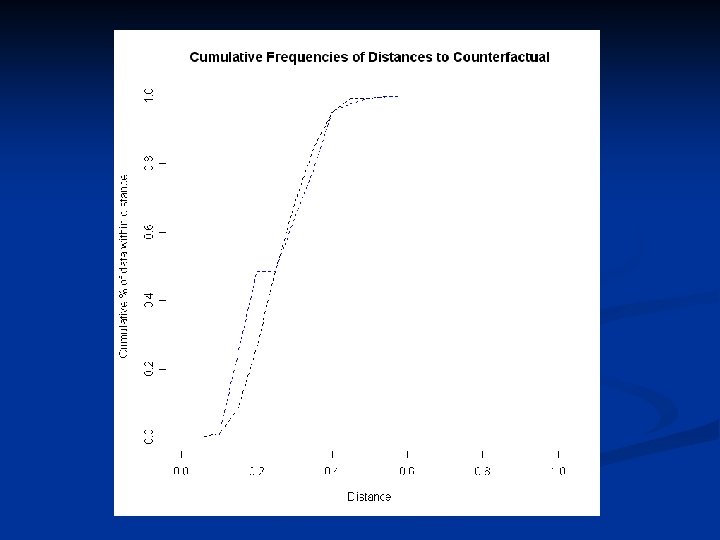
Gower’s Distance n n Sometimes may want to make finer distinction Measure distance between each observation and counterfactual using Gower’s metric Interpretation of G 2 = distance between two points as percentage of distance across X Summarize n values of G 2 for each counterfactual by: 1. 2. Plotting empirical CDF Calculating percentage of observations “nearby” counterfactual (e. g. , G 2 less than geometric variability of X)
Implementation: R package What. If
Example: UN Peacekeeping n n Doyle and Sambanis (2000): 124 post-WWII civil wars; study contribution of UN peacekeeping operations to peacebuilding success Counterfactuals of interest: for civil wars with UN involvement, how much success if UN had not gotten involved? For civil wars without UN involvement, how much success if UN had? Construct counterfactual dataset from factual by replacing dummy UN involvement variable with 1 variable; other 10 covariates kept as is Analyze using What. If
R : Copyright 2005, The R Foundation for Statistical Computing Version 2. 2. 1 (2005 -12 -20 r 36812) ISBN 3 -900051 -07 -0 R is free software and comes with ABSOLUTELY NO WARRANTY. You are welcome to redistribute it under certain conditions. Type 'license()' or 'licence()' for distribution details. Natural language support but running in an English locale R is a collaborative project with many contributors. Type 'contributors()' for more information and 'citation()' on how to cite R or R packages in publications. Type 'demo()' for some demos, 'help()' for on-line help, or 'help. start()' for an HTML browser interface to help. Type 'q()' to quit R.
> library(What. If) ############################ ## ## What. If (Version 1. 4 -2, built 2006 -01 -23) ## Complete documentation available from http: //gking. harvard. edu/whatif ## ############################ > data(peacef) > data(peacecf) > my. result <- whatif(data = peacef, cfact = peacecf) Loading required package: lp. Solve > summary(my. result) > plot(my. result, numcf = 1, type = “b”)
Summary of Counterfactual Inference Analysis Call: whatif(data = peacef, cfact = peacecf) Total Number of Counterfactuals: 122 Number of Counterfactuals in Convex Hull: 0 Average Percent 'Nearby': 0. 01303413 Counterfactual in Convex Hull, True or False, and Percentage of Observed Data Points 'Nearby' Counterfactual: Counterfactual In Hull Percent Nearby 1 FALSE 0. 008196721 2 FALSE 0. 008196721 3 FALSE 0. 008196721 4 FALSE 0. 008196721 5 FALSE 0. 008196721 6 FALSE 0. 008196721 7 FALSE 0. 008196721 8 FALSE 0. 008196721 …
Results of Analysis All 122 counterfactuals extrapolations (outside of convex hull) n Few counterfactuals near most observations (on average, only 1. 3% of observations “nearby” as defined by geometric variability) n Data contain little information for answering key causal question: forecasts based more on model specification than evidence n
Consequences n n New model specification incorporating additional interaction term Original and modified models make similar in-sample predictions Out-of-sample predictions for counterfactuals extremely divergent Hence: counterfactual inferences in fact sensitive to model specification
Conclusion n Need to know extent to which data as opposed to model drives conclusions n Use R to make new techniques like these for analyzing counterfactual model dependency available to applied researchers