INTEROPERWHAT Discussion Slides How to use these slides


- Slides: 30
INTEROPER…WHAT? ! Discussion Slides
How to use these slides This bank of slides are designed for a non-technical audience. There are 5 sections to pull from: 1. Statistics 2. Text & Graphics 3. Quotes 4. Costs 5. Project Unicorn Just grab what you need and go! Edit and reformat as needed. Questions or would like Co. SN to add a slide? email communications@cosn. org 2
Statistics
CTOs say improved interoperability will help them with: • Making State & Federal reporting more efficient (97%) • Building better district level dashboards (97%) • Accessing Digital Content (95%) • Scheduling/Rostering (94%) • Better understanding of the student learning process (91%) • Saving money (89%) 4 Co. SN Infrastructure Survey
74% of schools use more than 26 different edtech or software tools Survey from Digital Promise League of Innovative Schools’ Data Interoperability Working Group
Interoperability impacts teachers • 93% of all teachers now use some sort of digital tool to help guide instruction • 67% of teachers are not fully satisfied with the effectiveness of the data and tools they have access to on a regular basis • Teachers spend approximately 9 additional hours per week on instructional workflow outside of school hours. 6 Teachers Know Best research project
30% of helpdesk calls Survey from Digital Promise League of Innovative Schools’ Data Interoperability Working Group are for password resets
Text & Graphics
What is interoperability? • The seamless sharing of data, content and services among systems or applications. 9 • An analogous situation exists in districts’ digital ecosystems. • Most edtech systems were not designed to work together.
Why does interoperability in K-12 matter? 10 • Siloed data • Difficulties in student rostering • Inaccuracies in data transfer • End-user frustration of managing multiple log-ins • Unnecessary and costly expense retrofitting solutions together
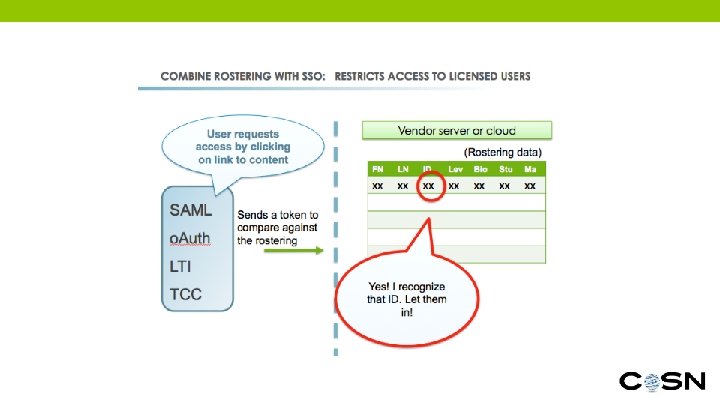
11
While there are different kinds of interoperability, they are all part of a much larger animal! 12
Quotes
“ You can’t realize the potential of data if you can’t get to the data. ” Keith R. Krueger | CEO | Consortium for School Networking 15
“ Siloed efforts are not going to have the impact on learning that we desperately need. Instead, standards allow us to innovate on a common foundation, and create an ecosystem that connects learning experiences across contexts and across lifetimes. ” Erin Knight | Senior Director of Learning and Badges | Mozilla Open Badges 16
“ The textbook industry has evolved to support a few common trim sizes for books and the bookstores have built shelves to fit them. The Common Cartridge is a similar convention applied to e. Learning content. 17 ” Ray Henderson | Edtech Investor / Advisor
“ The ultimate goal is to use advanced technologies to support educators in personalizing instruction to meet each student’s individualized learning needs with differentiated content, assessments for learning, project-based e. Portfolios, and online learning. 18 ” Dr. Susan Patrick | President and CEO | i. NACOL
“ Getting out of the paper-centric world and into a world where content is truly born digital means that it can also be born accessible and accessed through the tools that best suit the needs of the individual student. ” Betsy Beaumon | General Manager & VP, Global Literacy Program | Benetech 19
“ 20 Why it takes so long is because: • I am taking the standards from the report card, • I put them in a spreadsheet, • I print out the spreadsheet • I input all the kids’ names, • I print out the spreadsheet with all their names on it. • As I’m assessing them, and talking to them, and working with them, I’m filling in the spreadsheet. And FINALLY, I take my hand-written spreadsheet to the computer, and input all the grades. ” Research Participant | The Teacher Knows Best research project
“ So when we don’t privilege interoperability, when we don’t privilege products that allow us to get our data out, it means that in the end, we’re actually paying for access to our data, not just in teacher time and student learning, but actual money. This is our students’ data, and we need to take it back in a way that empowers instruction. ” Erin Mote | CEO | Innovate. EDU 21
Costs
What does the lack of interoperability Cost?
Hidden cost of not having interoperability • The service contract with our SIS to clean data • Fees for data integration solutions • Increase in software prices that gets passed along when vendors have to use or create integration services • Costs of consultants and IT department efforts to keep systems running
Michigan ROI study • $61 million per year were being spent on data quality, data completeness & other data management tasks • $64 million per year were being spent on system connections • $38 million per year were being spent on compliance data submissions • In total, this represents district expenditures of upward of $163 million per year
Project Unicorn
Project Unicorn Pledges
District Pledge Tenants 1. Provide digital learning environments for teachers, students, and families 2. Educate our communities about data privacy 3. Advocate for data interoperability 4. Adopt and integrate data interoperability standards for our technology use 5. Provide access to quality digital infrastructure
bit. ly/Unicorn_Pledge