
Internet Isobar A Scalable Overlay Distance Monitoring System

Internet Iso-bar: A Scalable Overlay Distance Monitoring System Yan Chen, Lili Qiu, Chris Overton and Randy H. Katz
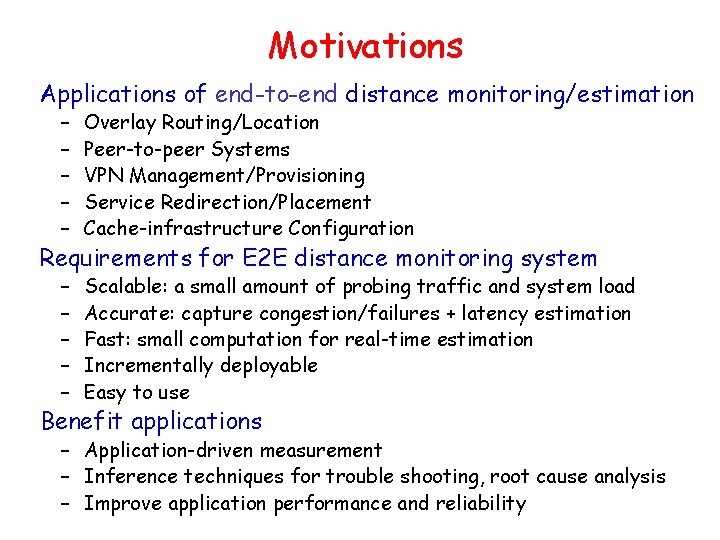
Motivations Applications of end-to-end distance monitoring/estimation – – – Overlay Routing/Location Peer-to-peer Systems VPN Management/Provisioning Service Redirection/Placement Cache-infrastructure Configuration – – – Scalable: a small amount of probing traffic and system load Accurate: capture congestion/failures + latency estimation Fast: small computation for real-time estimation Incrementally deployable Easy to use Requirements for E 2 E distance monitoring system Benefit applications – Application-driven measurement – Inference techniques for trouble shooting, root cause analysis – Improve application performance and reliability
E 2 E Estimation/Monitoring Systems Comparison Properties Dynamic monitoring Scalability: (N hosts, AP address prefixes, K landmarks, C clusters) N > AP » C C≥K Estimation accuracy Monitors deployment GNP Akamai IDMaps RON Internet Isobar
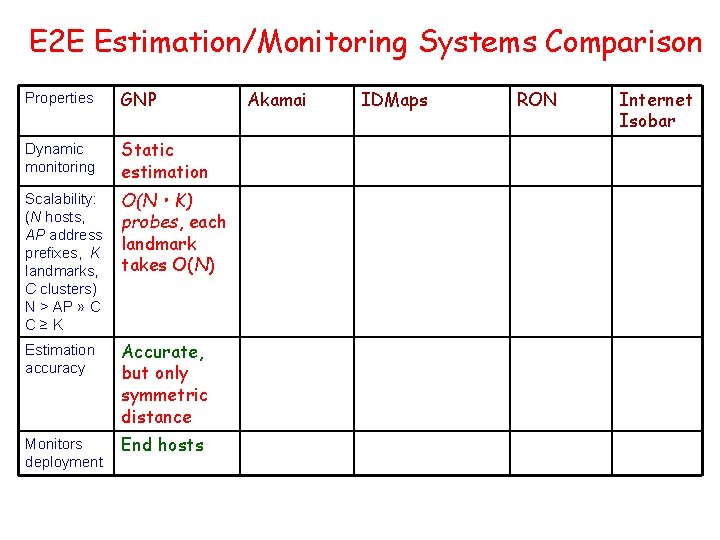
E 2 E Estimation/Monitoring Systems Comparison Properties GNP Dynamic monitoring Static estimation Scalability: (N hosts, AP address prefixes, K landmarks, C clusters) N > AP » C C≥K O(N • K) probes, each landmark takes O(N) Estimation accuracy Accurate, but only symmetric distance Monitors deployment End hosts Akamai IDMaps RON Internet Isobar
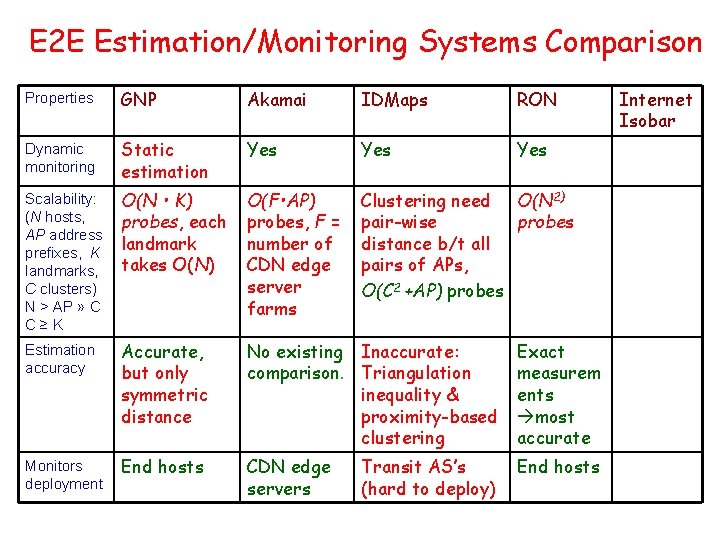
E 2 E Estimation/Monitoring Systems Comparison Properties GNP Akamai IDMaps RON Dynamic monitoring Static estimation Yes Yes Scalability: (N hosts, AP address prefixes, K landmarks, C clusters) N > AP » C C≥K O(N • K) probes, each landmark takes O(N) O(F • AP) probes, F = number of CDN edge server farms Clustering need O(N 2) pair-wise probes distance b/t all pairs of APs, O(C 2 +AP) probes Estimation accuracy Accurate, but only symmetric distance No existing Inaccurate: comparison. Triangulation inequality & proximity-based clustering Exact measurem ents most accurate Monitors deployment End hosts CDN edge servers End hosts Transit AS’s (hard to deploy) Internet Isobar
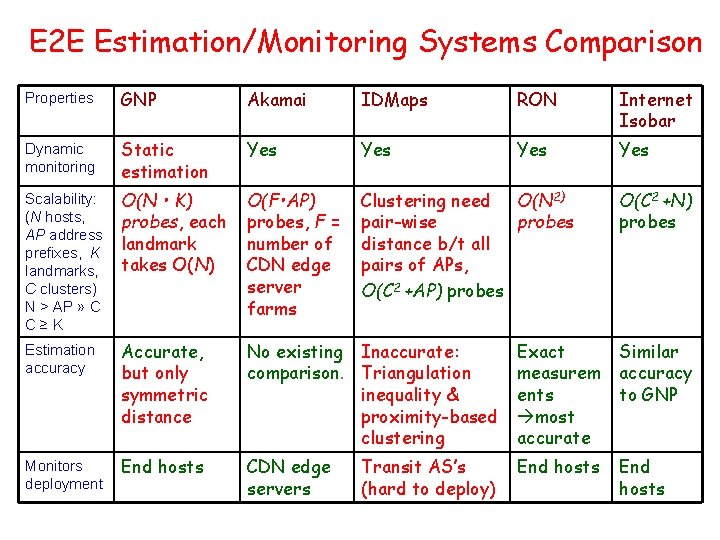
E 2 E Estimation/Monitoring Systems Comparison Properties GNP Akamai IDMaps RON Internet Isobar Dynamic monitoring Static estimation Yes Yes Scalability: (N hosts, AP address prefixes, K landmarks, C clusters) N > AP » C C≥K O(N • K) probes, each landmark takes O(N) O(F • AP) probes, F = number of CDN edge server farms Clustering need O(N 2) pair-wise probes distance b/t all pairs of APs, O(C 2 +AP) probes Estimation accuracy Accurate, but only symmetric distance No existing Inaccurate: comparison. Triangulation inequality & proximity-based clustering Exact measurem ents most accurate Similar accuracy to GNP Monitors deployment End hosts CDN edge servers End hosts Transit AS’s (hard to deploy) O(C 2 +N) probes
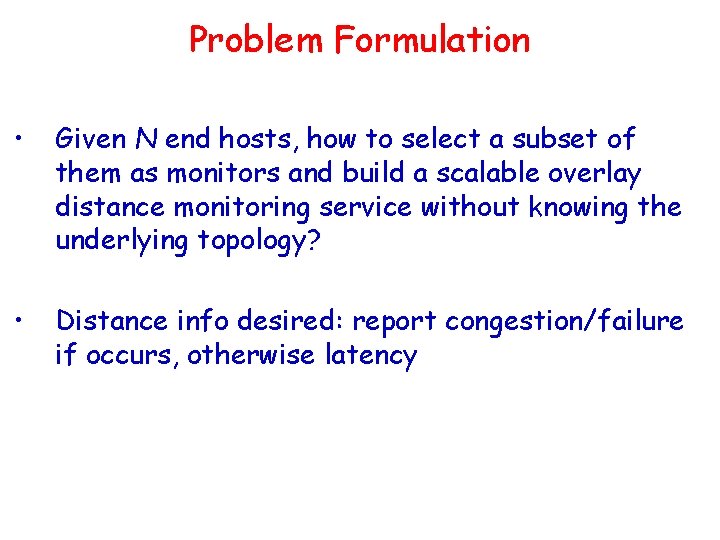
Problem Formulation • Given N end hosts, how to select a subset of them as monitors and build a scalable overlay distance monitoring service without knowing the underlying topology? • Distance info desired: report congestion/failure if occurs, otherwise latency
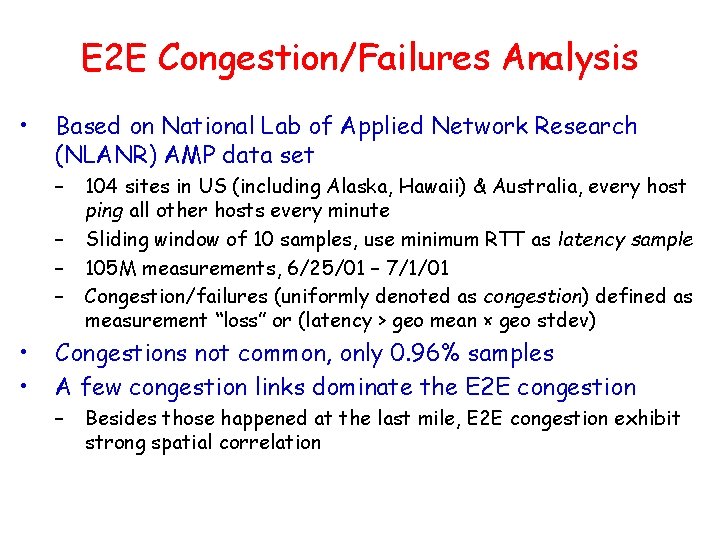
E 2 E Congestion/Failures Analysis • Based on National Lab of Applied Network Research (NLANR) AMP data set – – • • 104 sites in US (including Alaska, Hawaii) & Australia, every host ping all other hosts every minute Sliding window of 10 samples, use minimum RTT as latency sample 105 M measurements, 6/25/01 – 7/1/01 Congestion/failures (uniformly denoted as congestion) defined as measurement “loss” or (latency > geo mean × geo stdev) Congestions not common, only 0. 96% samples A few congestion links dominate the E 2 E congestion – Besides those happened at the last mile, E 2 E congestion exhibit strong spatial correlation
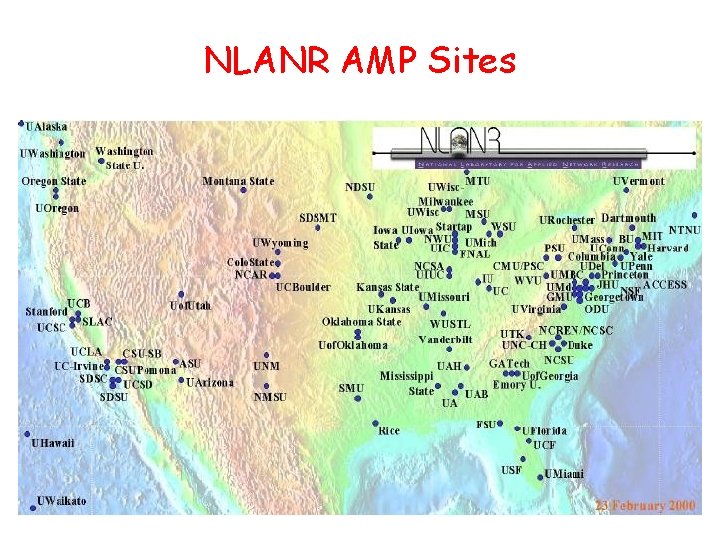
NLANR AMP Sites
Internet Iso-bar • Procedures 1. Cluster hosts that perceive similar performance to a small set of sites (landmarks) 2. For each cluster, select a monitor for active and continuous probing 3. Estimate distance between any pair of hosts using inter- and intra-cluster distance
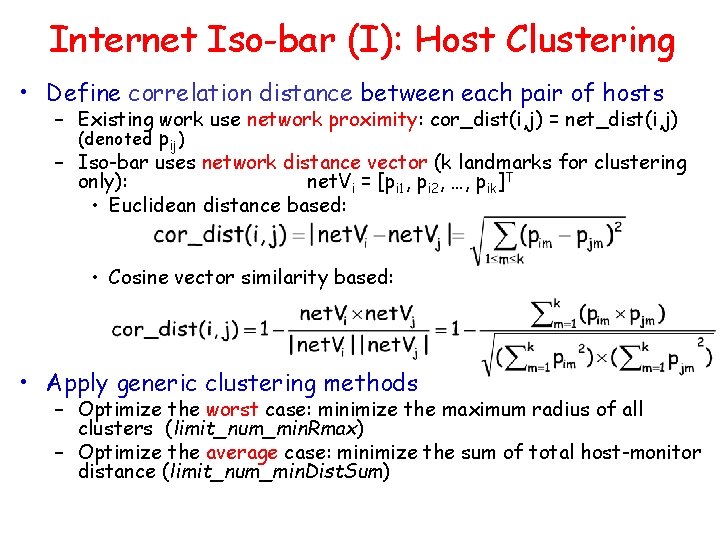
Internet Iso-bar (I): Host Clustering • Define correlation distance between each pair of hosts – Existing work use network proximity: cor_dist(i, j) = net_dist(i, j) (denoted pij) – Iso-bar uses network distance vector (k landmarks for clustering only): net. Vi = [pi 1, pi 2, …, pik]T • Euclidean distance based: • Cosine vector similarity based: • Apply generic clustering methods – Optimize the worst case: minimize the maximum radius of all clusters (limit_num_min. Rmax) – Optimize the average case: minimize the sum of total host-monitor distance (limit_num_min. Dist. Sum)
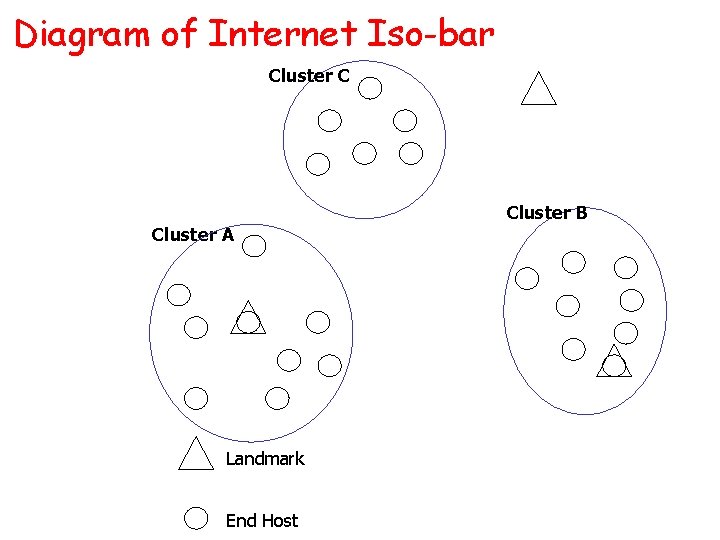
Diagram of Internet Iso-bar Cluster C Cluster B Cluster A Landmark End Host

Diagram of Internet Iso-bar Cluster C Cluster B Cluster A Landmark Monitor End Host Distance probes from monitor to its hosts Distance probes among monitors
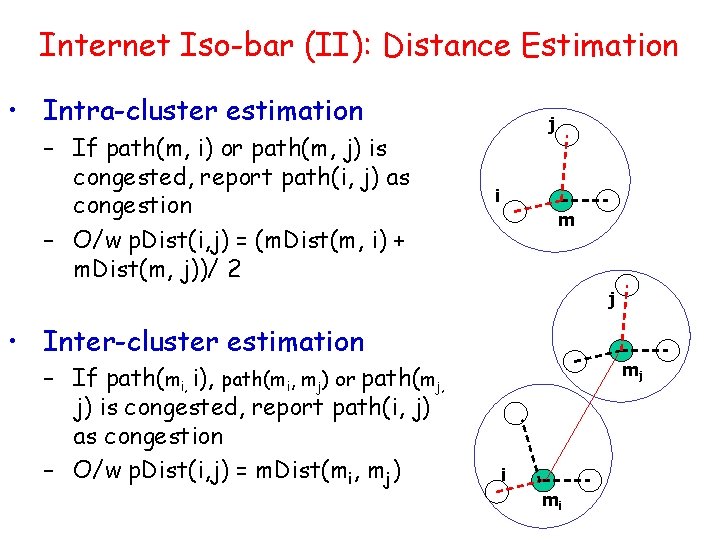
Internet Iso-bar (II): Distance Estimation • Intra-cluster estimation – If path(m, i) or path(m, j) is congested, report path(i, j) as congestion – O/w p. Dist(i, j) = (m. Dist(m, i) + m. Dist(m, j))/ 2 j i m j • Inter-cluster estimation – If path(mi, i), path(mi, mj) or path(mj, j) is congested, report path(i, j) as congestion – O/w p. Dist(i, j) = m. Dist(mi, mj) mj i mi
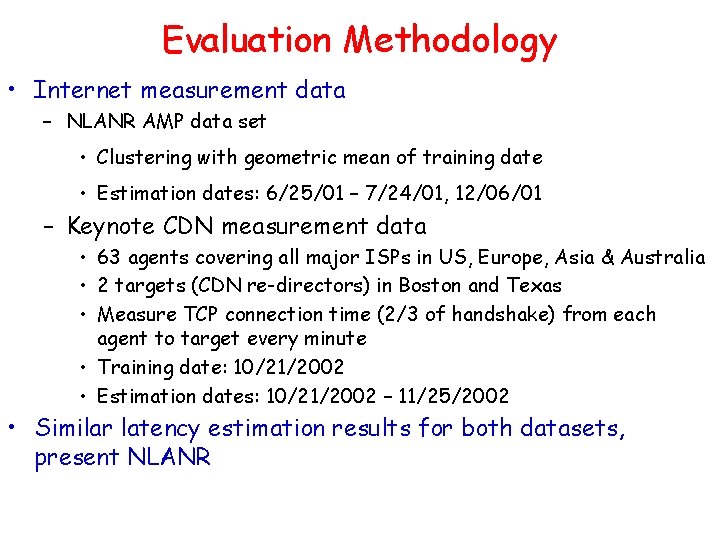
Evaluation Methodology • Internet measurement data – NLANR AMP data set • Clustering with geometric mean of training date • Estimation dates: 6/25/01 – 7/24/01, 12/06/01 – Keynote CDN measurement data • 63 agents covering all major ISPs in US, Europe, Asia & Australia • 2 targets (CDN re-directors) in Boston and Texas • Measure TCP connection time (2/3 of handshake) from each agent to target every minute • Training date: 10/21/2002 • Estimation dates: 10/21/2002 – 11/25/2002 • Similar latency estimation results for both datasets, present NLANR
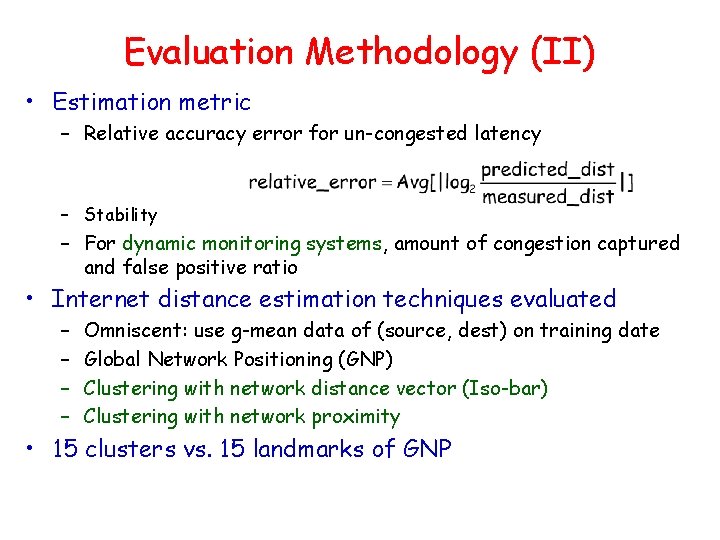
Evaluation Methodology (II) • Estimation metric – Relative accuracy error for un-congested latency – Stability – For dynamic monitoring systems, amount of congestion captured and false positive ratio • Internet distance estimation techniques evaluated – – Omniscent: use g-mean data of (source, dest) on training date Global Network Positioning (GNP) Clustering with network distance vector (Iso-bar) Clustering with network proximity • 15 clusters vs. 15 landmarks of GNP
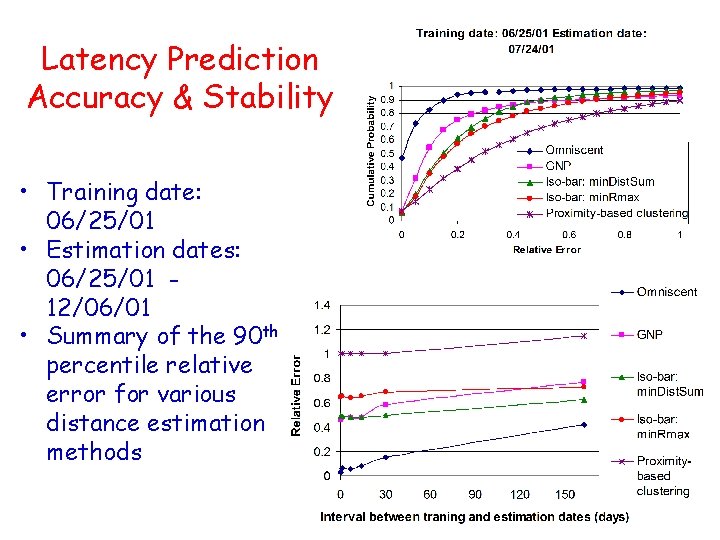
Latency Prediction Accuracy & Stability • Training date: 06/25/01 • Estimation dates: 06/25/01 12/06/01 • Summary of the 90 th percentile relative error for various distance estimation methods
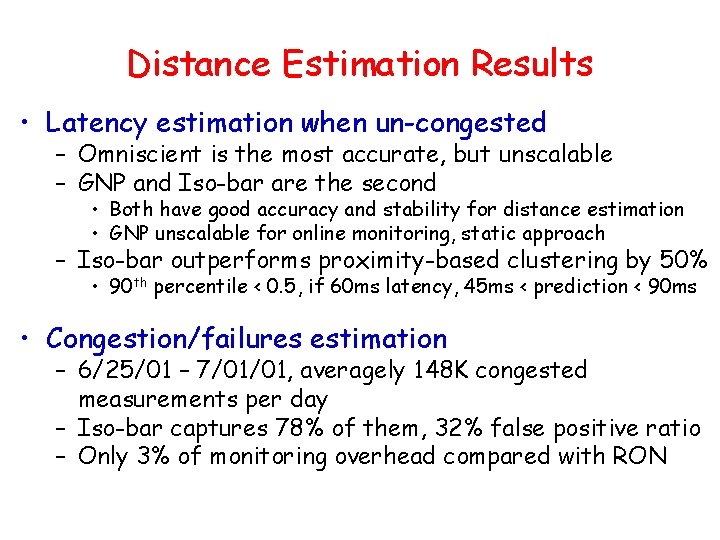
Distance Estimation Results • Latency estimation when un-congested – Omniscient is the most accurate, but unscalable – GNP and Iso-bar are the second • Both have good accuracy and stability for distance estimation • GNP unscalable for online monitoring, static approach – Iso-bar outperforms proximity-based clustering by 50% • 90 th percentile < 0. 5, if 60 ms latency, 45 ms < prediction < 90 ms • Congestion/failures estimation – 6/25/01 – 7/01/01, averagely 148 K congested measurements per day – Iso-bar captures 78% of them, 32% false positive ratio – Only 3% of monitoring overhead compared with RON
Conclusions • Propose Internet Iso-bar • Cluster hosts based on the network similarity • Inter- and Intra-cluster latency estimation w/ first-step heuristic for congestion/failure detection • Preliminary results promising – High accuracy & stability for normal latency estimation – Simple heuristics of congestion estimation captures 78% of congestions, with 32% false positive, and only 3% of monitoring overhead of RON
Ongoing Work • Current focus switch from latency estimation to congestion/failures estimation – Apply topology information, e. g. lossy link detection with network tomography – Cluster and choose monitors based on the lossy links • Benefit applications – Dynamic node join/leave for P 2 P systems • Joining client pings landmark sites to get distance vector, compare with those of monitors, and choose closest one to join • Split/merge clusters – Multi-path selection • More comprehensive evaluation – Simulate with large network – Deploy on Planet. Lab, and operate at finer level
Internet Iso-bar Problem formulation: Given N end hosts, how to select a subset of them as monitors and build a scalable overlay distance monitoring service without knowing the underlying topology? Distance info desired: report congestion/failure if occurs, o/w latency Our approach: 1. Cluster hosts that perceive similar performance to a small set of sites (landmarks) 2. For each cluster, select a monitor for active and continuous probing 3. Estimate distance between any pair of hosts using inter- and intra -cluster distance Performance evaluation – – – Using real Internet measurement data Compared with other distance estimation services: GNP, RON Performance metrics: accuracy and stability
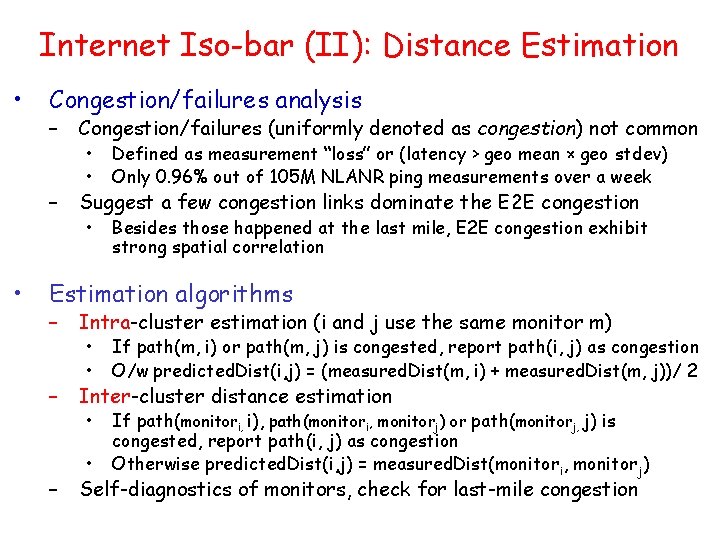
Internet Iso-bar (II): Distance Estimation • • Congestion/failures analysis – Congestion/failures (uniformly denoted as congestion) not common – Suggest a few congestion links dominate the E 2 E congestion • • Defined as measurement “loss” or (latency > geo mean × geo stdev) Only 0. 96% out of 105 M NLANR ping measurements over a week • Besides those happened at the last mile, E 2 E congestion exhibit strong spatial correlation Estimation algorithms – Intra-cluster estimation (i and j use the same monitor m) – Inter-cluster distance estimation – • • If path(m, i) or path(m, j) is congested, report path(i, j) as congestion O/w predicted. Dist(i, j) = (measured. Dist(m, i) + measured. Dist(m, j))/ 2 • If path(monitori, i), path(monitori, monitorj) or path(monitorj, j) is congested, report path(i, j) as congestion Otherwise predicted. Dist(i, j) = measured. Dist(monitori, monitorj) • Self-diagnostics of monitors, check for last-mile congestion
- Slides: 22