Internet Bandwidth Measurement Techniques Muhammad Ali Dec 17
Internet Bandwidth Measurement Techniques Muhammad Ali Dec 17 th 2005
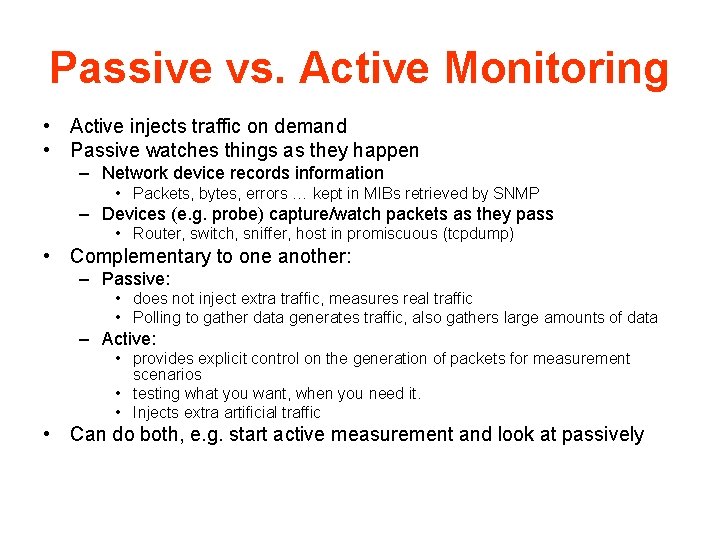
Passive vs. Active Monitoring • Active injects traffic on demand • Passive watches things as they happen – Network device records information • Packets, bytes, errors … kept in MIBs retrieved by SNMP – Devices (e. g. probe) capture/watch packets as they pass • Router, switch, sniffer, host in promiscuous (tcpdump) • Complementary to one another: – Passive: • does not inject extra traffic, measures real traffic • Polling to gather data generates traffic, also gathers large amounts of data – Active: • provides explicit control on the generation of packets for measurement scenarios • testing what you want, when you need it. • Injects extra artificial traffic • Can do both, e. g. start active measurement and look at passively
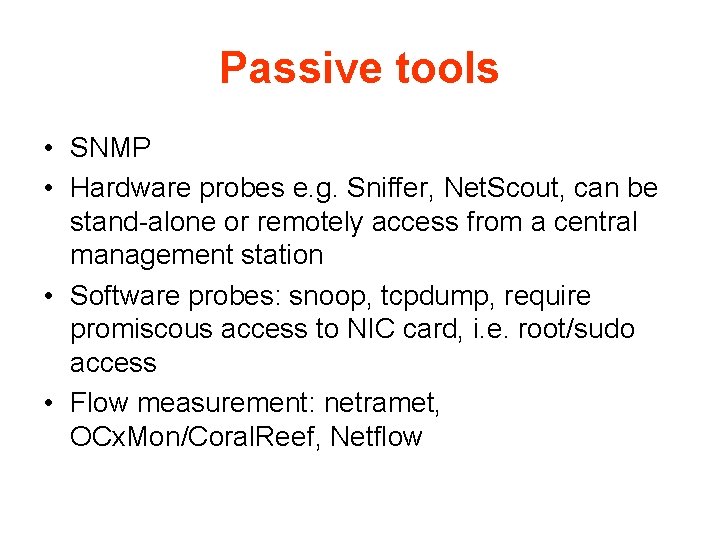
Passive tools • SNMP • Hardware probes e. g. Sniffer, Net. Scout, can be stand-alone or remotely access from a central management station • Software probes: snoop, tcpdump, require promiscous access to NIC card, i. e. root/sudo access • Flow measurement: netramet, OCx. Mon/Coral. Reef, Netflow
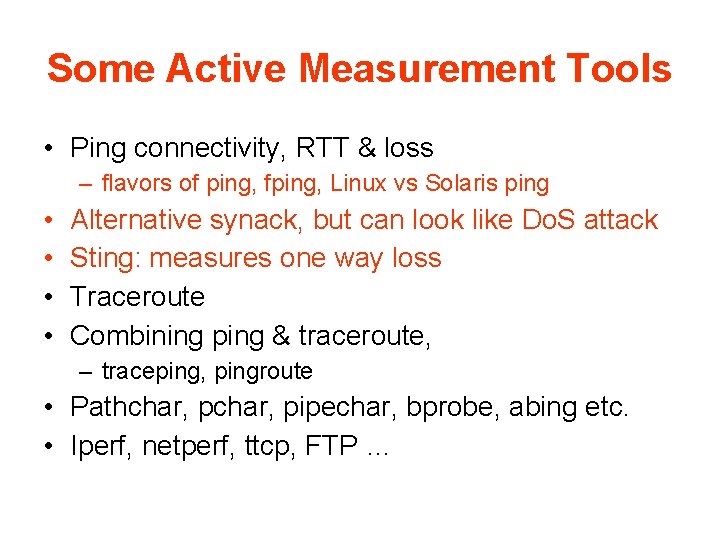
Some Active Measurement Tools • Ping connectivity, RTT & loss – flavors of ping, fping, Linux vs Solaris ping • • Alternative synack, but can look like Do. S attack Sting: measures one way loss Traceroute Combining ping & traceroute, – traceping, pingroute • Pathchar, pipechar, bprobe, abing etc. • Iperf, netperf, ttcp, FTP …

Ping • ICMP client/server application built on IP – Client send ICMP echo request, server sends reply – Server usually in kernel, so reliable & fast • User can specify number of data bytes. Client puts timestamp in data bytes. Compares timestamp with time when echo comes back to get RTT • Many flavors (e. g. fping) and options – packet length, number of tries, timeout, separation … • Ping localhost (127. 0. 0. 1) first, then gateway IP address etc.
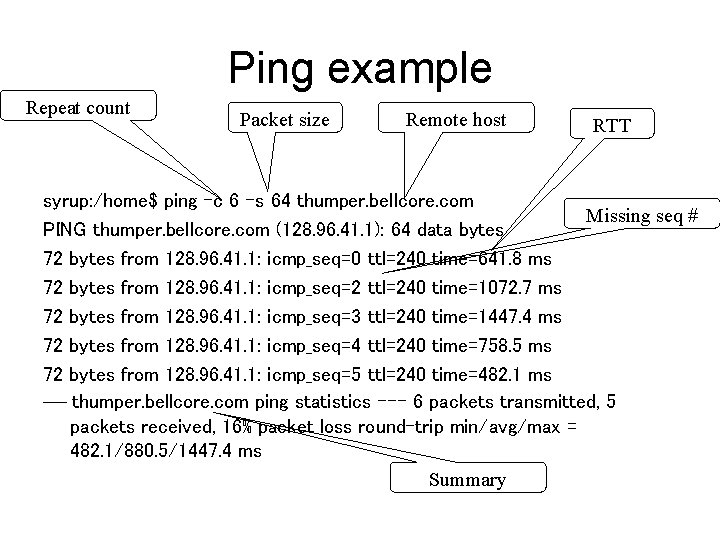
Ping example Repeat count Packet size Remote host RTT syrup: /home$ ping -c 6 -s 64 thumper. bellcore. com Missing seq # PING thumper. bellcore. com (128. 96. 41. 1): 64 data bytes 72 bytes from 128. 96. 41. 1: icmp_seq=0 ttl=240 time=641. 8 ms 72 bytes from 128. 96. 41. 1: icmp_seq=2 ttl=240 time=1072. 7 ms 72 bytes from 128. 96. 41. 1: icmp_seq=3 ttl=240 time=1447. 4 ms 72 bytes from 128. 96. 41. 1: icmp_seq=4 ttl=240 time=758. 5 ms 72 bytes from 128. 96. 41. 1: icmp_seq=5 ttl=240 time=482. 1 ms --- thumper. bellcore. com ping statistics --- 6 packets transmitted, 5 packets received, 16% packet loss round-trip min/avg/max = 482. 1/880. 5/1447. 4 ms Summary
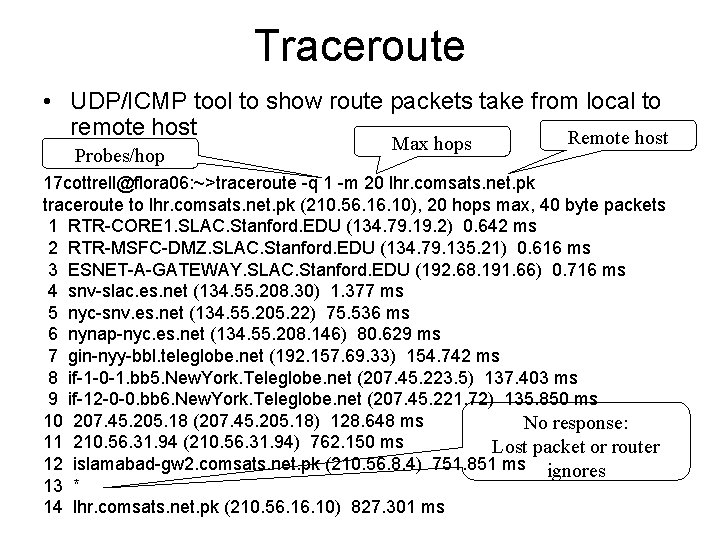
Traceroute • UDP/ICMP tool to show route packets take from local to remote host Remote host Probes/hop Max hops 17 cottrell@flora 06: ~>traceroute -q 1 -m 20 lhr. comsats. net. pk traceroute to lhr. comsats. net. pk (210. 56. 10), 20 hops max, 40 byte packets 1 RTR-CORE 1. SLAC. Stanford. EDU (134. 79. 19. 2) 0. 642 ms 2 RTR-MSFC-DMZ. SLAC. Stanford. EDU (134. 79. 135. 21) 0. 616 ms 3 ESNET-A-GATEWAY. SLAC. Stanford. EDU (192. 68. 191. 66) 0. 716 ms 4 snv-slac. es. net (134. 55. 208. 30) 1. 377 ms 5 nyc-snv. es. net (134. 55. 205. 22) 75. 536 ms 6 nynap-nyc. es. net (134. 55. 208. 146) 80. 629 ms 7 gin-nyy-bbl. teleglobe. net (192. 157. 69. 33) 154. 742 ms 8 if-1 -0 -1. bb 5. New. York. Teleglobe. net (207. 45. 223. 5) 137. 403 ms 9 if-12 -0 -0. bb 6. New. York. Teleglobe. net (207. 45. 221. 72) 135. 850 ms 10 207. 45. 205. 18 (207. 45. 205. 18) 128. 648 ms No response: 11 210. 56. 31. 94 (210. 56. 31. 94) 762. 150 ms Lost packet or router 12 islamabad-gw 2. comsats. net. pk (210. 56. 8. 4) 751. 851 ms ignores 13 * 14 lhr. comsats. net. pk (210. 56. 10) 827. 301 ms
Pingroute • Run traceroute, then ping each router n times – helps identify where in route the problems start to occur • Routers may not respond to pings, or may treat pings directed at them, differently to other packets
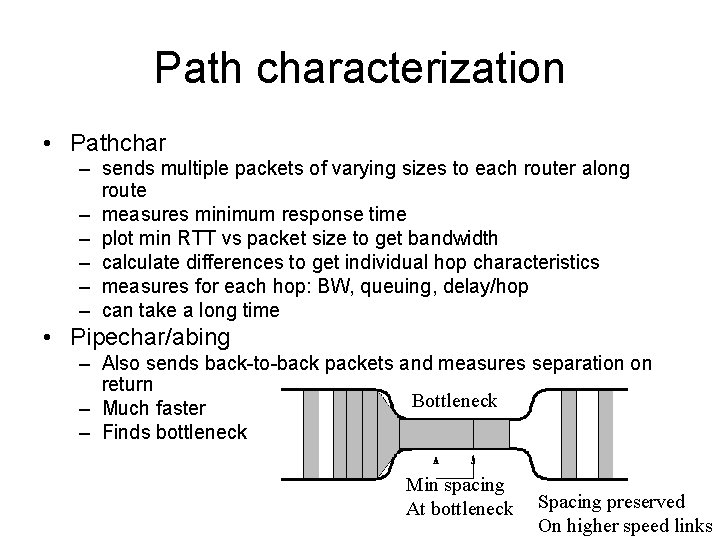
Path characterization • Pathchar – sends multiple packets of varying sizes to each router along route – measures minimum response time – plot min RTT vs packet size to get bandwidth – calculate differences to get individual hop characteristics – measures for each hop: BW, queuing, delay/hop – can take a long time • Pipechar/abing – Also sends back-to-back packets and measures separation on return Bottleneck – Much faster – Finds bottleneck Min spacing At bottleneck Spacing preserved On higher speed links
Network throughput • Iperf – Client generates & sends UDP or TCP packets – Server receives packets – Can select port, maximum window size, port , duration, Mbytes to send etc. – Client/server communicate packets seen etc. – Reports on throughput • Requires sever to be installed at remote site, i. e. friendly administrators or logon account and password
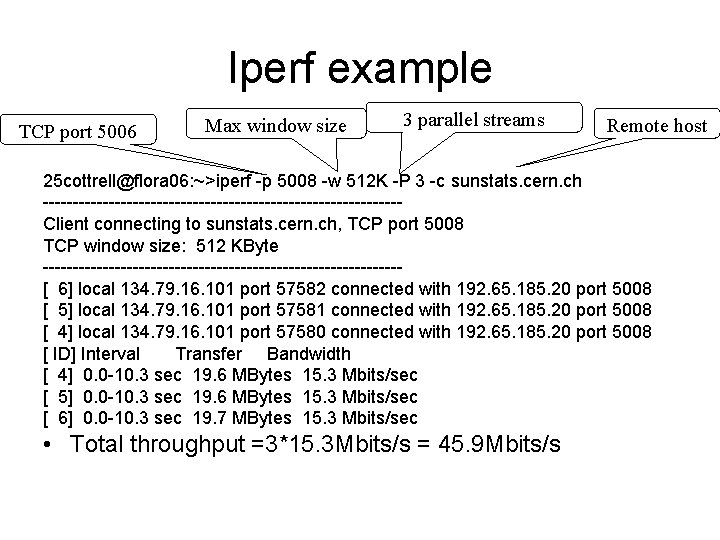
Iperf example TCP port 5006 Max window size 3 parallel streams Remote host 25 cottrell@flora 06: ~>iperf -p 5008 -w 512 K -P 3 -c sunstats. cern. ch ------------------------------Client connecting to sunstats. cern. ch, TCP port 5008 TCP window size: 512 KByte ------------------------------[ 6] local 134. 79. 16. 101 port 57582 connected with 192. 65. 185. 20 port 5008 [ 5] local 134. 79. 16. 101 port 57581 connected with 192. 65. 185. 20 port 5008 [ 4] local 134. 79. 16. 101 port 57580 connected with 192. 65. 185. 20 port 5008 [ ID] Interval Transfer Bandwidth [ 4] 0. 0 -10. 3 sec 19. 6 MBytes 15. 3 Mbits/sec [ 5] 0. 0 -10. 3 sec 19. 6 MBytes 15. 3 Mbits/sec [ 6] 0. 0 -10. 3 sec 19. 7 MBytes 15. 3 Mbits/sec • Total throughput =3*15. 3 Mbits/s = 45. 9 Mbits/s
References • N. Hu, P. Steenkiste, “Evaluation and Characterization of Available Bandwidth Probing Techniques”. • Les Cottrell, “Internet Monitoring”, presented at, NIIT, March 15, 2005.
- Slides: 12