International portfolio diversification benefits Crosscountry evidence from a

International portfolio diversification benefits: Cross-country evidence from a local perspective By J. Driessen and L. Laeven Presented by Michal Kolář, Tomáš Matuška, Tomáš Šembera & Tomáš Václavíček

Presentation overview I. Introduction and motivation of the topic II. Data and research method III. Empirical results – International diversification benefits IV. Empirical results – Cross-country variation V. Empirical results – Time- varying diversification benefits VI. Conclusions and key points to remember

I. Introduction and motivation of the topic

How it relates to you personally • Do you invest? • And do you invest abroad? • If not, you might be missing the benefits of diversification.

Research question • Are there benefits to investing internationally for non-US investors? • What is the economic size of diversification benefits? • How do they differ by country – and based on what factors?

Why this hypothesis • Many institutions required to invest domestically • Home bias • Regulations are being lifted • Boom in international investing • Essentially all literature focuses on US investors only • Results not representative! • How about investors in Czech Republic or elsewhere? • Investing abroad can become more important if domestic market is small, restricted, …

II. Data and research method
 • Monthly data")
What data were used • 52 countries (29 developing, 23 rich) • Monthly data on returns • Time period: 1985 – 2002 • Some countries do not have that old data • But provided consistently

How to measure it? • Utility gain, when restriction is lifted • Adding a set of assets to benchmark set (K = 1) I. Improvement in Expected returns II. Increase in Sharpe ratio • Sharpe ratio = measure of risk-adjusted return

Benefits of investing regionally Benefits of investing globally Comparison • Investing in domestic stock market • Investing domestically + into regional stock market global stock market • MSCI indices for the US, Europe, and Far East
 No market frictions 3 possible assumptions B) Frictions in developing countries • Short")
A) No market frictions 3 possible assumptions B) Frictions in developing countries • Short sales constraints C) Frictions in all countries

III. Empirical results - International diversification benefits
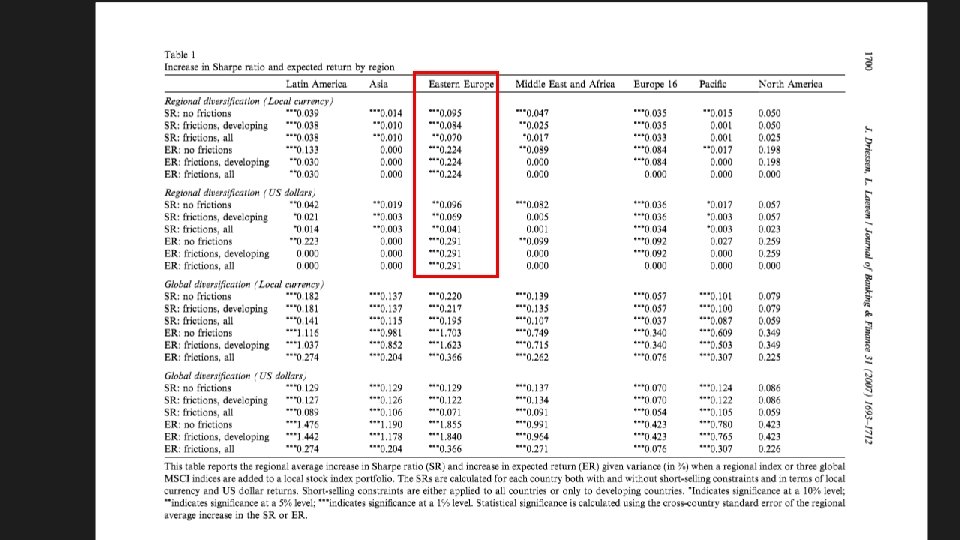

Regional diversification • Largest benefits from diversification in Eastern Europe • No benefits from diversification when short selling constraint are present (except for Eastern Europe)
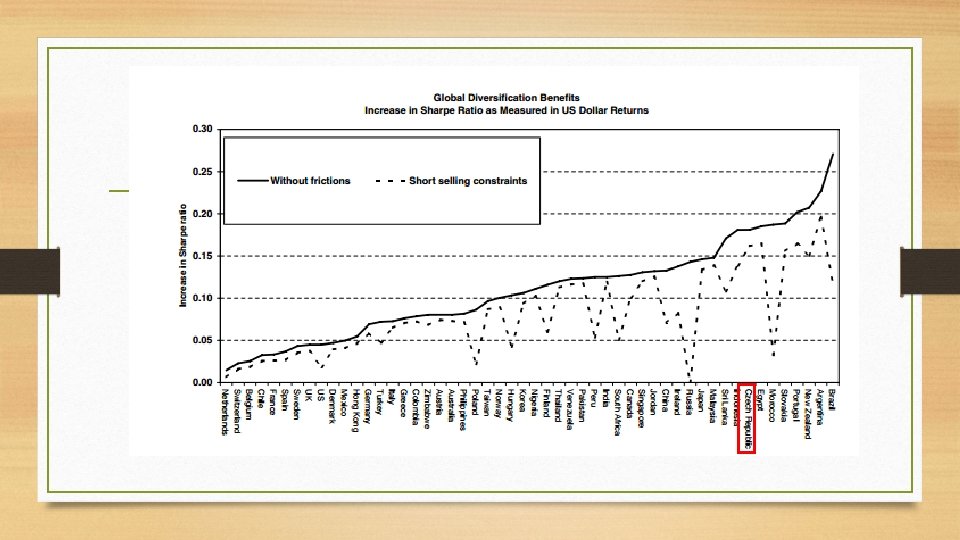

Global diversification • No friction: Increase of Shape Ration from 1, 3 % to 46, 3 % expressed in local currency, from 1, 5 % to 27, 1 % expressed in US $ ( -> 11 % increase on average in US$) • Short-selling constraints in developing countries -> don’t affect results • Short-selling constraints in all countries -> unrealistic; substantial decrease of benefits of diversification

IV. Empirical results - Cross-country variation

What causes the variation in benefits? • Dependent variable § Increase in Sharpe ratio • SR of the Global portfolio – SR of the local portfolio • Independent variables § ICRG country risk rating • Proxy for the country risk (The higher rating the less country risk) • Proxy for the investment restrictions, political risk, investor protection and foreign exchange regulations

What does cause variation in benefits? • Independent variables § Market capitalization of stock market • Proxy size of the stock market § Trade openess • Proxy integration in world goods markets § Private credit to GDP • Proxy financial sector development in country

Cross-country regression results • Only ICRG rating significant • Doubts about causality § Using IV -> Instrument Legal Origin • Quality of the institutional framework • Qualitatively same results
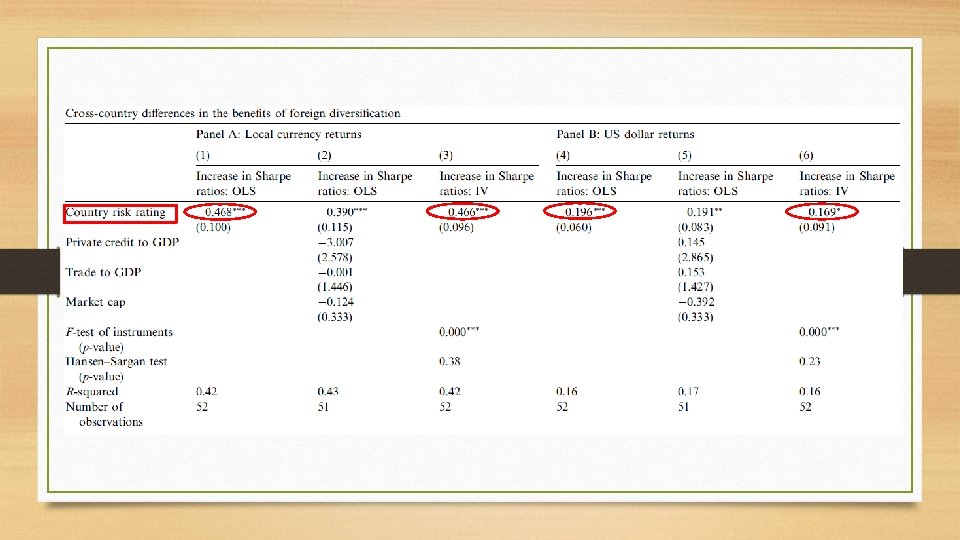

Cross-country regression results • Country risk is major determinant of GD Benefits • Benefits much larger for countries with higher risk

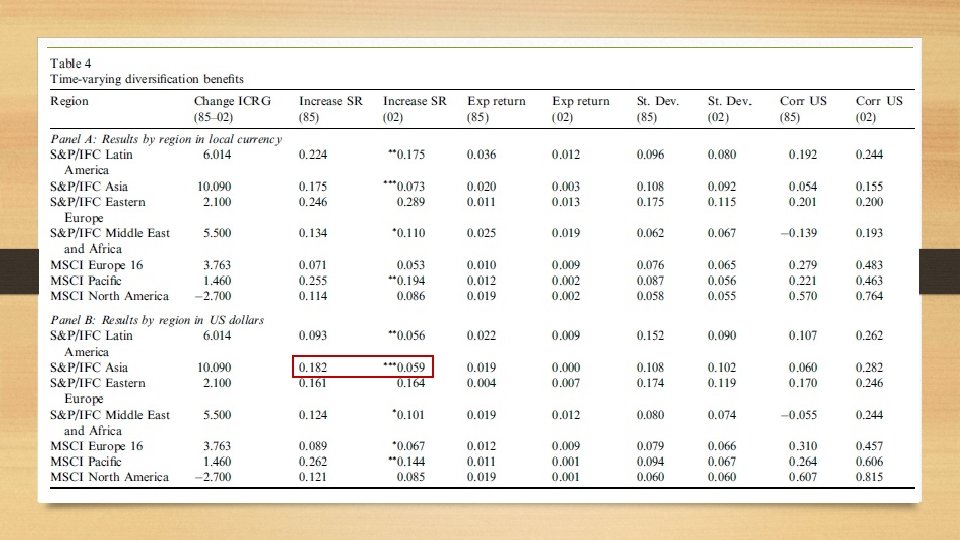
V. Empirical results - Time-varying diversification benefits

Why analysing time variation • Further confirmation of country risk – diversification benefits relationship in time -> If country risk decreases, the diversification benefits should decrease too
 Moments of returns of local indices estimated")
Measuring determinants of diversification benefits • 1) Moments of returns of local indices estimated using ICRG composite risk index • Expected return • Volatility • Correlation with regional or global index

Expected returns •

Volatility of returns •

Correlation with indices •
 the increase")
Results • For 42 out of 52 countries (period 1985 – 2002) the increase in ICRG caused: • Increase in correlation with regional or global indices • Decrease in expected returns • Decrease in volatility of returns • The effect of country risk measure on diversification benefits is not clear

Finding the effect on diversification benefits • Equations of returns, volatility and correlation used to compute the Sharpe ratios • Decrease in diversification benefits over time (decrease in volatility and increase in correlation outweighed the decrease in expected returns) • The decrease significant for region with developing countries • No clear pattern in change of diversification benefits for developed countries

Conclusions and key points to remember • There are substantial regional and global benefits from diversification • More significant effect for developing countries • Diversification benefits decreased in the period 1985 – 2002 • The decrease corresponds to decrease of country risk: CR benefits • Contribution of paper is focusing on investors outside USA

Thank you for your attention
- Slides: 34