International Development Economics Associates IDEAs INTERNATIONAL CONFERENCE ON
 INTERNATIONAL CONFERENCE ON FINANCIAL INSTABILITY AND INEQUALITY IN AN")

 v External")


… That improvement in part explains")


 1994 -1998 1999 -2003 2004 -2008 2009")


")


 and output per worker (red) in manufacturing sector")


")

 and inflation")

")


")
")
")
")


- Slides: 60
International Development Economics Associates (IDEAs) INTERNATIONAL CONFERENCE ON FINANCIAL INSTABILITY AND INEQUALITY IN AN ECONOMICALLY Tsinghua Sanya International Mathematics Forum (TSIMF) INTEGRATED WORLD 22 -24 February 2016 Andrés Lazzarini UFRJ (Brazil) – UNSAM (Argentina) alazzarini@gmail. com
Some Notes on Economic Growth, Macroeconomic Policies and in Income Distribution in Argentina and Brazil, 2003 -2015
Outline v Intro & theoretical premises v Effective demand principle (Kalecki, Keynes) v External constraints (Structuralist approach) v Political limits (Kalecki 1943) v Period 2003 -2015 v Accelerated growth v Argentina: 2003 -2008 v Brazil: 2006 -2010 v Deceleration v Argentina: 2012 -2015 v Brazil: 2011 -2015 v Perspectives
Effective demand principle: Kalecki and Keynes • Investment creates savings (and not the other way round) Demand as engine of growth: consumption, public spending, public and private investment, exports Limits: 1. Structural limits (supply conditions): in particular in non industrialized countries (periphery) problems of external constraints 2. Political limits: more general nature, Kalecki: check on workers’ real income at the expense of lower employment and even lower profit margins
2000 s Context • Better terms of trade for the periphery • Rise in international reserves • Low interest rates in international capital markets • Remarkable increase in South-South trade • Decoupling (at least until a very few years ago. . )
Better external conditions for countries exporting commodities (developing countries)… That improvement in part explains the very good performance of some Latin American economies
DECOUPLING Tasas promedio de crecimiento del PBI per cápita a dólares constantes del 2005 por regiones SOURCE World Bank
Terms of trade for Latin America, China and India SOURCE World Bank
International reserves (as a % of GDP) 1994 -1998 1999 -2003 2004 -2008 2009 -2013 Angola 5. 0% 7. 4% 15. 7% 25. 2% Sudáfrica 3. 0% 5. 9% 9. 8% 13. 1% India 6. 7% 11. 3% 19. 4% 17. 3% Indonesia 11. 3% 17. 3% 12. 6% China 13. 0% 18. 3% 39. 3% 45. 2% Rusia 3. 9% 12. 2% 27. 7% 28. 9% Argentina 5. 9% 7. 4% 12. 2% 8. 9% Brasil 6. 4% 6. 8% 9. 4% 15. 0% Chile 21. 8% 20. 3% 12. 9% 14. 9% Colombia 9. 5% 10. 3% 10. 2% 10. 3% Perú 18. 7% 17. 8% 22. 2% 30. 3% SOURCE: World Bank data base
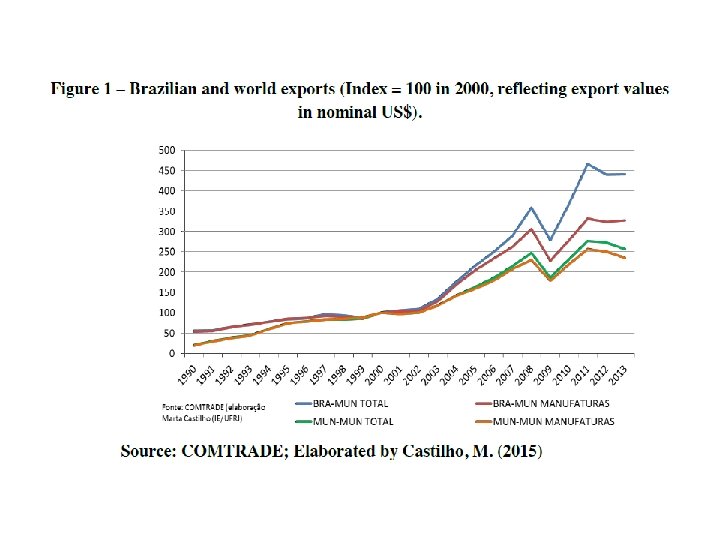
South-South trade Brazil: total exports and exports to China. Chinese share on total Brazilian exports. 1970 -2010. Exportaciones Brasil Totales China 1970 2. 738. 712. 832 1. 327. 122 (0, 00) 1975 8. 669. 454. 336 67. 357. 912 (0, 01) 1980 20. 132. 055. 040 72. 225. 672 (1, 06) 1985 25. 638. 731. 776 817. 582. 208 (3, 50) 1990 31. 396. 964. 352 381. 792. 448 (0, 91) 1995 46. 145. 355. 776 1. 203. 741. 184 (0, 78) 2000 54. 743. 553. 226 1. 085. 301. 597 (2, 19) 2005 118. 069. 804. 976 6. 834. 996. 980 (7, 28) 2010 195. 546. 557. 878 30. 752. 355. 631 (14, 15) Source: COMTRADE data base
Argentina: total exports and exports to China and Brazil. Chinese and Brazilian shares on total Argentinean exports. 1970 -2010. Exportaciones Argentina Totales China Brasil 1970 1. 773. 170. 432 2. 516. 097 (0, 14) 138. 561. 088 (7, 81) 1975 2. 961. 259. 776 21. 448. 888 (0, 72) 213. 480. 560 (7, 21) 1980 8. 019. 175. 936 188. 736 (2, 35) 764. 968. 256 (9, 54) 1985 8. 395. 986. 432 311. 004. 064 (3, 70) 496. 293. 408 (5, 91) 1990 12. 351. 521. 792 240. 968. 608 (1, 95) 1. 422. 653. 184 (11, 52) 1995 20. 962. 545. 664 285. 730. 784 (1, 36) 5. 484. 101. 120 (26, 16) 2000 26. 244. 851. 702 796. 927. 268 (3, 04) 6. 990. 801. 568 (26, 64) 2005 39. 963. 954. 009 3. 154. 288. 661 (7, 89) 6. 328. 294. 321 (15, 84) 2010 66. 174. 370. 291 5. 798. 633. 567 (8, 76) 14. 424. 597. 623 (21, 80) Source: COMTRADE data base.
GROWTH RATE
EXPORTS GROWTH RATE
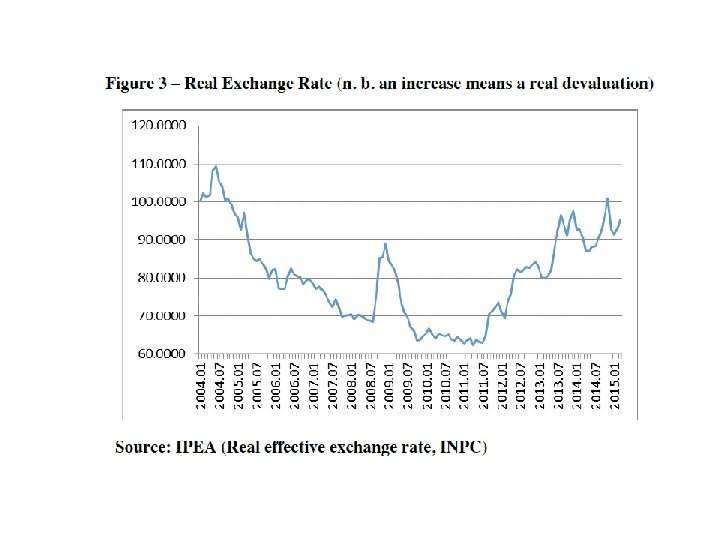
Were external conditions alone the main responsible that help boos the Latin American economies, such as Argentina and Brazil? One of the debates (at least involving Argentina and Brazil discussion in policy and academic circles) has been around the question of whether it is advisable to promote and keep “competitive” exchange rate policies But again is exchange rate the most importan variable for growth?
Nominal Exchange rate (Reais-USD)
Job creation in formal sectors
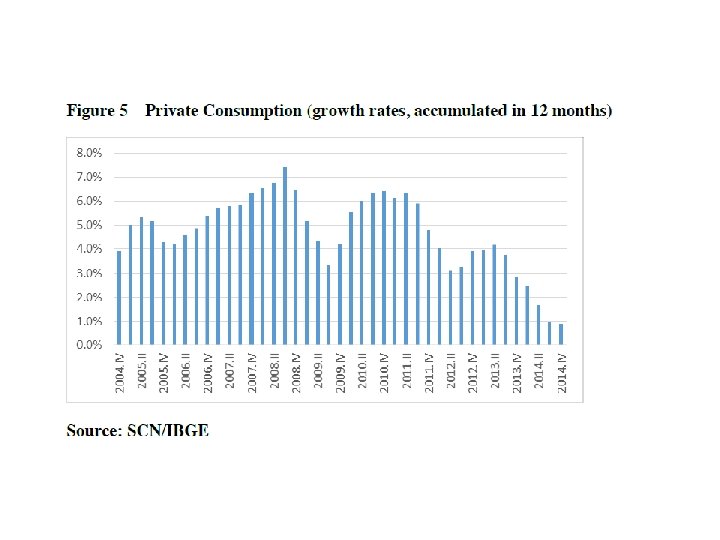
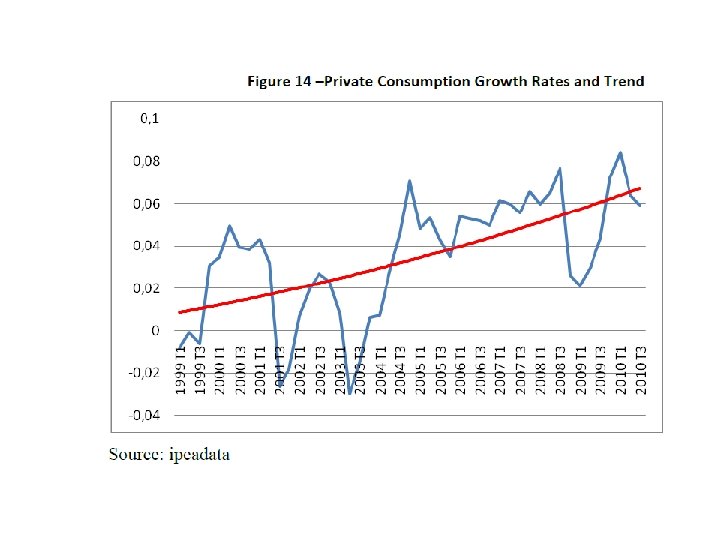
HOUSEHOLDS SPENDING GROWTH RATE
Wage share and Gini coefficient
Unit wage costs (blue) and output per worker (red) in manufacturing sector
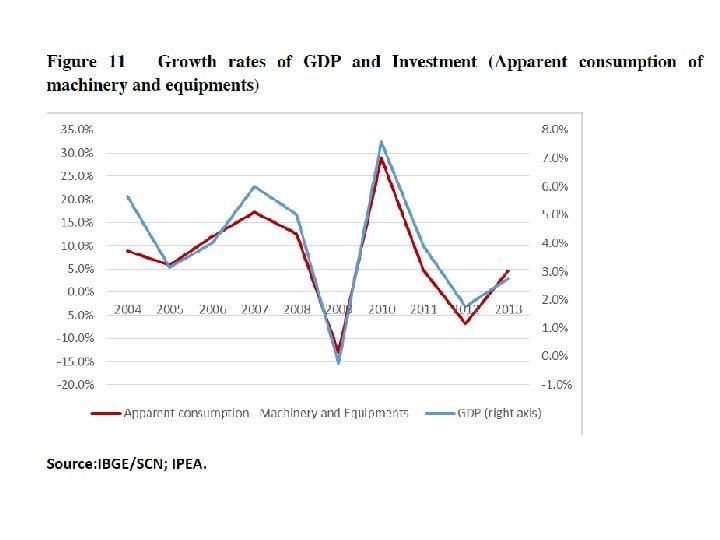
Gross capital formation and apparent machinery consumption: GROWTH RATE
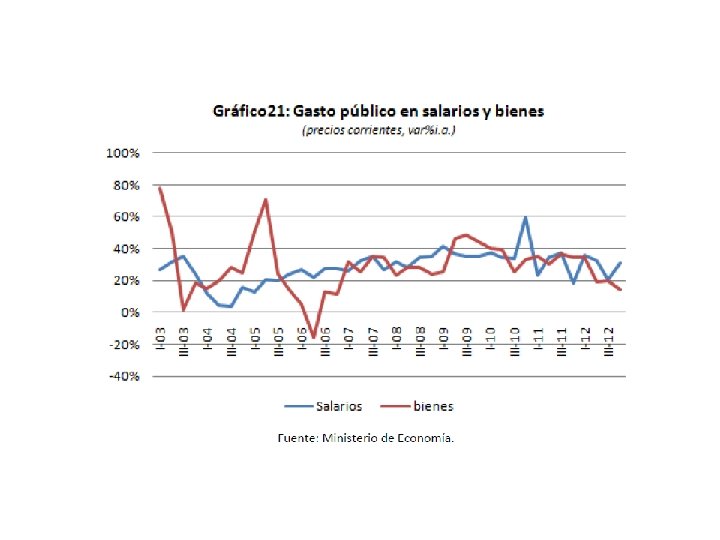
Public expenditure growth rate
BRAZIL Key variables:growth rate
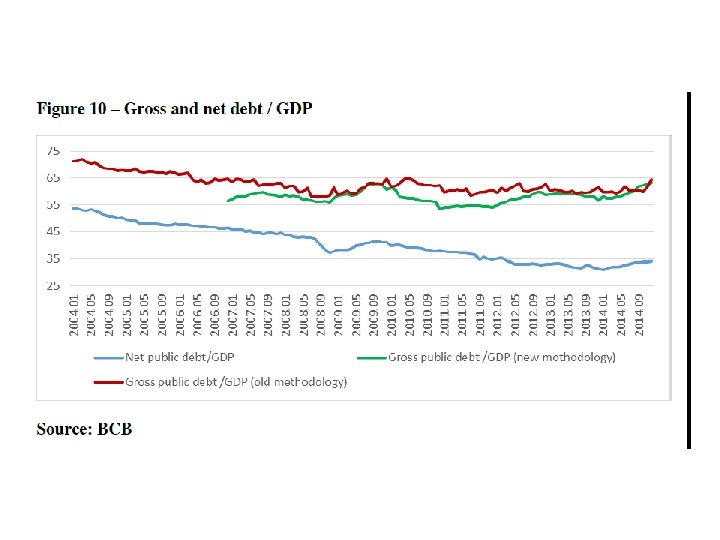
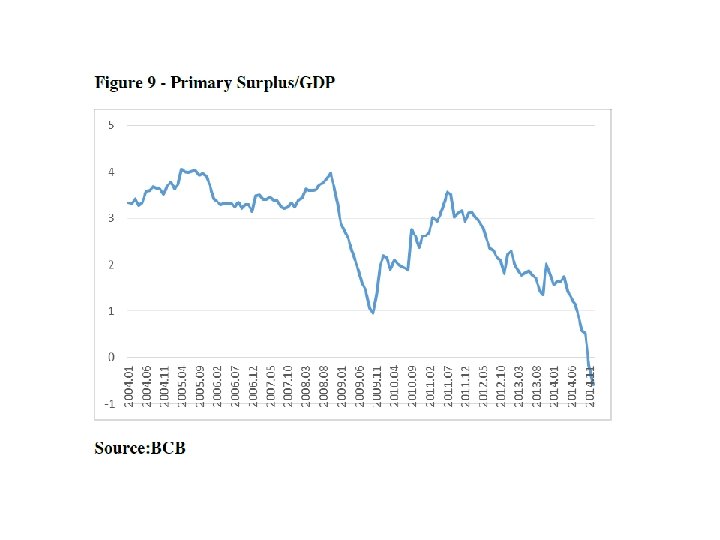
Brazil: Public sector Balance
BRAZIL GDP growth rate
Argentina
ARGENTINA:growth rate
ARGENTINA:GDP & Investment growth rates
ARGENTINA:Durable equipment Investment growth rate
ARGENTINA:Private consumption growth rate
ARGENTINA:Fiscal policy impact on GDP growth
ARGENTINA:Real wage growth rate
ARGENTINA:Wage share(% of GDP)
ARGENTINA:Minimum wage and pensions
ARGENTINA:Nominal wages (growth rate) and inflation
ARGENTINA:Real wage growth rate
ARGENTINA:Social transfers (total and % growth rate)
Deceleration 2012 - 2015
Latam countries:GDP growth rates
ARGENTINA:non-financial private sector foreign assets demand (millions USD)
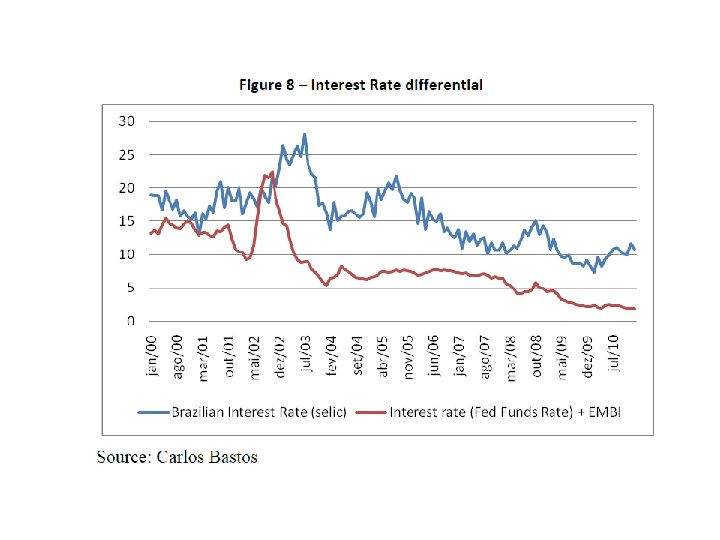
ARGENTINA:Interest rates differential ( domestic vs foreign)
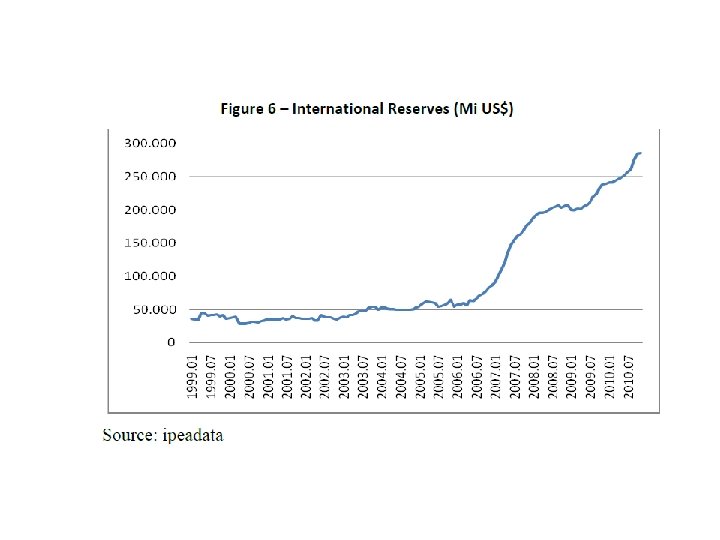
ARGENTINA:International reserves(millions USD)
ARGENTINA:current account,capital flows & international reserves(millions USD)
Deceleration 2012 - 2015 Argentina: external constraint. . . Brazil: political causes. . limits to full employment strategies (Kalecki 1943)
Perspectives Argentina: external constraint is the limit to growth so deepening industrial policies( which were lacking broadly speaking) But…recent shift in political orientation as of dec. 2015 is likely to drive the economy to a further crisis with all the already-known consequences
Brazil: complex scenario Int’l reserves amount to 370 billions USD, so external conditions seem not to be the problem. . . However, by carrying out fiscal adjustments and depreciation policies (50% in 2015): fiscal deficit will increase along with the inflation rate, and inequality (due to fall in real wages and GDP fall) At risk: many of the achievements over the last decade A plausible explanation of this remarkable slowdonw has to be sought in the political nature of the recent changes in economic policy economy.
Thanks! alazzarini@gmail. com