
International Airlines Presented By Zaki Kasmani David Tran
International Airlines Presented By: Zaki Kasmani David Tran Laurence Wong Cecilia Fan Business 417 Spring 2006

Industry Outlook Just. OR? ? Kidding!
Basic Definitions l ATK (Available Tonne Kilometres) : Ø l ASK (Available Seat Kilometers): Ø Ø l Ø Ø Ø The average amount of revenue received per RPK, net of taxes Revenue divided by RPK Represents an aggregate of all the airfare and airline charges and measured on a per kilometer basis LOAD FACTOR: Ø Ø l The average operating cost incurred per ATK YIELD: Ø l Used to measure actual freight traffic UNIT COST: Ø l % of ASK used FTK (Freight Tonne Kilometers): Ø l The number of passengers multiplied by the number of kilometers they are flown Used to measure actual passenger traffic PLF (Passenger Load Factor): Ø l The number of seats an airline has available multiplied by the number of kilometers they are flown Used to measure airline capacity RPK (Revenue Passenger Kilometers): Ø l Used to measure available total capacity (combined passenger and cargo) RPK divided by ASK The percentage of seating or freight capacity that is utilized. Computed as the ratio of RPK to ASK or in the case of cargo services, RTK to ATK BREAK-EVEN LOAD FACTOR: Ø Ø The Load Factor when operating revenues is equal to operating costs Unit Cost divided by Yield
Types of Airlines • Legacy: International & National traditional airlines (ie: British Airways, Delta Airways) • Discount: Regional (Europe) or National (US) (ie: Easyjet, Southwest) • Cargo
Airline Characteristics Capital intensive industry (highly leveraged) l Largest operating costs: Labour & Fuel l Historically low labour productivity l Very sensitive to global business cycles l Very competitive l Sensitive to geopolitical events ie: 911, SARS, etc l
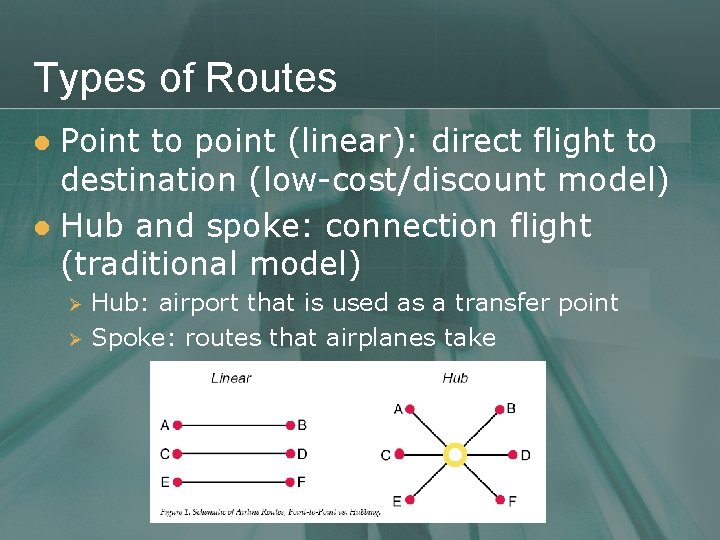
Types of Routes Point to point (linear): direct flight to destination (low-cost/discount model) l Hub and spoke: connection flight (traditional model) l Ø Ø Hub: airport that is used as a transfer point Spoke: routes that airplanes take
Past & Present Injuries l l l l Deregulation (October 28, 1978) Terrorist attacks (Sept 11, 2001) The collapse of the dotcom bubble (late 1990) The war in Iraq (2003 - present) The SARS epidemic in Asia (start November 2002) Fiercer competition from new low-cost carriers High taxation Rise in oil price
Future Threats l l l l l Additional terrorist attacks Future price of oil Further competition from regional airlines Security impact on cost and travel convenience Decrease in consumer confidence World economy Business cycle Debt (airline industry’s debt load exceeds the US industry average) Aircraft cost & maintenance
Bankruptcy Protection l 2002 -2005: Majority of US legacy airlines entered & emerged from Chapter 11; some still working through restructuring (Delta) l Focus was cost reduction: reduced labour costs, pension restructuring, capital restructuring (fleet overhaul to cheaper, more fuel efficient aircraft – avoid the Jetsgo predicament) l Airlines include: Delta, American Airlines, Northwest, United
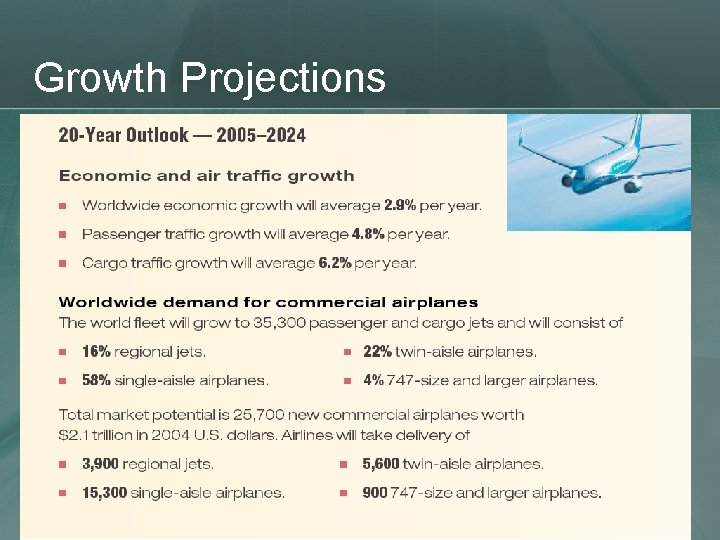
Growth Projections

Global Traffic Outlook
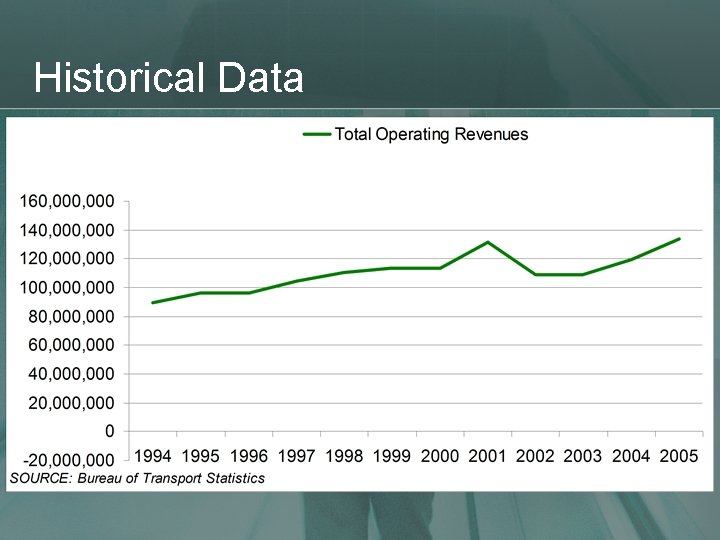
Historical Data
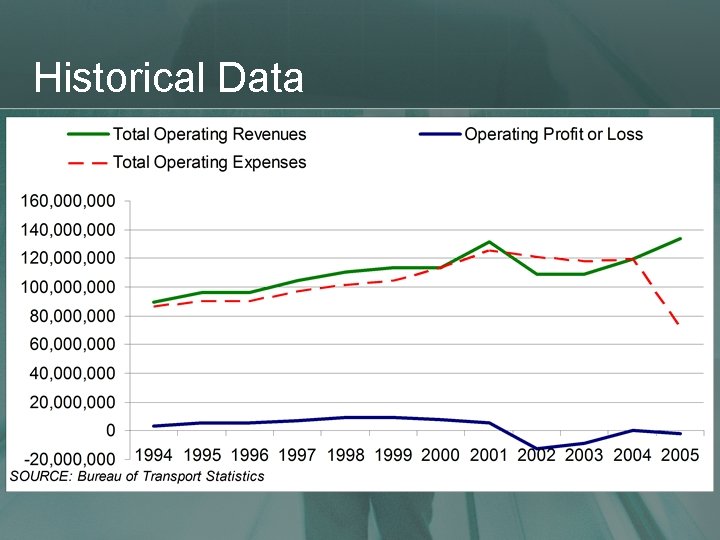
Historical Data
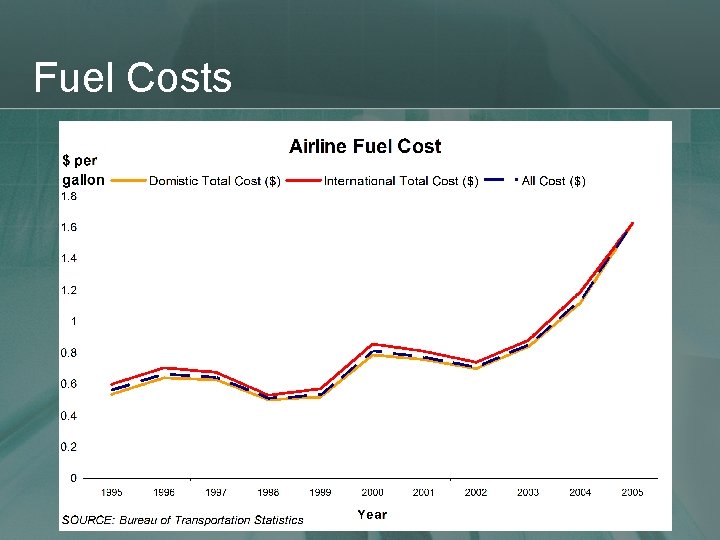
Fuel Costs
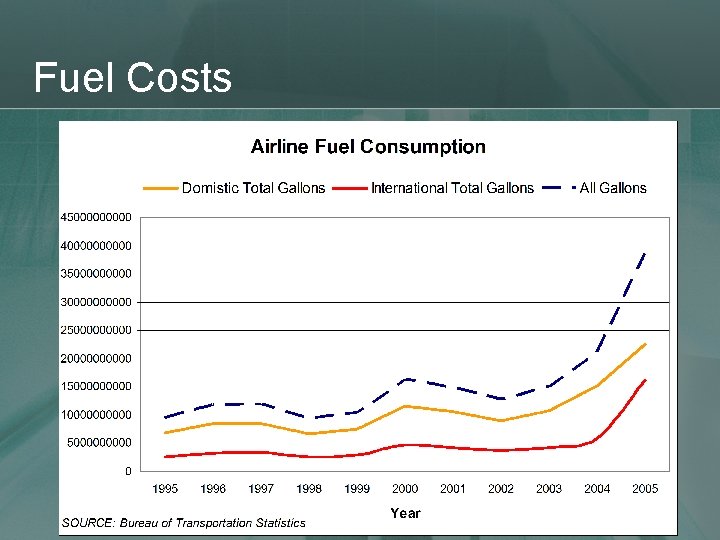
Fuel Costs
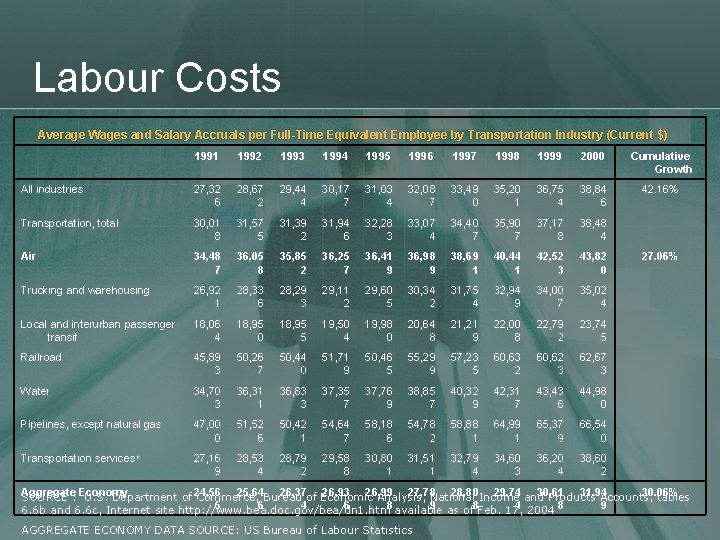
Labour Costs Average Wages and Salary Accruals per Full-Time Equivalent Employee by Transportation Industry (Current $) 1991 1992 1993 1994 1995 1996 1997 1998 1999 2000 Cumulative Growth All industries 27, 32 6 28, 67 2 29, 44 4 30, 17 7 31, 03 4 32, 08 7 33, 49 0 35, 20 1 36, 75 4 38, 84 6 42. 16% Transportation, total 30, 01 8 31, 57 5 31, 39 2 31, 94 6 32, 28 3 33, 07 4 34, 40 7 35, 90 7 37, 17 8 38, 48 4 Air 34, 48 7 36, 05 8 35, 85 2 36, 25 7 36, 41 9 36, 98 9 38, 69 1 40, 44 1 42, 52 3 43, 82 0 Trucking and warehousing 26, 92 1 28, 33 6 28, 29 3 29, 11 2 29, 60 5 30, 34 2 31, 75 4 32, 94 9 34, 00 7 35, 02 4 Local and interurban passenger transit 18, 06 4 18, 95 0 18, 95 5 19, 50 4 19, 98 0 20, 64 8 21, 21 9 22, 00 8 22, 79 2 23, 74 5 Railroad 45, 89 3 50, 26 7 50, 44 0 51, 71 9 50, 46 5 55, 29 9 57, 23 5 60, 63 2 60, 62 3 62, 67 3 34, 70 3 36, 31 1 36, 83 3 37, 35 7 37, 76 9 38, 85 7 40, 32 9 42, 31 7 43, 43 6 44, 98 0 47, 00 0 51, 52 6 50, 42 1 54, 64 7 58, 18 6 54, 78 2 58, 88 1 64, 99 1 65, 37 9 66, 54 0 27, 16 9 28, 53 4 28, 79 2 29, 58 8 30, 80 1 31, 51 1 32, 79 4 34, 60 3 36, 20 4 38, 60 2 Water Pipelines, except natural gas Transportation servicesc 27. 06% Aggregate Economy 25, 64 Bureau 26, 37 of Economic 26, 93 26, 99 27, 78 28, 80 Income 29, 74 and 30, 61 31, 94 30. 06% SOURCE : U. S. Department of 24, 56 Commerce, Analysis, National Products Accounts, tables 5 6 4 6 8 available 9 as of 8 Feb. 17, 4 2004 8 9 6. 6 b and 6. 6 c, Internet site http: //www. bea. doc. gov/bea/dn 1. htm AGGREGATE ECONOMY DATA SOURCE: US Bureau of Labour Statistics
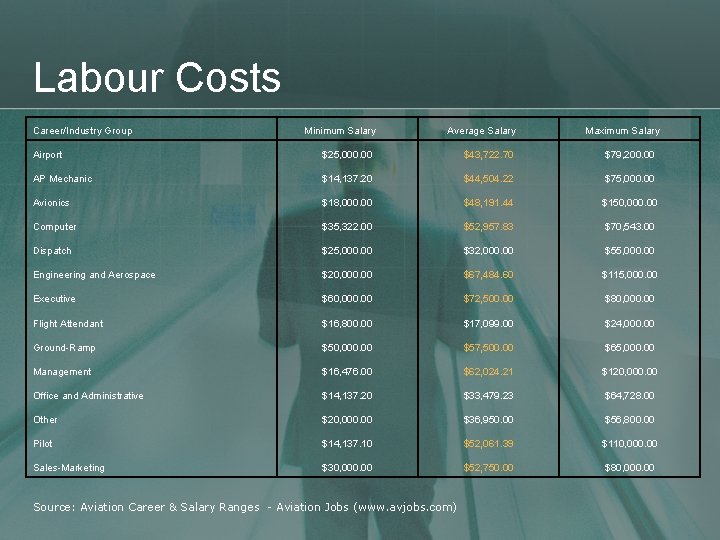
Labour Costs Career/Industry Group Minimum Salary Average Salary Maximum Salary Airport $25, 000. 00 $43, 722. 70 $79, 200. 00 AP Mechanic $14, 137. 20 $44, 504. 22 $75, 000. 00 Avionics $18, 000. 00 $48, 191. 44 $150, 000. 00 Computer $35, 322. 00 $52, 957. 83 $70, 543. 00 Dispatch $25, 000. 00 $32, 000. 00 $55, 000. 00 Engineering and Aerospace $20, 000. 00 $67, 484. 60 $115, 000. 00 Executive $60, 000. 00 $72, 500. 00 $80, 000. 00 Flight Attendant $16, 800. 00 $17, 099. 00 $24, 000. 00 Ground-Ramp $50, 000. 00 $57, 500. 00 $65, 000. 00 Management $16, 476. 00 $62, 024. 21 $120, 000. 00 Office and Administrative $14, 137. 20 $33, 479. 23 $64, 728. 00 Other $20, 000. 00 $36, 950. 00 $56, 800. 00 Pilot $14, 137. 10 $52, 061. 39 $110, 000. 00 Sales-Marketing $30, 000. 00 $52, 750. 00 $80, 000. 00 Source: Aviation Career & Salary Ranges - Aviation Jobs (www. avjobs. com)
Labour Cost Implications l More median salaries above average than below = higher overall salary cost than for economy in general l Wide range in salaries, unionized labour; senior international route pilots can earn up to $190, 000 USD per year l Majority of pensions are defined benefit: higher salaries = significantly higher pension obligations
Barriers to Operations Gate access at airports can be a significant barrier l Airports: generally locally owned authorities, lease out gates to airlines for long terms l Exclusive use, preferential use, or common use l Signatory airlines receive preferential rates vs. non signatory (most new entrants). ie: Pittsburgh Int’l Airport non signatory rates min. 20% higher l FAA mandates that gate access be granted in a fair and non-discriminatory manner. Regulations should only maintain safety, not encourage dominance
Barriers to Operations l In practice, established airlines can exercise significant dominance: gates are usually assigned via non market practices (bidding). Ability to bid depends on access. Large airlines can make contributions to/lobby municipal governments to restrict competing airlines’ access to airport l Majority in Interest (MII) clauses grant airlines rights to approve airport capital improvement plans (can restrict expansion to maintain monopoly access to a “hot” airport)
Barriers to Operations Therefore, a carrier’s ability to grow may not be determined by its cost efficiency but rather by its ability to land at high traffic destinations l FAA is currently reviewing gate lease practices in an attempt to make access more equitable. However, oversight still lies with the airport owner (local authority)
Bottom Line Airlines MUST reduce costs to achieve a return to sustained profitability.
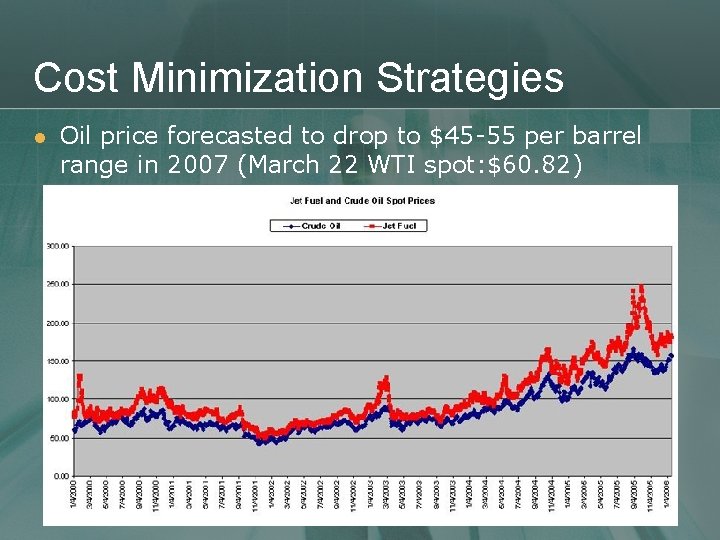
Cost Minimization Strategies l Oil price forecasted to drop to $45 -55 per barrel range in 2007 (March 22 WTI spot: $60. 82)
Cost Minimization Strategies 1 a) Acquire more fuel efficient aircraft: l Current Long Range Aircraft Fuel Consumption Ø Boeing 747 -400 3. 5 L/100 passenger KM (Average) l New Long Range Aircraft Fuel Consumption Ø Boeing 787: 2. 4 L/100 passenger KM Ø Airbus A 380: 3. 0 L/100 passenger KM Ø Airbus A 350: 3. 0 L/100 passenger KM
Cost Minimization Strategies l 1 b) Acquire more regional jets: l Regional Jets Ø Bombardier CRJ 200 (50 seat): ~3. 12 L/100 passenger KM Ø Bombardier CRJ 700 (78 seat): ~2. 60 L/100 passenger KM l All Russian aviation companies now under one banner – United Airplane Company. Focus will now be on Regional Jets, which will be of great demand in Russia.
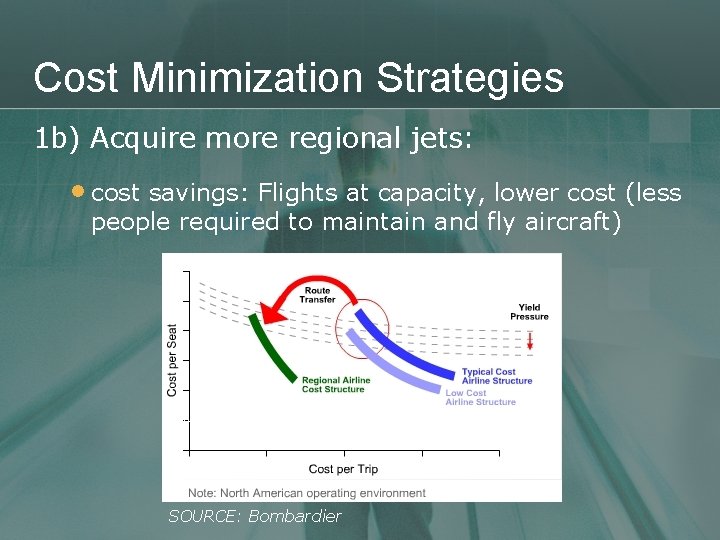
Cost Minimization Strategies 1 b) Acquire more regional jets: • cost savings: Flights at capacity, lower cost (less people required to maintain and fly aircraft) SOURCE: Bombardier
Cost Minimization Strategies 2) Reduce Labour Costs a) Increase labour productivity through additional training, performance monitoring b) Decrease salary/pension costs by: • • • hiring non-union workers where possible (new divisions) renegotiating existing salary contracts phasing out defined benefit pension plans in favour of defined contribution pension plans
Cost Minimization Strategies 3) Refine Business Model • Legacy airlines can employ 2 models: Ø Ø point to point low cost model on domestic routes traditional hub model on international routes. Thus far, traditional airlines (especially US based ones) have been entering bankruptcy protection to enable a restructuring that encompasses all 3 strategies. However, this is not exactly conducive to increasing consumer and investor confidence
Growth Projections
China Traffic Growth
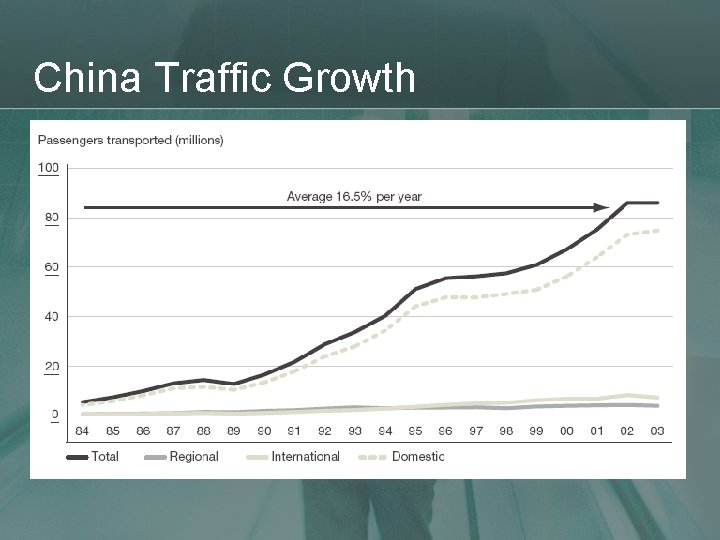
Growth Strategies Focus on regions that are expected to yield the highest rate of RPK growth: • China & India: Ø burgeoning middle class now has resources to travel. Ø Increased trade and foreign investment means increased number of foreign business people visiting, and increased frequency of visits
Investment Criteria Given the investors’ current distaste for airlines, bargains could (? ) be found 1) Cost efficiency: • • fuel efficient fleet, appropriate business model, reasonable labour costs (non union, or balanced union power) well funded pension obligations (defined contribution superior) 2) Exposure, or plans to operate in future high growth areas (China, India, Latin America) 3) Healthy financial structure; should not be overly leveraged, reasonable CAPX 4) Enough market power to secure additional airport access; ability to “withstand” competition from other carriers at high traffic airports (dominate? )
Southwest Airlines
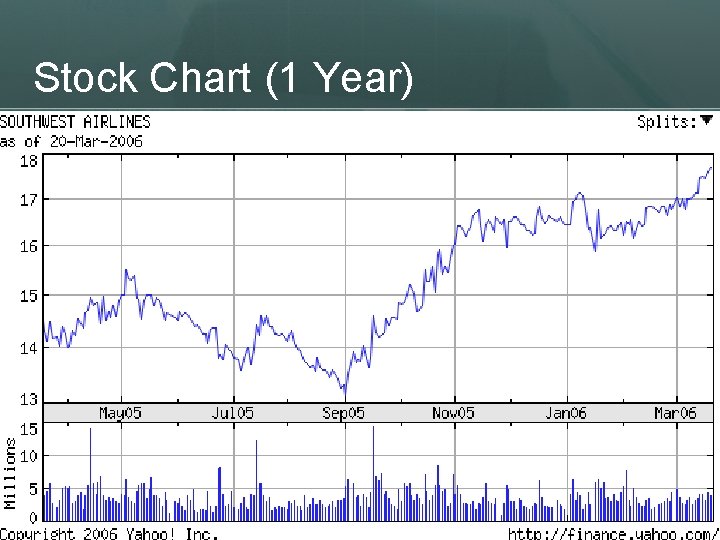
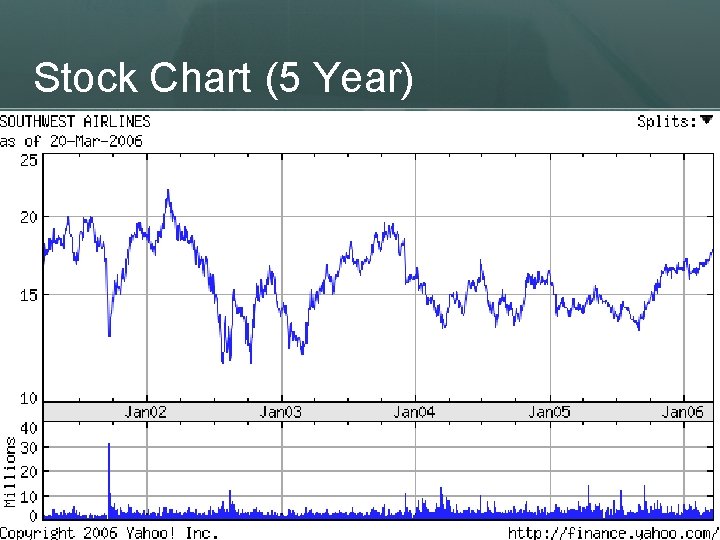
Company Snapshot l l l l Listed on: NYSE Symbol: LUV Industry: Regional Airlines Market Cap: $14. 14 B Stock Price: $17. 65 (Closing 03/24/06) Dividend Yield: . 02 (0. 10%) P/E: 26. 23 Shares Outstanding: 804, 661, 597
Background l 1967: Incorporated in Texas (Rollin King and Herb l 1971: Commenced service with 3 Boeing 737 s serving Dallas, Houston, and San Antonio Short to medium-haul point-to-point regional carrier Today: 448 Boeing 737 s, 61 cities, 31 states 31, 729 employees as of January 1, 2006 Posted 33 rd consecutive year of profits in 2005 Largest US carrier based on originating US passengers boarded and scheduled US departures l l l Kelleher)
Mission l “Dedication to the highest quality of customer service delivered with a sense of warmth, friendliness, individual pride, and company spirit. ” l “… to provide our employees a stable work environment with equal opportunity for learning and personal growth. ”
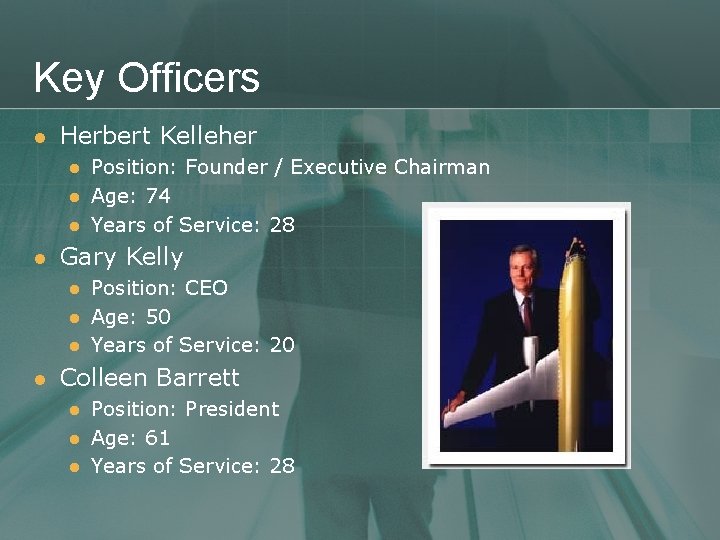
Key Officers l Herbert Kelleher l l Gary Kelly l l Position: Founder / Executive Chairman Age: 74 Years of Service: 28 Position: CEO Age: 50 Years of Service: 20 Colleen Barrett l l l Position: President Age: 61 Years of Service: 28
Quick Facts Average passenger airfare is $93. 68 l Average passenger trip is 775 miles l Ranked first in customer satisfaction l Adopted the first profit sharing plan in US airline industry in 1973 l l Employees own at least 10% of stock Member of fortune 500 l Received 260, 109 resumes and hired 2, 766 new Employees in 2005 l
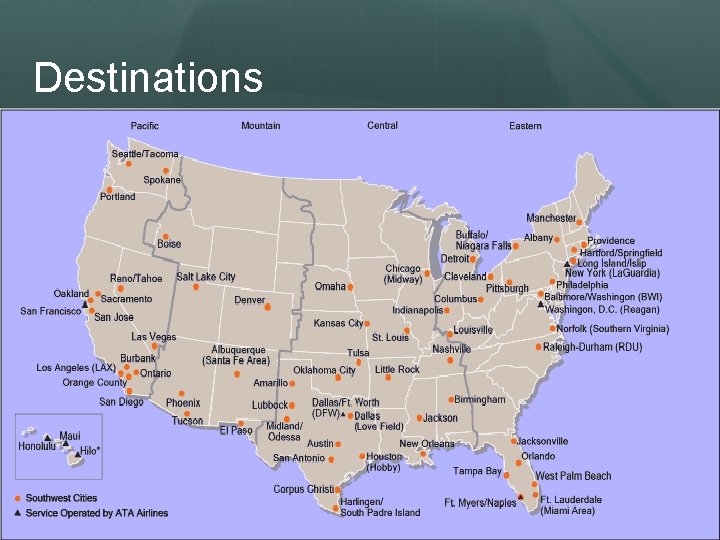
Destinations
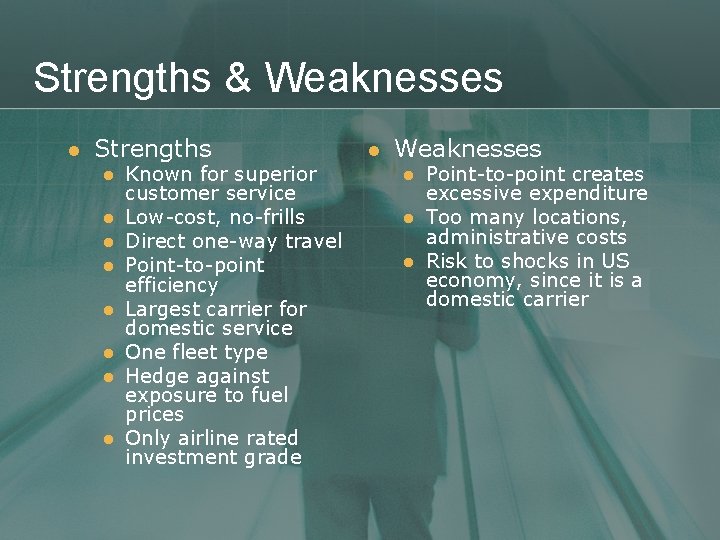
Strengths & Weaknesses l Strengths l l l l Known for superior customer service Low-cost, no-frills Direct one-way travel Point-to-point efficiency Largest carrier for domestic service One fleet type Hedge against exposure to fuel prices Only airline rated investment grade l Weaknesses l l l Point-to-point creates excessive expenditure Too many locations, administrative costs Risk to shocks in US economy, since it is a domestic carrier
Operating Expenses

Fuel Costs
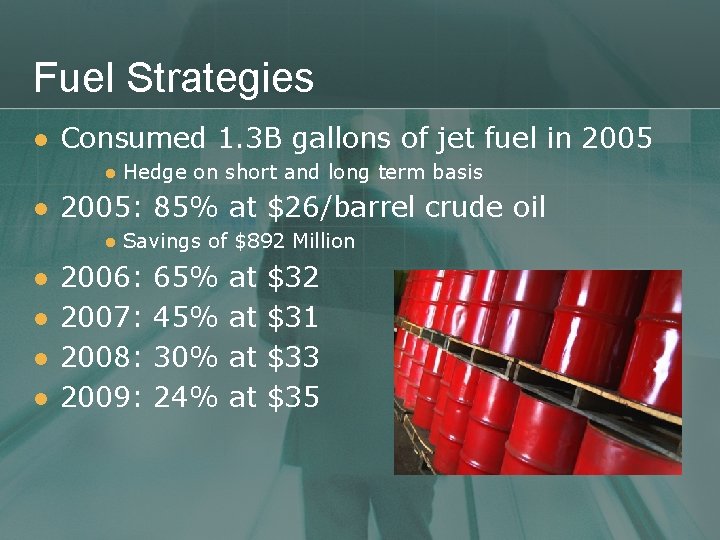
Fuel Strategies l Consumed 1. 3 B gallons of jet fuel in 2005 l l 2005: 85% at $26/barrel crude oil l l Hedge on short and long term basis Savings of $892 Million 2006: 2007: 2008: 2009: 65% 45% 30% 24% at at $32 $31 $33 $35
Competition and Challenges Increasing low fare and lower cost competition l Rising fuel costs l Competition from surface transportation in short-haul markets l
Risk Factors Business very sensitive to price of fuel l Business is labour intensive l l 82% of employees are unionized Relies heavily on technology for daily operations l Changes in government regulation can have a major impact on business l Airline industry is very competitive l
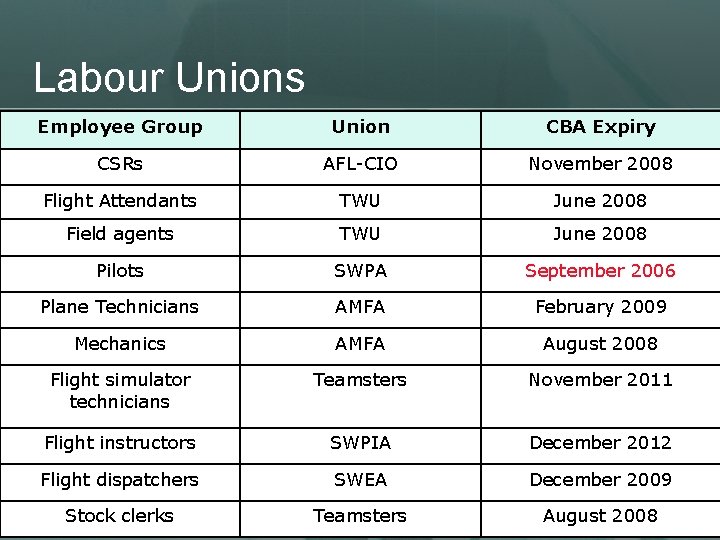
Labour Unions Employee Group Union CBA Expiry CSRs AFL-CIO November 2008 Flight Attendants TWU June 2008 Field agents TWU June 2008 Pilots SWPA September 2006 Plane Technicians AMFA February 2009 Mechanics AMFA August 2008 Flight simulator technicians Teamsters November 2011 Flight instructors SWPIA December 2012 Flight dispatchers SWEA December 2009 Stock clerks Teamsters August 2008
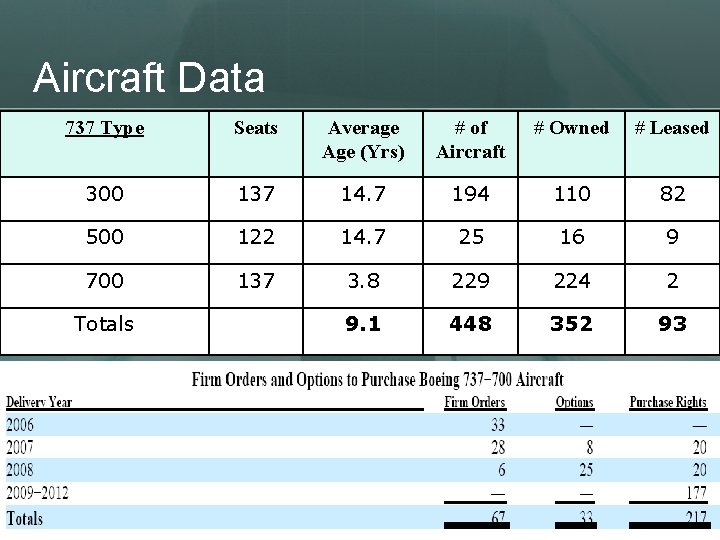
Aircraft Data 737 Type Seats Average Age (Yrs) # of Aircraft # Owned # Leased 300 137 14. 7 194 110 82 500 122 14. 7 25 16 9 700 137 3. 8 229 224 2 9. 1 448 352 93 Totals
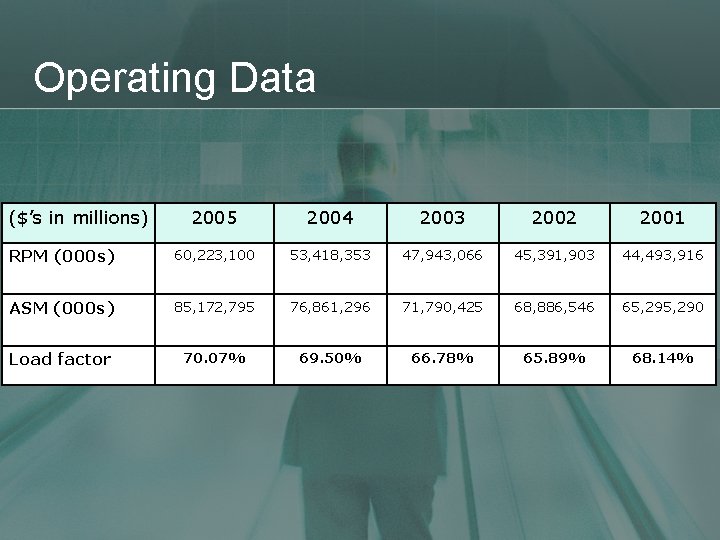
Operating Data ($’s in millions) 2005 2004 2003 2002 2001 RPM (000 s) 60, 223, 100 53, 418, 353 47, 943, 066 45, 391, 903 44, 493, 916 ASM (000 s) 85, 172, 795 76, 861, 296 71, 790, 425 68, 886, 546 65, 290 Load factor 70. 07% 69. 50% 66. 78% 65. 89% 68. 14%

Financials
Revenue Composition
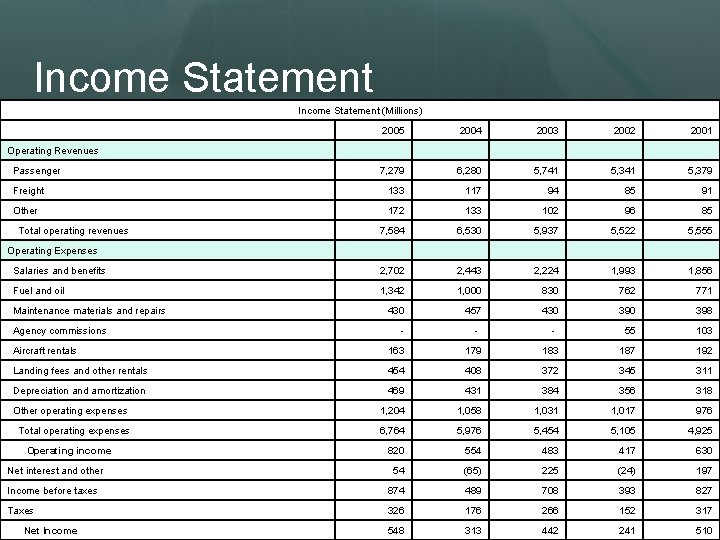
Income Statement (Millions) Operating Revenues 2005 Passenger 2004 2003 2002 2001 7, 279 6, 280 5, 741 5, 379 Freight 133 117 94 85 91 Other 172 133 102 96 85 7, 584 6, 530 5, 937 5, 522 5, 555 Total operating revenues Operating Expenses Salaries and benefits 2, 702 2, 443 2, 224 1, 993 1, 856 Fuel and oil 1, 342 1, 000 830 762 771 430 457 430 398 - - - 55 103 Aircraft rentals 163 179 183 187 192 Landing fees and other rentals 454 408 372 345 311 Depreciation and amortization 469 431 384 356 318 Other operating expenses 1, 204 1, 058 1, 031 1, 017 976 Total operating expenses 6, 764 5, 976 5, 454 5, 105 4, 925 820 554 483 417 630 Net interest and other 54 (65) 225 (24) 197 Income before taxes 874 489 708 393 827 Taxes 326 176 266 152 317 Net Income 548 313 442 241 510 Maintenance materials and repairs Agency commissions Operating income
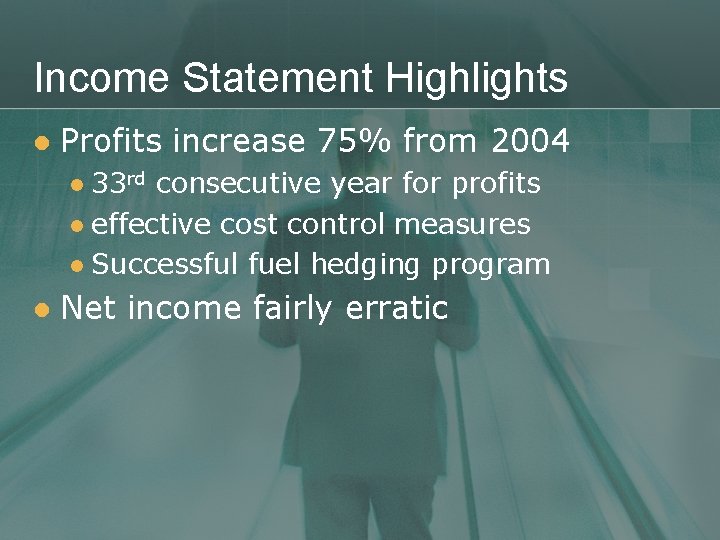
Income Statement Highlights l Profits increase 75% from 2004 33 rd consecutive year for profits l effective cost control measures l Successful fuel hedging program l l Net income fairly erratic
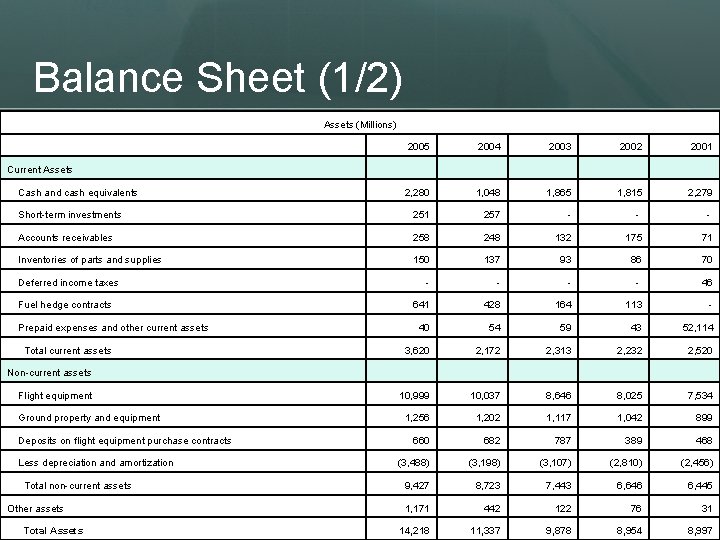
Balance Sheet (1/2) Assets (Millions) Current Assets 2005 Cash and cash equivalents 2004 2003 2002 2001 2, 280 1, 048 1, 865 1, 815 2, 279 Short-term investments 251 257 - - - Accounts receivables 258 248 132 175 71 Inventories of parts and supplies 150 137 93 86 70 - - - - 46 641 428 164 113 - 40 54 59 43 52, 114 3, 620 2, 172 2, 313 2, 232 2, 520 Deferred income taxes Fuel hedge contracts Prepaid expenses and other current assets Total current assets Non-current assets Flight equipment 10, 999 10, 037 8, 646 8, 025 7, 534 1, 256 1, 202 1, 117 1, 042 899 660 682 787 389 468 (3, 488) (3, 198) (3, 107) (2, 810) (2, 456) Total non-current assets 9, 427 8, 723 7, 443 6, 646 6, 445 Other assets 1, 171 442 122 76 31 14, 218 11, 337 9, 878 8, 954 8, 997 Ground property and equipment Deposits on flight equipment purchase contracts Less depreciation and amortization Total Assets
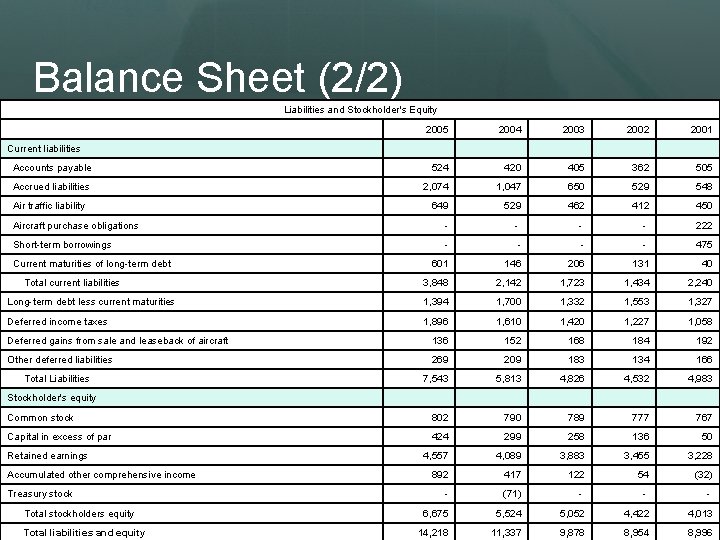
Balance Sheet (2/2) Liabilities and Stockholder's Equity Current liabilities 2005 2004 2003 2002 2001 Accounts payable 524 420 405 362 505 Accrued liabilities 2, 074 1, 047 650 529 548 649 529 462 412 450 Aircraft purchase obligations - - - - 222 Short-term borrowings - - - - 475 601 146 206 131 40 Total current liabilities 3, 848 2, 142 1, 723 1, 434 2, 240 Long-term debt less current maturities 1, 394 1, 700 1, 332 1, 553 1, 327 Deferred income taxes 1, 896 1, 610 1, 420 1, 227 1, 058 Deferred gains from sale and leaseback of aircraft 136 152 168 184 192 Other deferred liabilities 269 209 183 134 166 7, 543 5, 813 4, 826 4, 532 4, 983 Air traffic liability Current maturities of long-term debt Total Liabilities Stockholder's equity Common stock 802 790 789 777 767 Capital in excess of par 424 299 258 136 50 4, 557 4, 089 3, 883 3, 455 3, 228 892 417 122 54 (32) - (71) - - - 6, 675 5, 524 5, 052 4, 422 4, 013 14, 218 11, 337 9, 878 8, 954 8, 996 Retained earnings Accumulated other comprehensive income Treasury stock Total stockholders equity Total liabilities and equity
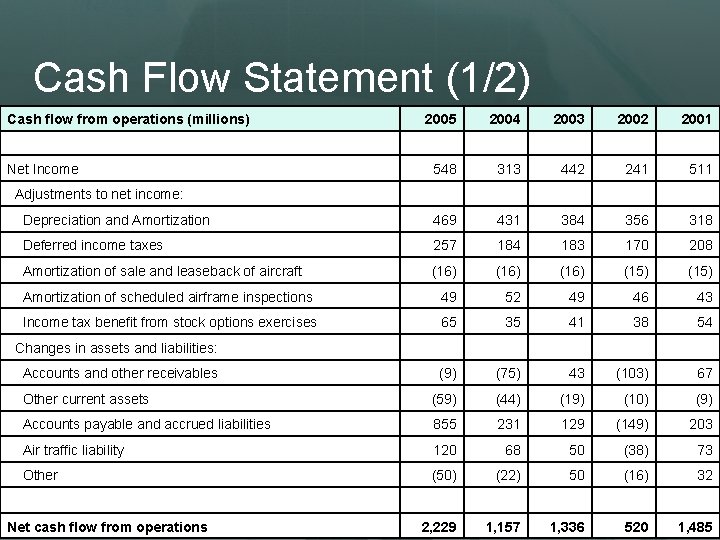
Cash Flow Statement (1/2) Cash flow from operations (millions) 2005 Net Income Adjustments to net income: 2004 548 2003 313 2002 442 2001 241 511 Depreciation and Amortization 469 431 384 356 318 Deferred income taxes 257 184 183 170 208 Amortization of sale and leaseback of aircraft (16) (15) Amortization of scheduled airframe inspections 49 52 49 46 43 Income tax benefit from stock options exercises 65 35 41 38 54 Changes in assets and liabilities: Accounts and other receivables (9) (75) 43 (103) 67 Other current assets (59) (44) (19) (10) (9) Accounts payable and accrued liabilities 855 231 129 (149) 203 Air traffic liability 120 68 50 (38) 73 Other (50) (22) 50 (16) 32 Net cash flow from operations 2, 229 1, 157 1, 336 520 1, 485
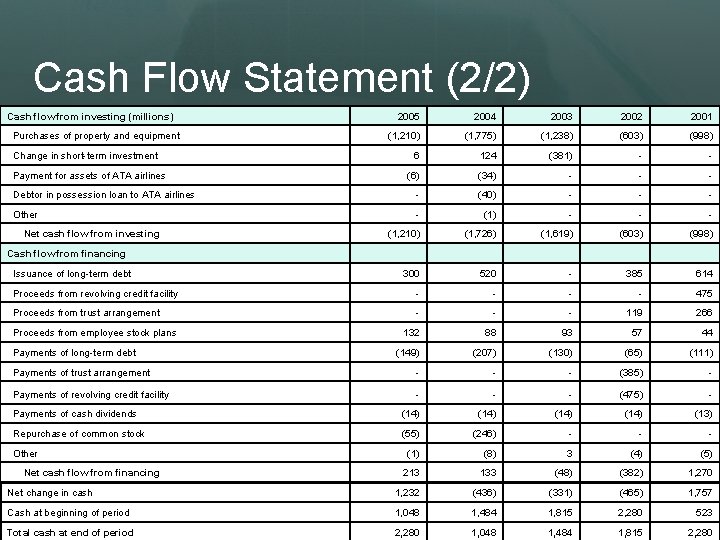
Cash Flow Statement (2/2) Cash flow from investing (millions) 2005 2004 2003 2002 2001 (1, 210) (1, 775) (1, 238) (603) (998) 6 124 (381) - - (6) (34) - - - Debtor in possession loan to ATA airlines - (40) - - - Other - (1) - - - (1, 210) (1, 726) (1, 619) (603) (998) Purchases of property and equipment Change in short-term investment Payment for assets of ATA airlines Net cash flow from investing Cash flow from financing Issuance of long-term debt 300 520 - 385 614 Proceeds from revolving credit facility - - 475 Proceeds from trust arrangement - - - 119 266 132 88 93 57 44 (149) (207) (130) (65) (111) Payments of trust arrangement - - - (385) - Payments of revolving credit facility - - - (475) - Payments of cash dividends (14) (13) Repurchase of common stock (55) (246) - - - (1) (8) 3 (4) (5) 213 133 (48) (382) 1, 270 Net change in cash 1, 232 (436) (331) (465) 1, 757 Cash at beginning of period 1, 048 1, 484 1, 815 2, 280 523 Total cash at end of period 2, 280 1, 048 1, 484 1, 815 2, 280 Proceeds from employee stock plans Payments of long-term debt Other Net cash flow from financing
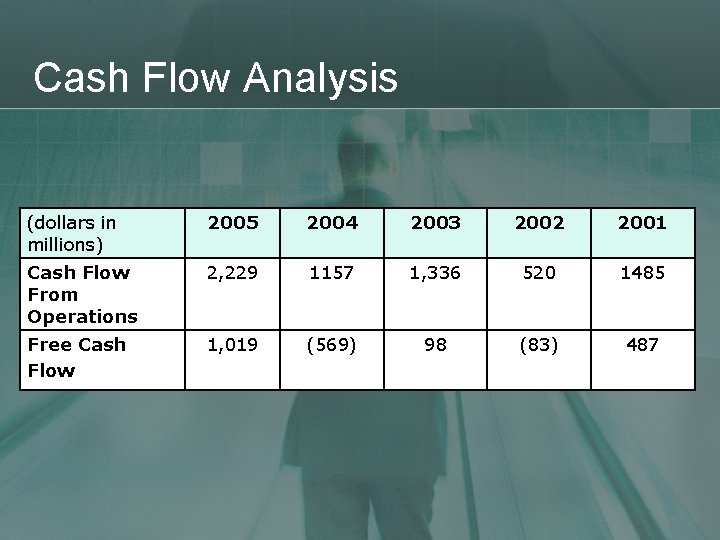
Cash Flow Analysis (dollars in millions) 2005 2004 2003 2002 2001 Cash Flow From Operations 2, 229 1157 1, 336 520 1485 Free Cash Flow 1, 019 (569) 98 (83) 487
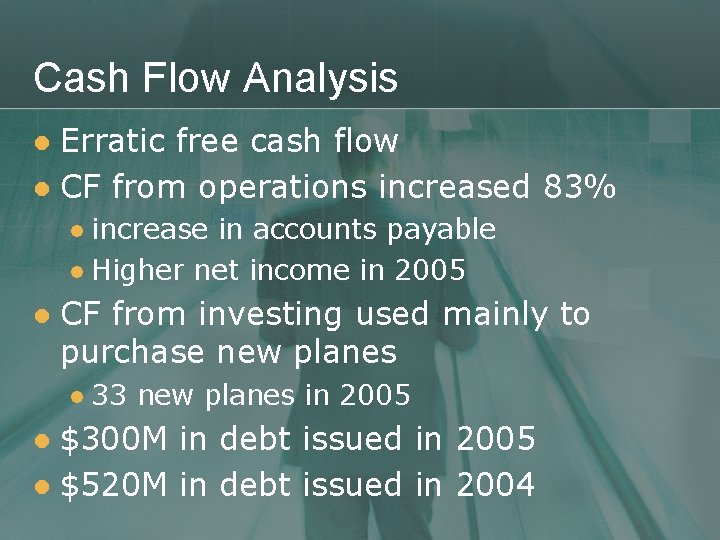
Cash Flow Analysis Erratic free cash flow l CF from operations increased 83% l increase in accounts payable l Higher net income in 2005 l l CF from investing used mainly to purchase new planes l 33 new planes in 2005 $300 M in debt issued in 2005 l $520 M in debt issued in 2004 l
Stock Chart (1 Year)
Stock Chart (5 Year)
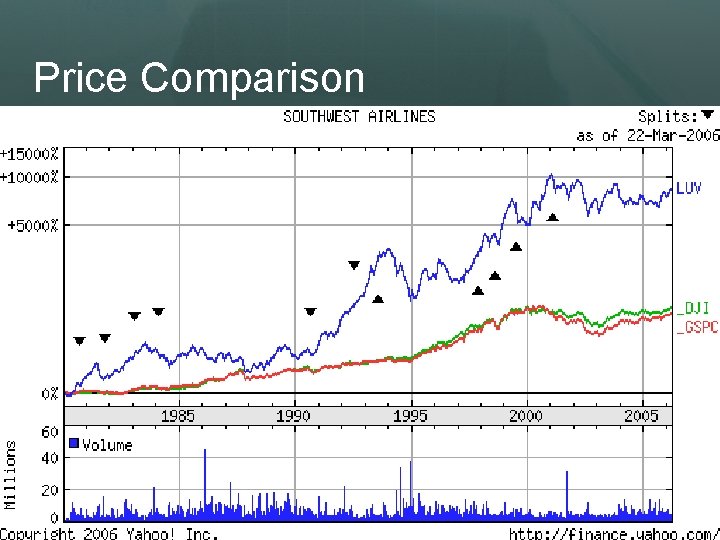
Price Comparison
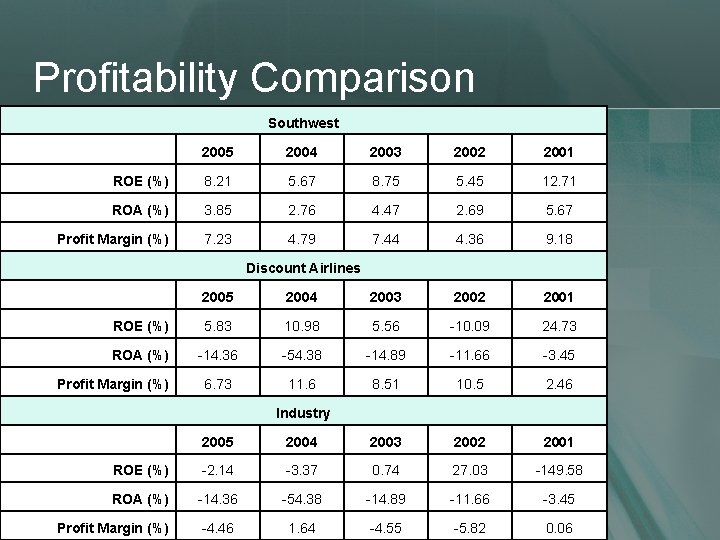
Profitability Comparison Southwest 2005 2004 2003 2002 2001 ROE (%) 8. 21 5. 67 8. 75 5. 45 12. 71 ROA (%) 3. 85 2. 76 4. 47 2. 69 5. 67 Profit Margin (%) 7. 23 4. 79 7. 44 4. 36 9. 18 Discount Airlines 2005 2004 2003 2002 2001 ROE (%) 5. 83 10. 98 5. 56 -10. 09 24. 73 ROA (%) -14. 36 -54. 38 -14. 89 -11. 66 -3. 45 6. 73 11. 6 8. 51 10. 5 2. 46 Profit Margin (%) Industry 2005 2004 2003 2002 2001 ROE (%) -2. 14 -3. 37 0. 74 27. 03 -149. 58 ROA (%) -14. 36 -54. 38 -14. 89 -11. 66 -3. 45 Profit Margin (%) -4. 46 1. 64 -4. 55 -5. 82 0. 06
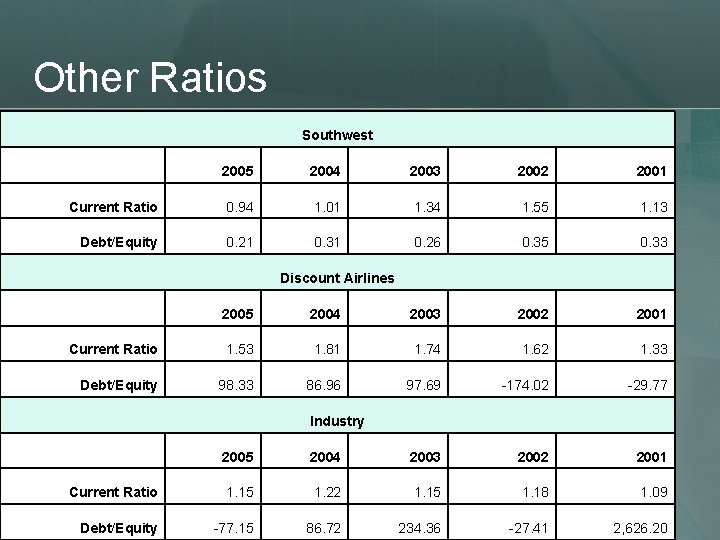
Other Ratios Southwest 2005 2004 2003 2002 2001 Current Ratio 0. 94 1. 01 1. 34 1. 55 1. 13 Debt/Equity 0. 21 0. 31 0. 26 0. 35 0. 33 Discount Airlines 2005 2004 2003 2002 2001 Current Ratio 1. 53 1. 81 1. 74 1. 62 1. 33 Debt/Equity 98. 33 86. 96 97. 69 -174. 02 -29. 77 Industry 2005 2004 2003 2002 2001 Current Ratio 1. 15 1. 22 1. 15 1. 18 1. 09 Debt/Equity -77. 15 86. 72 234. 36 -27. 41 2, 626. 20
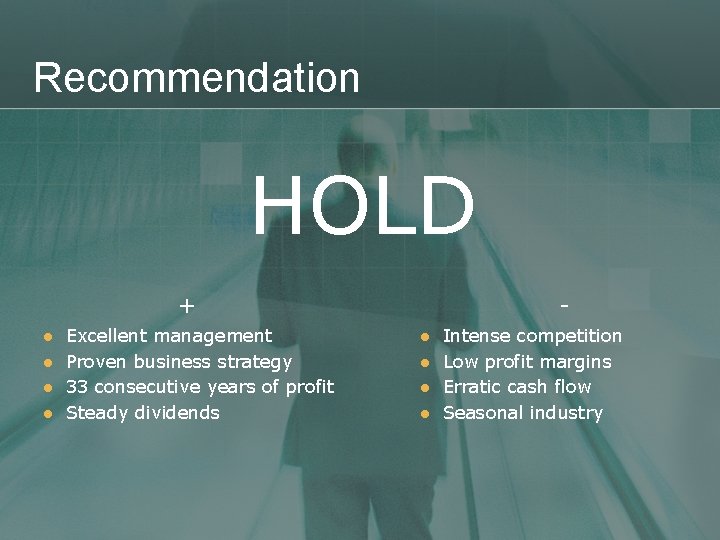
Recommendation HOLD + l l Excellent management Proven business strategy 33 consecutive years of profit Steady dividends l l Intense competition Low profit margins Erratic cash flow Seasonal industry
Thank You Come Again!!
Singapore Airlines
Background • • • Founded in 1972. National airline of Singapore. Second largest carrier by market value. Full member of global Star Alliance. Route network reaches out to over 90 destinations in close to 40 countries. • Numerous awards. • Trades in US as an ADR (Symbol: SPAAF).
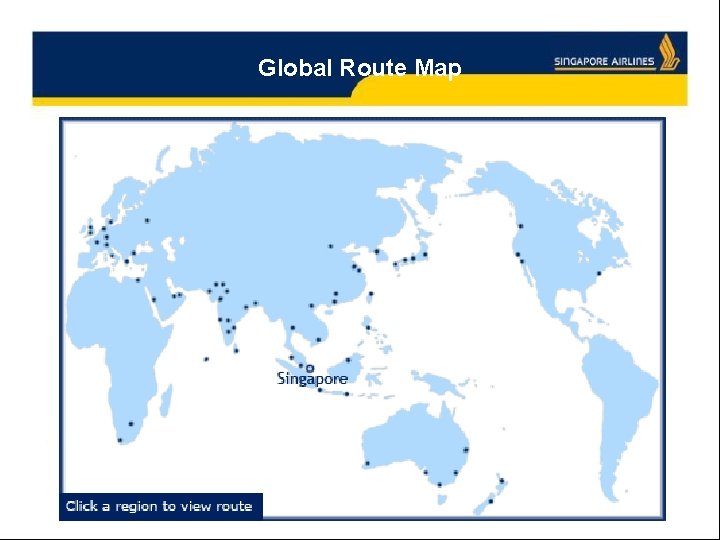
Global Route Map
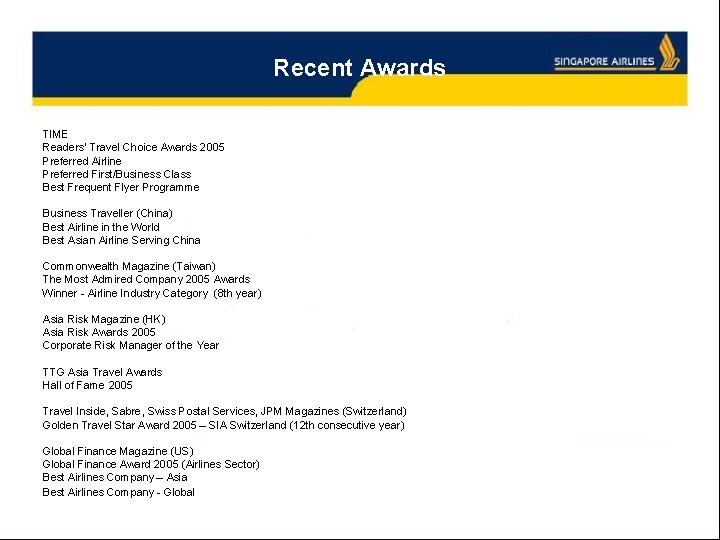
Recent Awards TIME Readers' Travel Choice Awards 2005 Preferred Airline Preferred First/Business Class Best Frequent Flyer Programme Business Traveller (China) Best Airline in the World Best Asian Airline Serving China Commonwealth Magazine (Taiwan) The Most Admired Company 2005 Awards Winner - Airline Industry Category (8 th year) Asia Risk Magazine (HK) Asia Risk Awards 2005 Corporate Risk Manager of the Year TTG Asia Travel Awards Hall of Fame 2005 Travel Inside, Sabre, Swiss Postal Services, JPM Magazines (Switzerland) Golden Travel Star Award 2005 – SIA Switzerland (12 th consecutive year) Global Finance Magazine (US) Global Finance Award 2005 (Airlines Sector) Best Airlines Company – Asia Best Airlines Company - Global
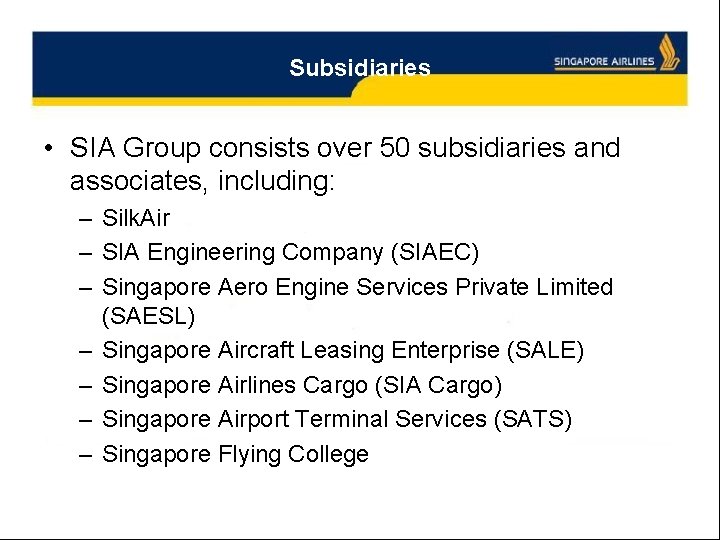
Subsidiaries • SIA Group consists over 50 subsidiaries and associates, including: – Silk. Air – SIA Engineering Company (SIAEC) – Singapore Aero Engine Services Private Limited (SAESL) – Singapore Aircraft Leasing Enterprise (SALE) – Singapore Airlines Cargo (SIA Cargo) – Singapore Airport Terminal Services (SATS) – Singapore Flying College
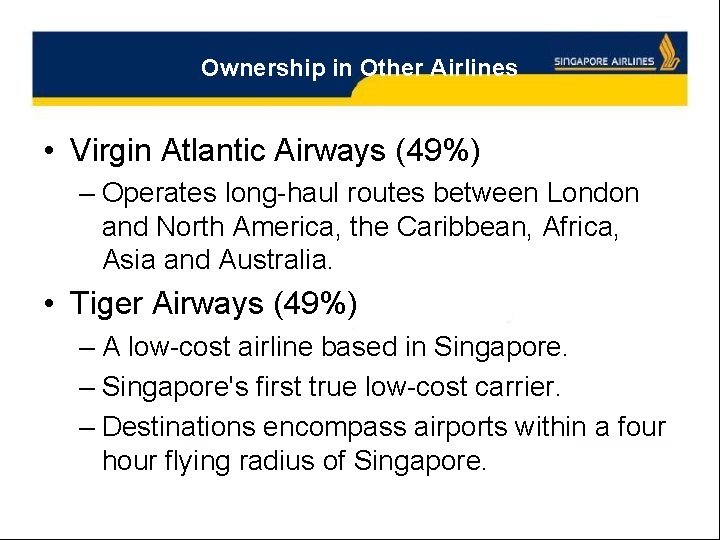
Ownership in Other Airlines • Virgin Atlantic Airways (49%) – Operates long-haul routes between London and North America, the Caribbean, Africa, Asia and Australia. • Tiger Airways (49%) – A low-cost airline based in Singapore. – Singapore's first true low-cost carrier. – Destinations encompass airports within a four hour flying radius of Singapore.
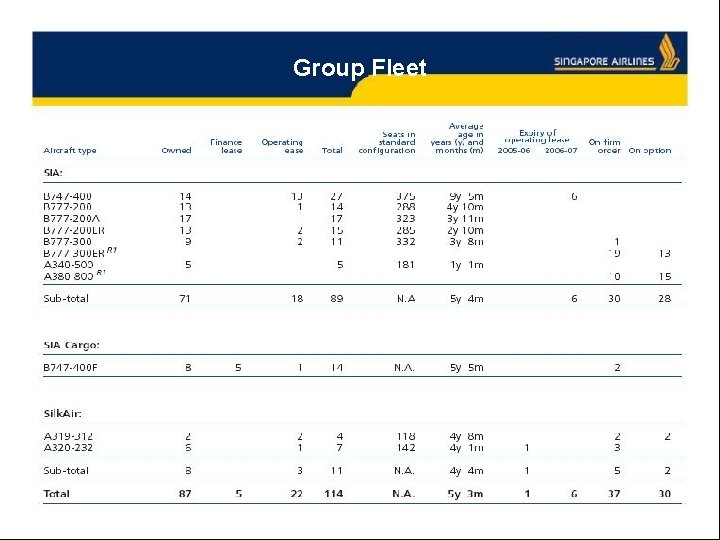
Group Fleet
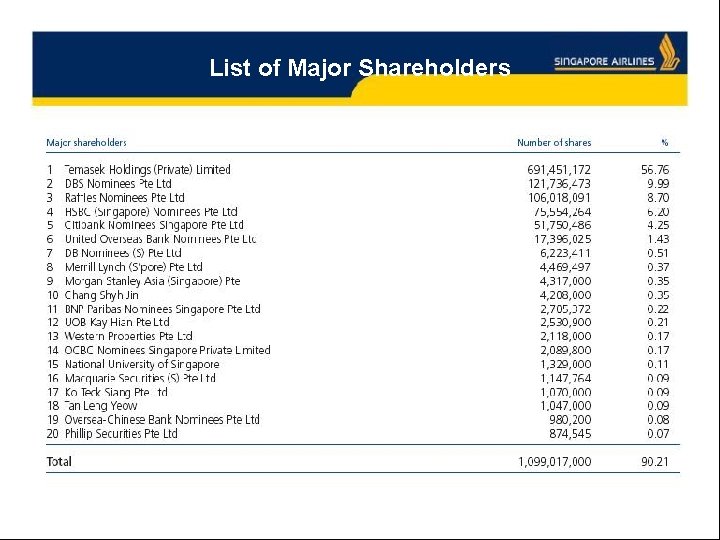
List of Major Shareholders
Temasek Holdings • Temasek Holdings – Owns and manages the Singapore Government's direct investments, both locally and overseas. – Singapore Ministry of Finance is the single shareholder of Temasek Holdings.
DBS and Raffles • DBS – Set up in 1968 as a development financing institution led by the Singapore government. – Major shareholders include DBS, Raffles, and Temasek. • Raffles Holdings – Owned by Temasek and Capita. Land (which in turn is owned by Temasek). – Singapore Airlines is also a shareholder.
Objectives for Future Growth • Re-engineer business to meet any challenger head-on. • Develop a sustainable business position through careful cost management and planning. • Continue to work hard to access the heavyprotected Trans-Pacific route between Australia and the USA. • Launch the world’s largest aircraft, Airbus A 380, in 2006.
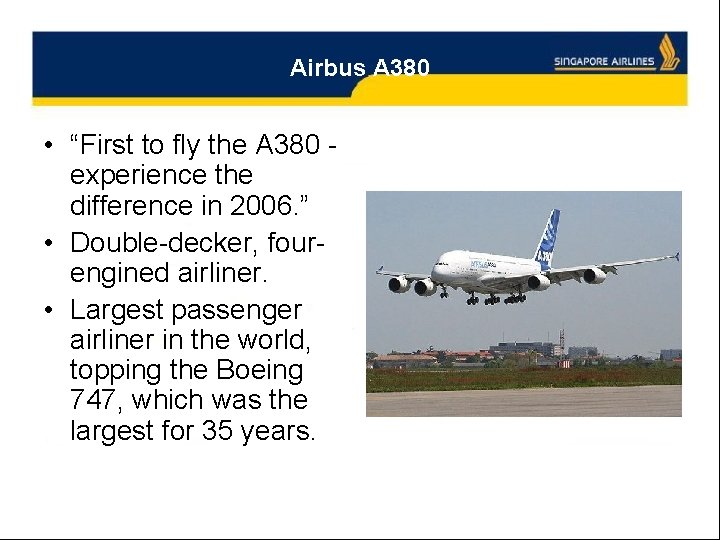
Airbus A 380 • “First to fly the A 380 - experience the difference in 2006. ” • Double-decker, fourengined airliner. • Largest passenger airliner in the world, topping the Boeing 747, which was the largest for 35 years.
Current Stock Information As of March 24, 2006 • Price: 14. 70 • 52 -week range: 11. 00 - 14. 90 • Shares outstanding: 1. 22 billion • Market capitalization: $17. 93 billion • Exchange rate: 0. 72 CAD/SGD • Dividend yield: 0. 68%
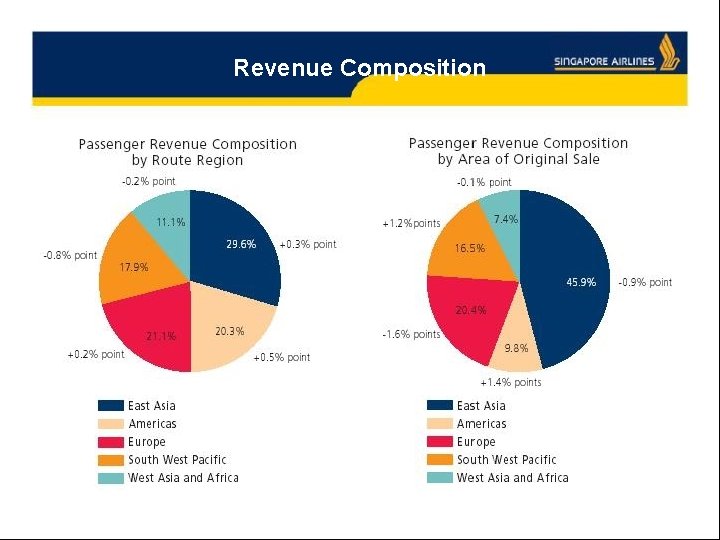
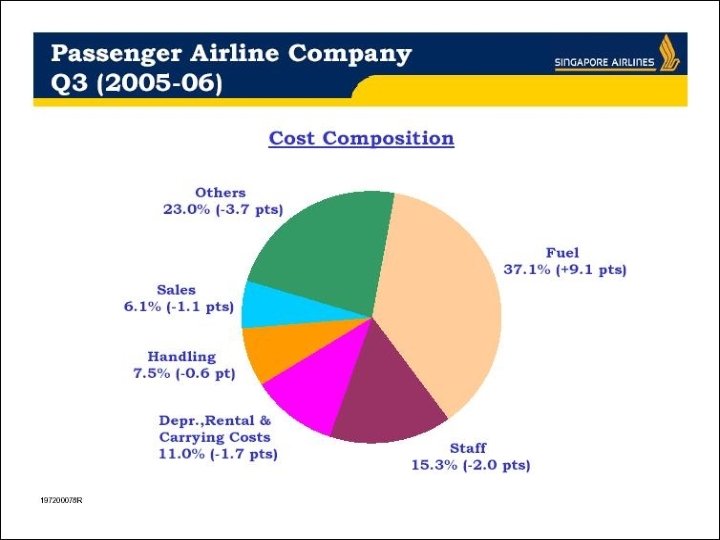
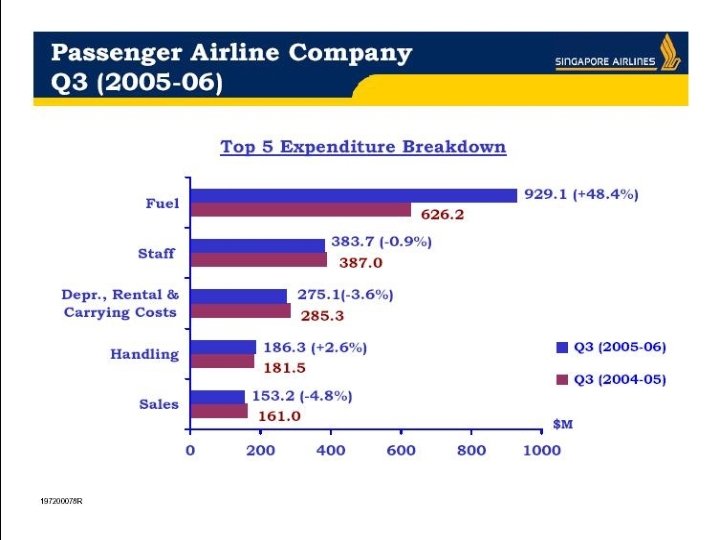
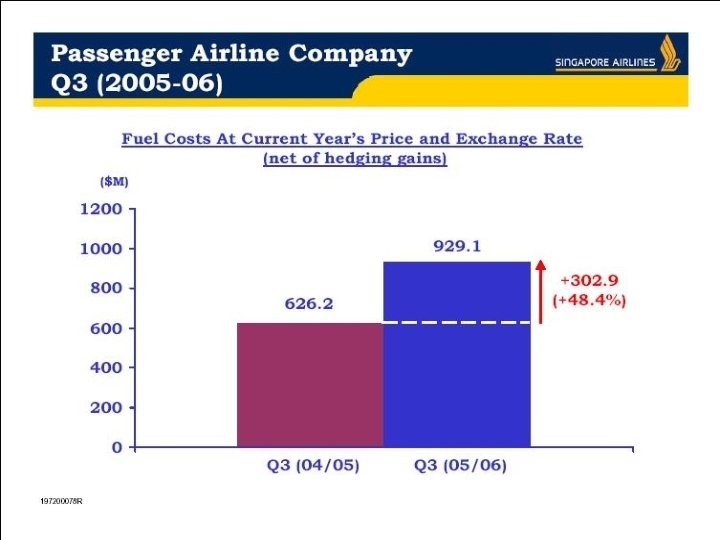
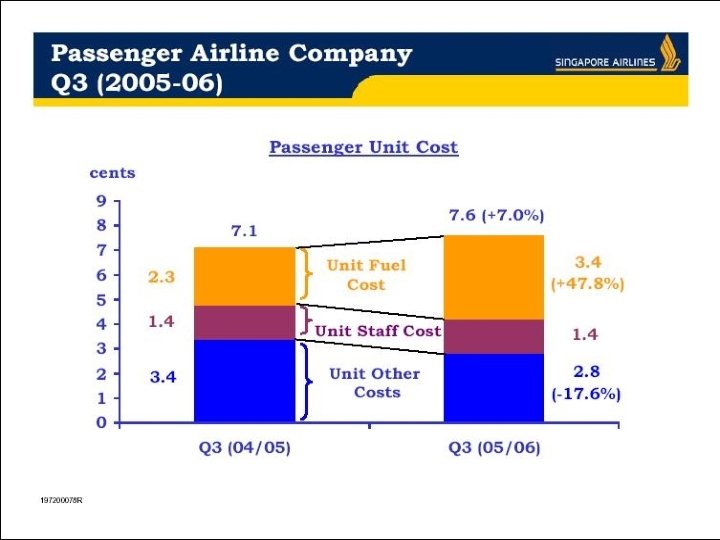
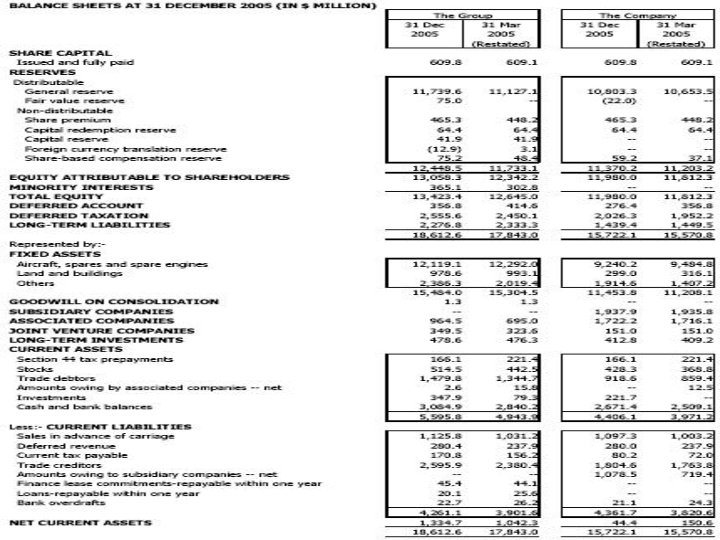
Revenue Composition
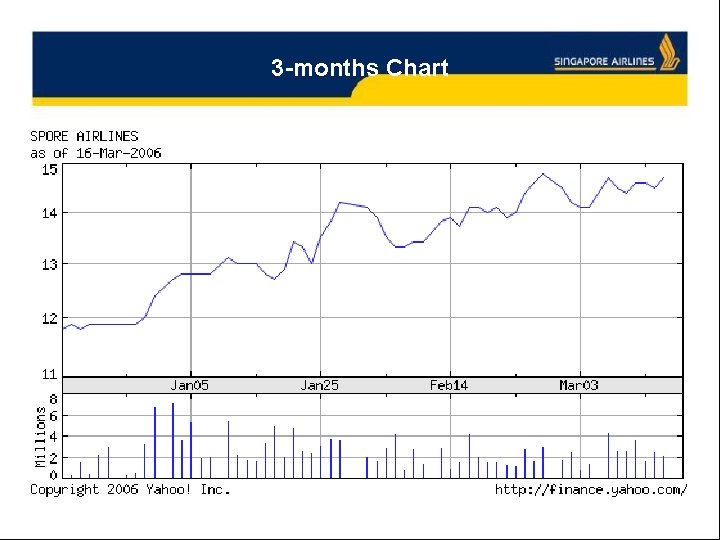
3 -months Chart
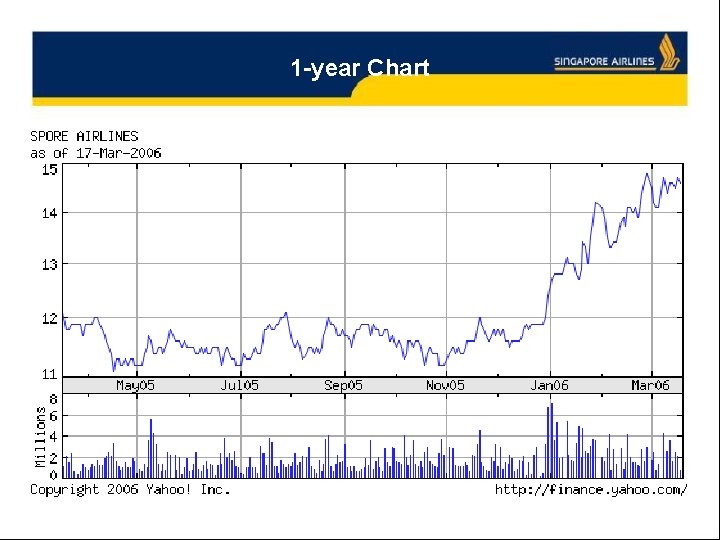
1 -year Chart
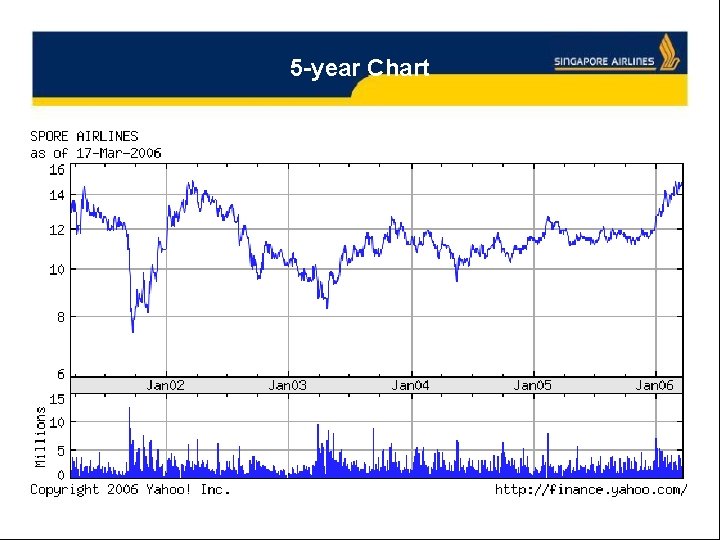
5 -year Chart
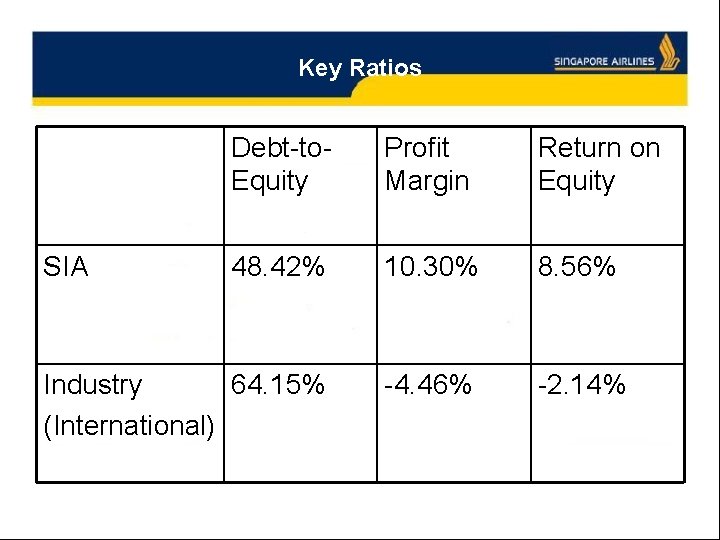
Key Ratios Debt-to. Equity Profit Margin Return on Equity 48. 42% 10. 30% 8. 56% Industry 64. 15% (International) -4. 46% -2. 14% SIA
Recommendations Don’t Buy!

AIR CANADA
Background l l l l Began on April 10, 1937, called Trans-Canada Airlines, subsidiary of Canadian National Railway Changed name to Air Canada since January 1, 1965. In 1989, Air Canada was completely privatized. In January 2000, acquired Canada’s second largest air carrier, Canadian Airlines. On April 1, 2003, filed for bankruptcy protection. On September 30, 2004, emerged from bankruptcy protection. ACE Aviation Holdings Inc. (ACE) is the new parent of Air Canada.
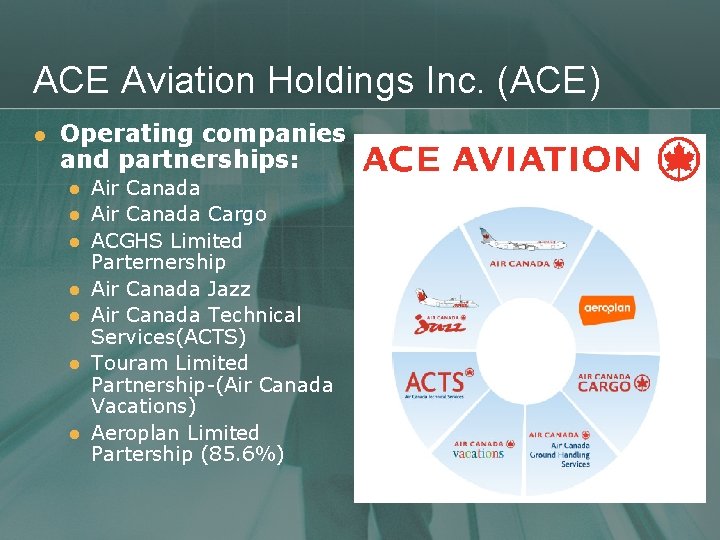
ACE Aviation Holdings Inc. (ACE) l Operating companies and partnerships: l l l l Air Canada Cargo ACGHS Limited Parternership Air Canada Jazz Air Canada Technical Services(ACTS) Touram Limited Partnership-(Air Canada Vacations) Aeroplan Limited Partership (85. 6%)
Current Stock Information As of March 24, 2006 l Ticker symbol: TSX: ACE. RV. T l Price: $34 l 52 -week range: $30. 25 -$43. 03 l Shares outstanding: 76, 852, 830 l Market capitalization: 2, 612, 996, 220 l Dividend yield: 0 l P/E Ratio: 12. 928
2005 Operating Revenues
2005 Operating Expenses
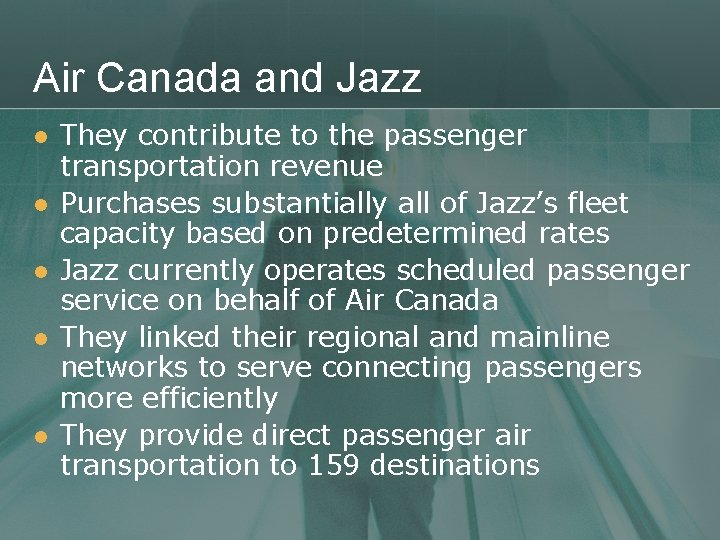
Air Canada and Jazz l l l They contribute to the passenger transportation revenue Purchases substantially all of Jazz’s fleet capacity based on predetermined rates Jazz currently operates scheduled passenger service on behalf of Air Canada They linked their regional and mainline networks to serve connecting passengers more efficiently They provide direct passenger air transportation to 159 destinations
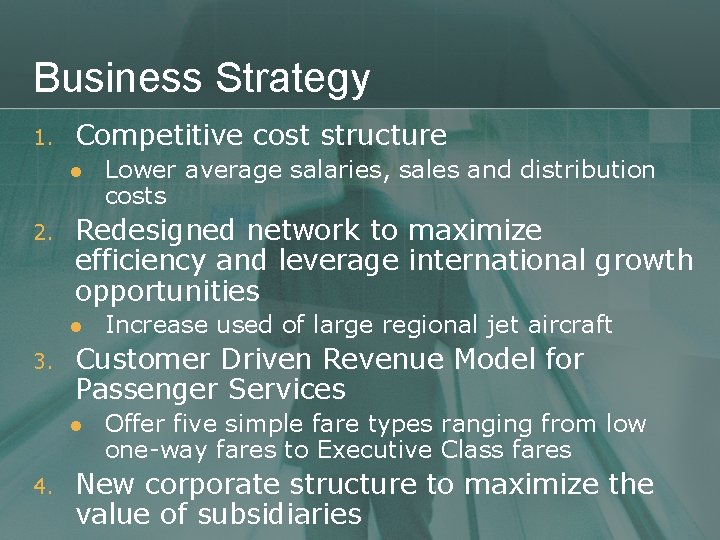
Business Strategy 1. Competitive cost structure l 2. Redesigned network to maximize efficiency and leverage international growth opportunities l 3. Increase used of large regional jet aircraft Customer Driven Revenue Model for Passenger Services l 4. Lower average salaries, sales and distribution costs Offer five simple fare types ranging from low one-way fares to Executive Class fares New corporate structure to maximize the value of subsidiaries
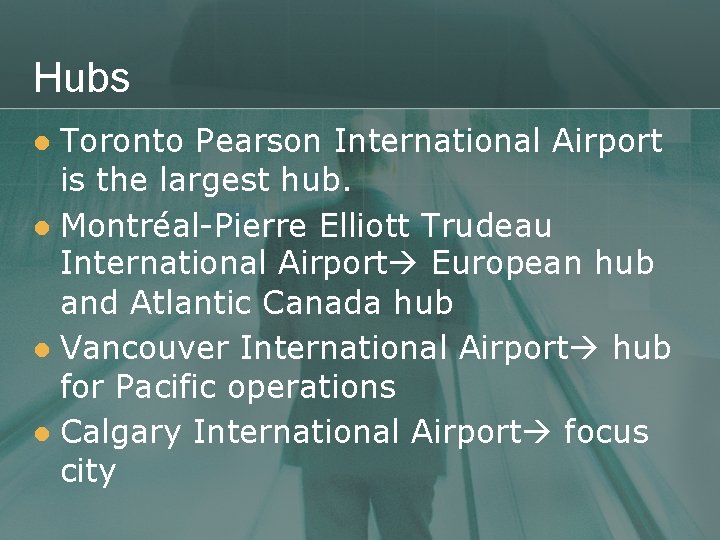
Hubs Toronto Pearson International Airport is the largest hub. l Montréal-Pierre Elliott Trudeau International Airport European hub and Atlantic Canada hub l Vancouver International Airport hub for Pacific operations l Calgary International Airport focus city l
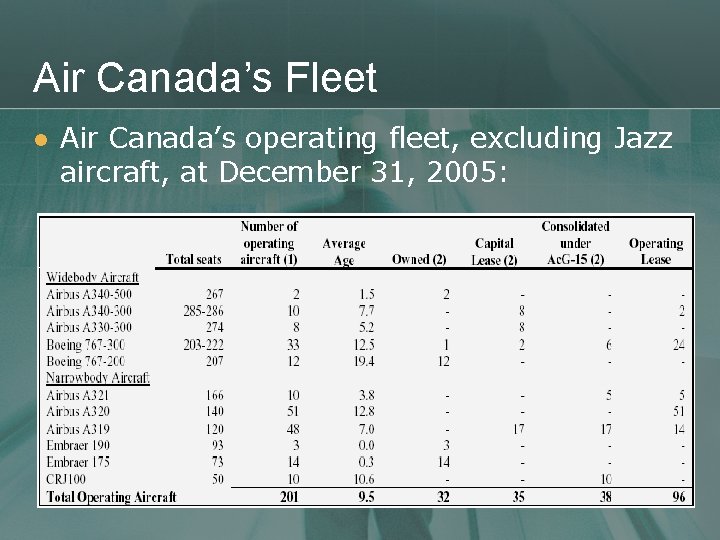
Air Canada’s Fleet l Air Canada’s operating fleet, excluding Jazz aircraft, at December 31, 2005:
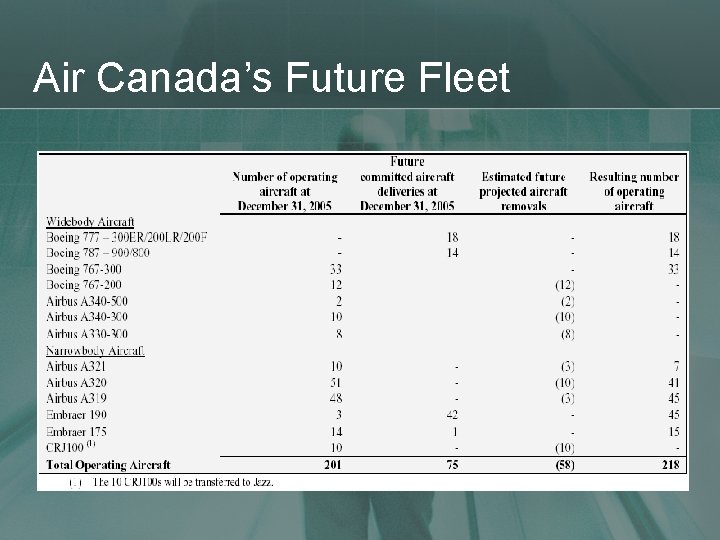
Air Canada’s Future Fleet
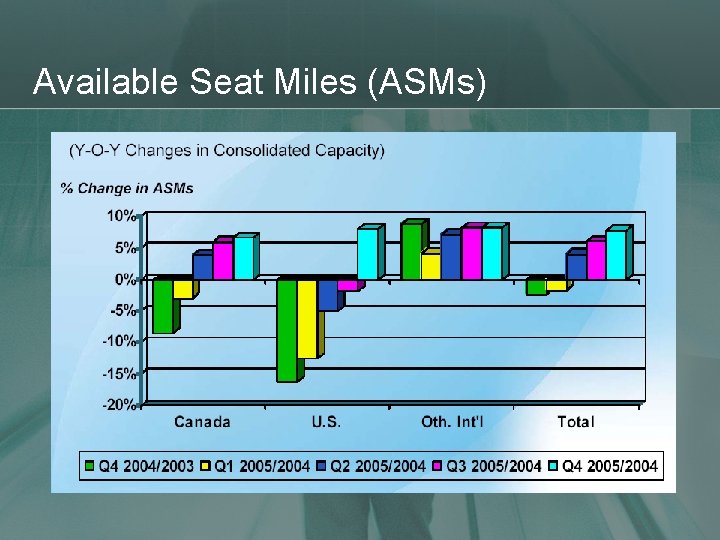
Available Seat Miles (ASMs)
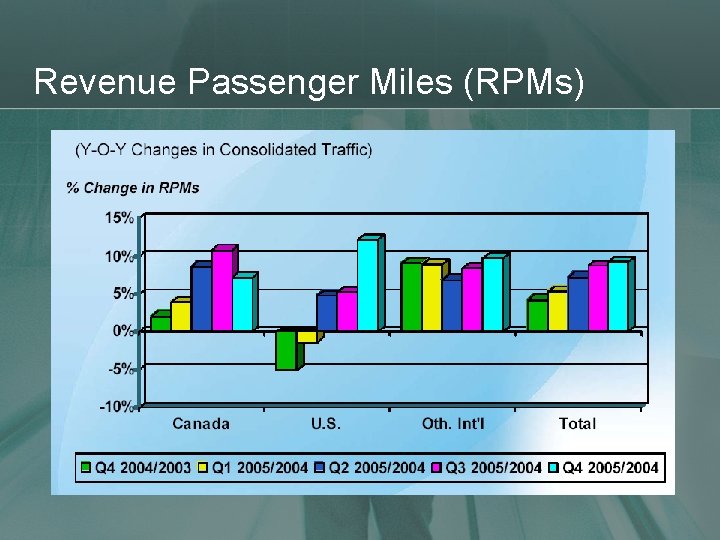
Revenue Passenger Miles (RPMs)
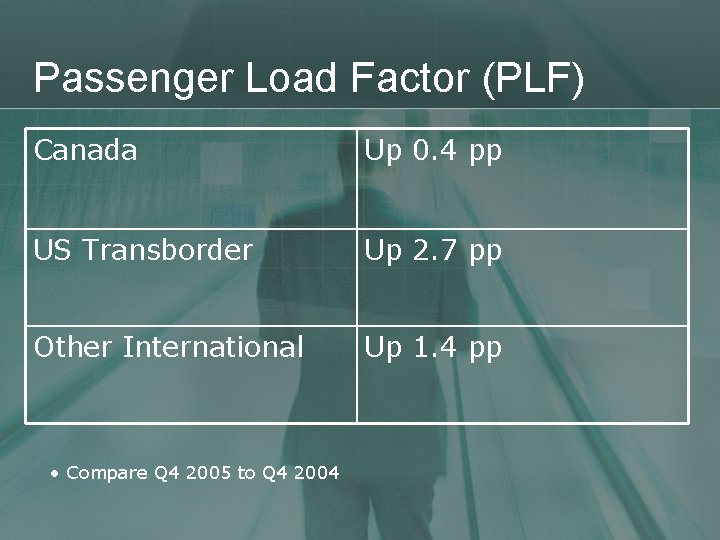
Passenger Load Factor (PLF) Canada Up 0. 4 pp US Transborder Up 2. 7 pp Other International Up 1. 4 pp • Compare Q 4 2005 to Q 4 2004
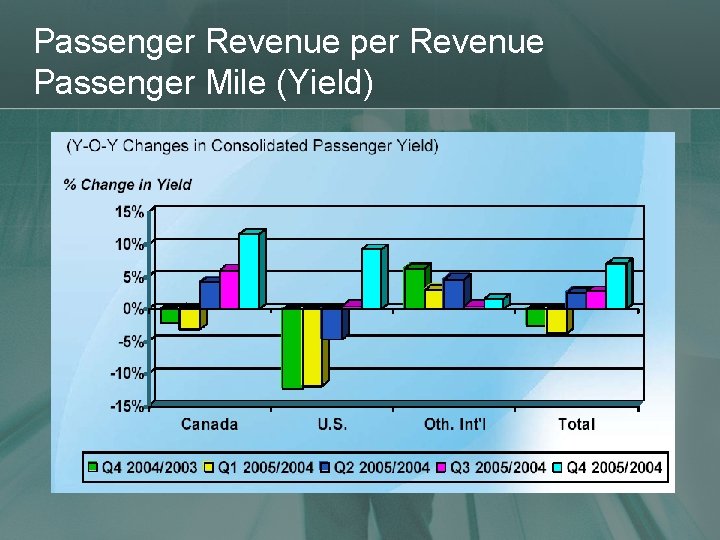
Passenger Revenue per Revenue Passenger Mile (Yield)
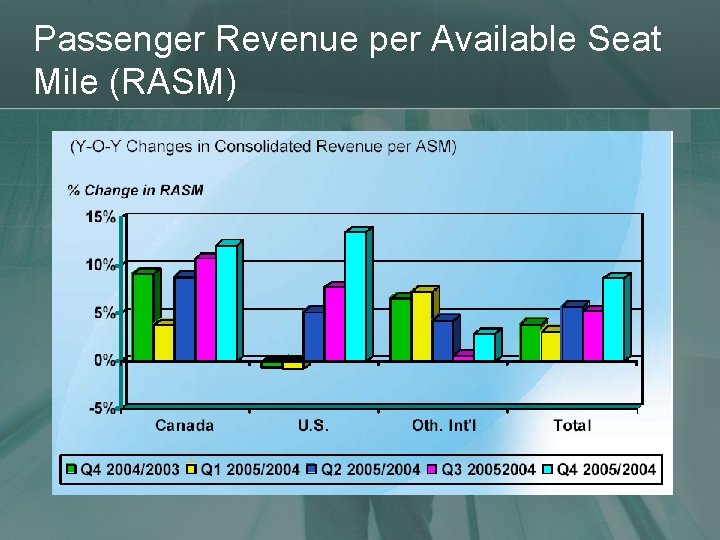
Passenger Revenue per Available Seat Mile (RASM)
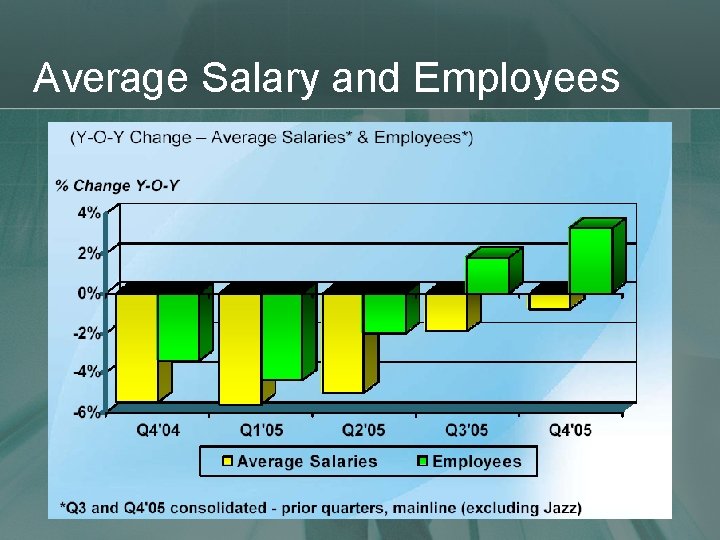
Average Salary and Employees
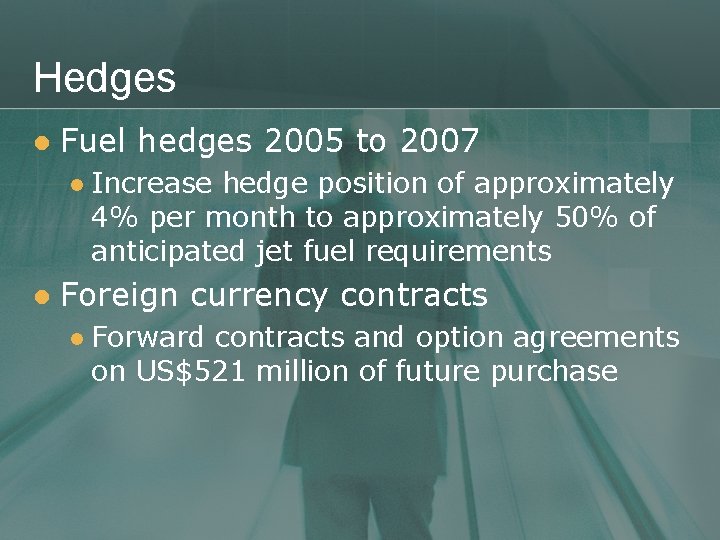
Hedges l Fuel hedges 2005 to 2007 l l Increase hedge position of approximately 4% per month to approximately 50% of anticipated jet fuel requirements Foreign currency contracts l Forward contracts and option agreements on US$521 million of future purchase

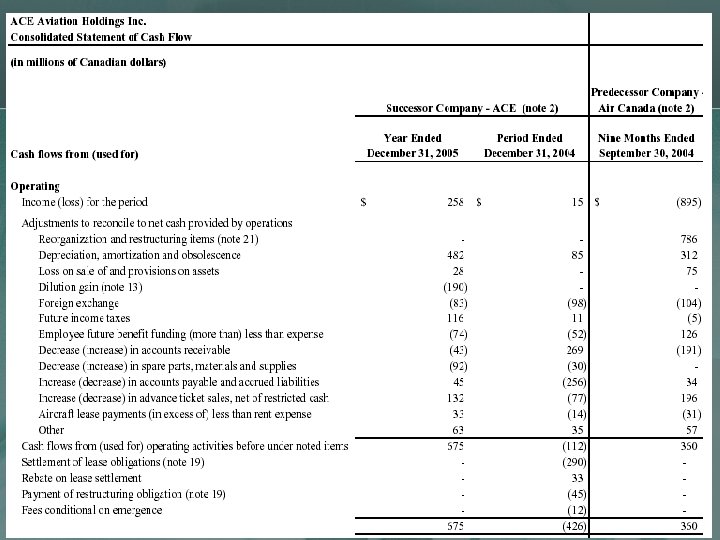
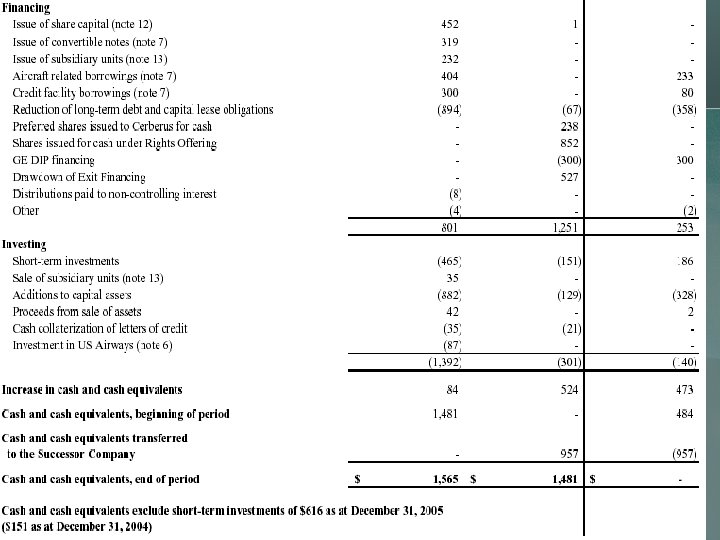
Financial Statements
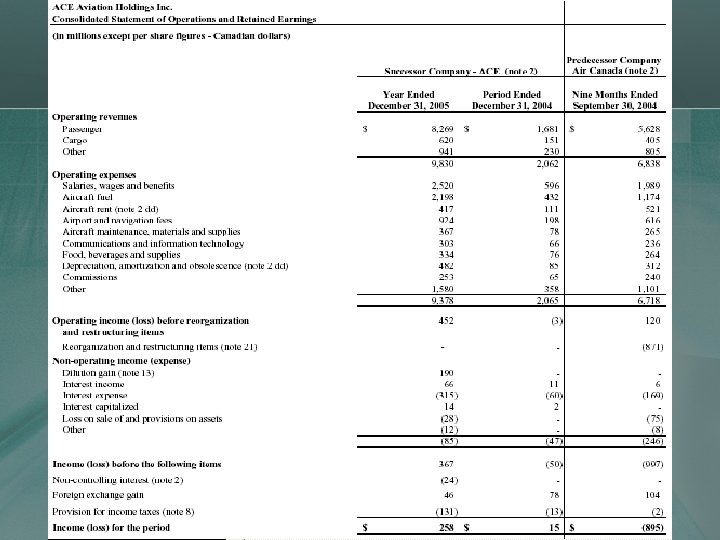
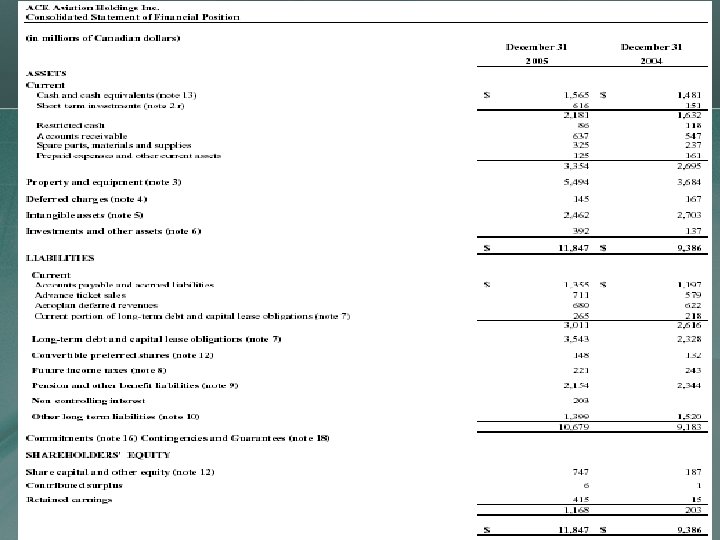
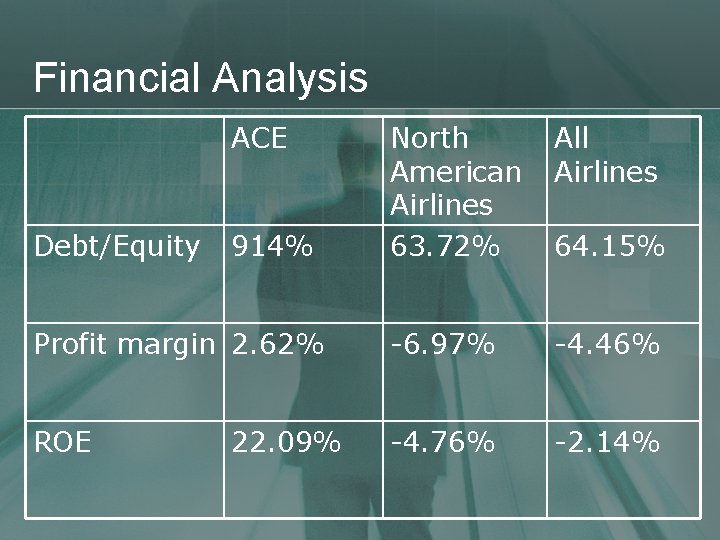
Financial Analysis ACE North American Airlines 63. 72% All Airlines Profit margin 2. 62% -6. 97% -4. 46% ROE -4. 76% -2. 14% Debt/Equity 914% 22. 09% 64. 15%
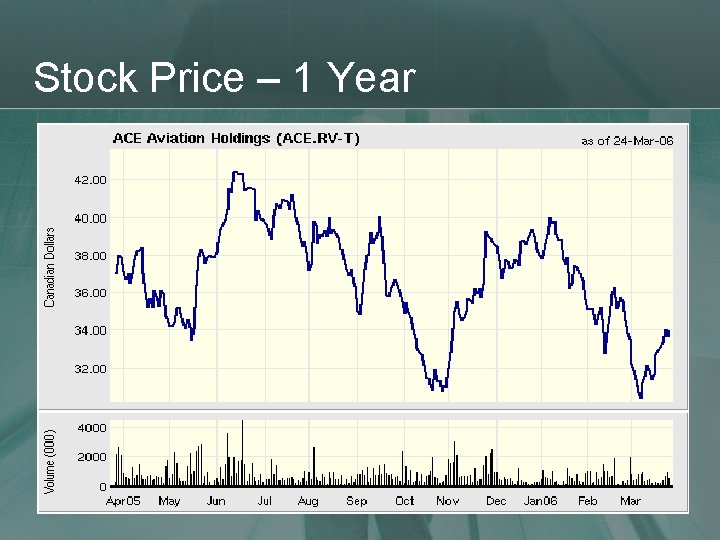
Stock Price – 1 Year
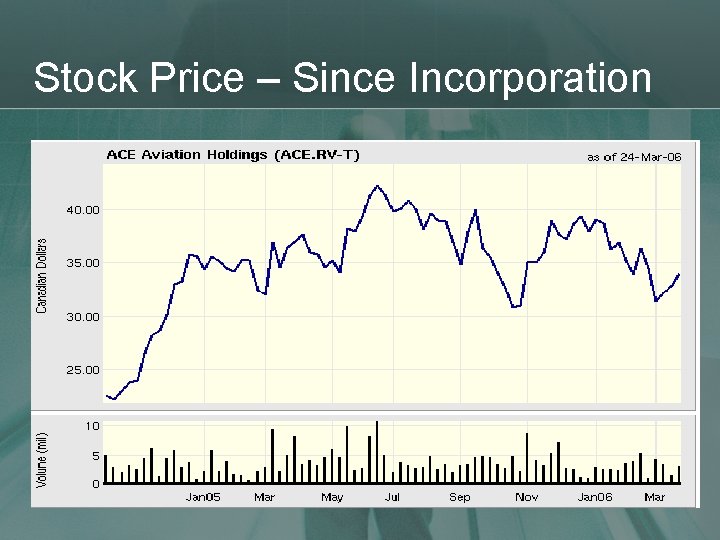
Stock Price – Since Incorporation

Recommendation SELL
- Slides: 124