Internal Migration of Ethnic groups in England Wales


- Slides: 20
Internal Migration of Ethnic groups in England Wales Serena Hussain and John Stillwell
The Data • Specially commissioned table C 0711 a • 7 ethnic groups: White, Indian, Pakistani and Other South Asian, Chinese, Black, Mixed and Other • 7 age groups: 0 -15, 16 -19, 20 -24, 25 -29, 30 -44, 45 -59, 60 and older • Migration flows between 376 LADs • Population at risk data derived from ST 101
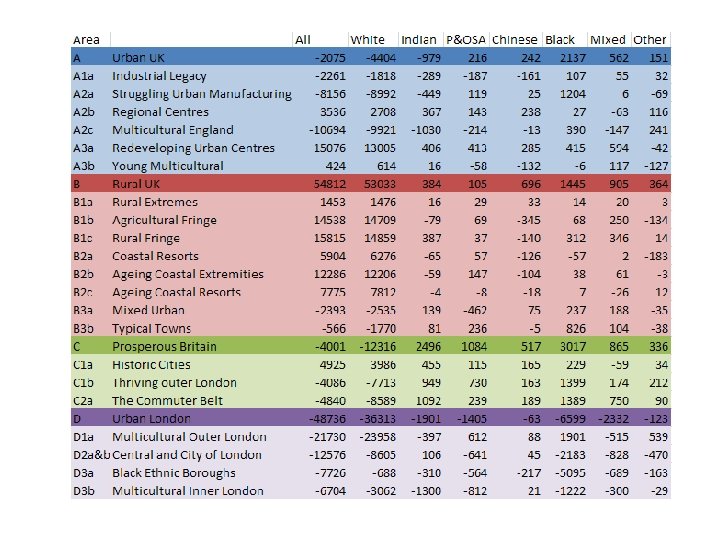
The family and class tiers of the UK district classification in England Wales
Percentage of migrants by ethnic group
Migrants by ethnicity and age
Percentage of migrants at inter and intra district levels by ethnic group
0 -15 20 -24 16 -19 25 -29
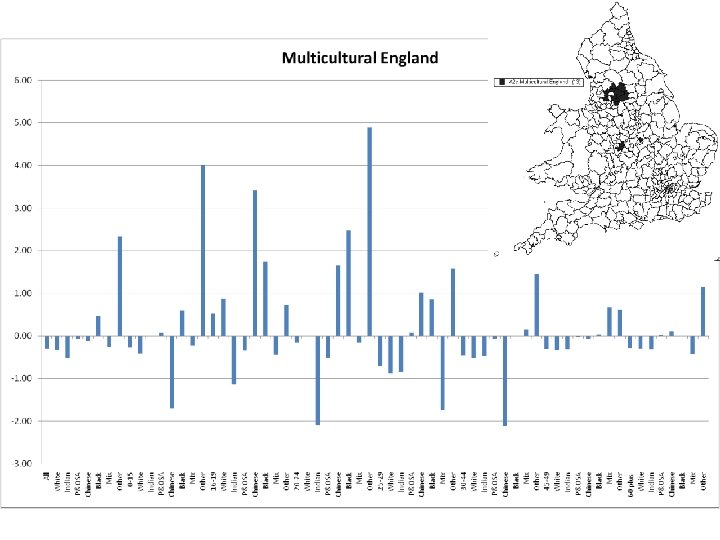
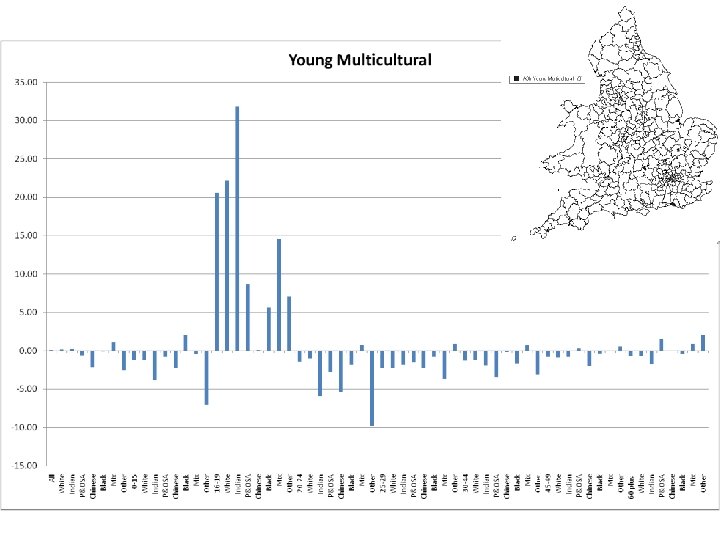
Migration by ethnic group at Vickers’ Family level
0 -15 16 -19 20 -24 25 -29
30 -44 60 + 45 -59
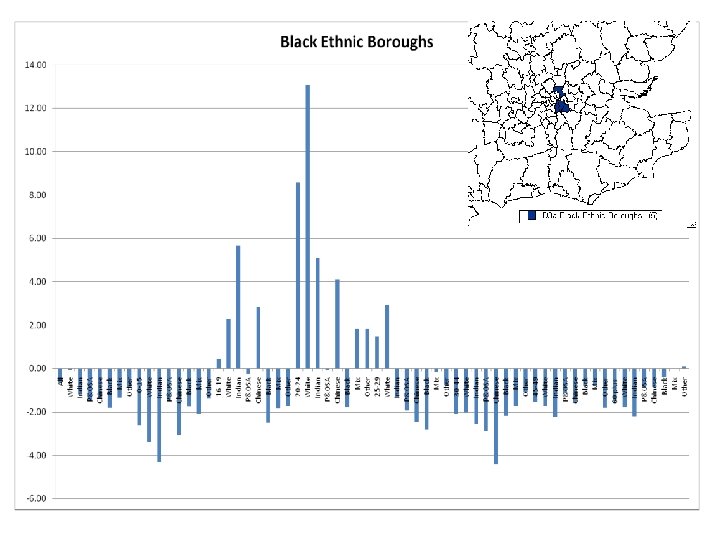
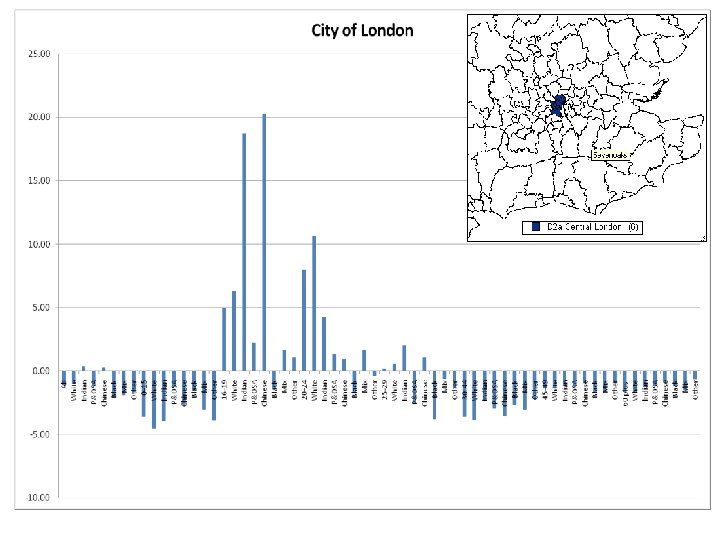
Migration by ethnic group at Vickers’ class level
Districts:
Districts:
Summary at National Level… • South Asian groups have lowest propensities to migrate, all other ethnic minority groups have higher propensities to migrate compared with the White majority • Pakistani and OSA lower propensity to migrate at key age stages. Life course theory may be culturally inappropriate for multicultural Britain • Pakistani and OSA have highest percentages of intra district migration and Chinese for intra
Summary at Vickers et al level • Trends at Family level • It is difficult to talk about general trends as there is diversity for total populations • More Ethnic Minorities leave Ethnic Minorities areas than migrate to them