Interior structure and mineralogy Temperature through the lithosphere


")


, Harvard")


 estimated that earthquakes release (use) about 5 x 10¹⁷ J per")


 takes us here: To Surface temperature")
 Explore this special function on Wolfram|Alpha")


- Slides: 38
Interior structure and mineralogy
Temperature through the lithosphere and crust For a lithosphere with 100 km depth (i. e. , an average gradient of 12 K/km), the average lithospheric thermal conductivity: k ~ 4 W m-2 K-1. Measured conductivities of surface rocks: k ~ 2 -3 W m-2 K-1.
Mantle mineralogy -- overview Bass and Parise (2008)
Seismic evidence of mineral phase transitions: PREM Earth model PREM: source IRIS. org
D'' – postperovskite transition Ø Recently, it has been determined that the perovskite mineral phase of [Mg, Fe]Si. O 3 compresses into a denser postperovskite phase (same stoichiometry? ) at about 120 GPa pressure and 2500 K temperature. Ø This condition is interpreted to be the cause of the seismic, velocity-slowing anomaly of the D'' layer. The missing ingredient: Kie Hirose
Tomography – lateral variations Image by Adam Dziewonski (1936 -2016), Harvard
Boundary layers – lithosphere and CMB-D''
The outer and inner core Temperature and pressure within Earth The outer core is convecting vigourously; its temperature gradient must be very close to adiabatic. Still, we don't have good constraints on thermal properties of the liquid outer core. Temperature at the inner-core/outer-core boundary? Probably about 4500 K. Assuming an essentially iron-nickel inner core and adiabatic equilibrium, the inner core's central temperature is estimated to be about 5500 K. Mao and Hemley, 2007
Seismotectonics Kanimori (1977) estimated that earthquakes release (use) about 5 x 10¹⁷ J per year. The theoretical limit of the annual energy available from the convective heat engine is about 5. 4 x 10²⁰ J per year. The work “done” by earthquakes accounts for only about 0. 1% of the annual energy available to the convection engine. What else? Moving masses laterally across the geoid requires no work apart from the resistance or friction of the motions. Lifting masses above the geoid requires work. On long time scales, we believe that the topography of the Earth is approximately stable: uplift and erosion are in balance. The energy required to uplift the topography must somehow be provided by the convection engine.
Seismotectonics Ø The heat engine that is expressed in mantle convection works on the body and surface of the Earth. Ø It is not an especially thermodynamically “efficient”: its theoretically limiting efficiency is determined by the temperature differences at the bottom and top of the circulating mantle. Ø We might expect, then, that the convection engine could accomplish “work” at the rate of about 17 TW. This is a tremendous power to move and uplift continents, spread ocean basins, lift mountain-building magmas above the surface and fracture surface rocks in earthquakes.
Powering mantle convection The mantle engine's power derives from several possible sources: Ø A chondritic Earth should contain enough U, Th and K to account for much of the heat flow from the surface. Fe 32. 0 % O 29. 7 Si 16. 1 Mg 15. 4 Ca, Al, Na 3. 5 K 160 ppm (0. 0187 40 K) Th 0. 055 U 0. 015 Mc. Donough, 2003
Powering mantle convection - II The mantle engine's power derives from several possible sources: Ø A chondritic Earth should contain enough U, Th and K to account for much of the heat flow from the surface. 40 232 K > 40 Ar* 0. 0187 ppm 40 K Th > 208 Pb 0. 055 ppm 235 U, 238 U > 207 Pb, 206 Pb 0. 015 ppm Ø Total present-day instantaneous combined radiogenic heat source estimate for the BSE (bulk silicate Earth): 12. 7 – 31 TW. Anderson, 2009 * It has been argued that the atmospheric mass of argon (1. 29% of the atmospheric mass) entirely derives from the decay of 40 K during the history of the Earth. Presently, 40 K comprises 0. 0117% (atom count) of natural K.
Core convection and the geodynamo Compensation for the continuing dissipation of the geomagnetic field requires a continuous power input of ~0. 54 TW (various estimates) to maintain the field. The convective engine of the core provides this power input. The temperature gradient under which this engine operates is (we have) estimated range from about 5100 K 4300 K. If we believe our to temperature profile, wetomight 2 heat accept The theoretically limiting efficiency of this engine is this Andersons's 9 m. W/m flow from– itthe engine that drives the geodynamo – is then: Caveat core into the mantle. . . But! Note that our argument is really a circular one. We have obtained our temperature on the ~77% of the power available in the convective engine is basis of Anderson's heat flow estimate: to~9 TW exhausted into the mantle. This corresponds a heat flow out of the core into the mantle of at least 1. 8 TW and possibly more than 14 TW if all the available power of the convection drive feeds the geodynamo. There are myriad other losses.
Powering core convection We tread on very soft ground of assumptions here. Ø Latent heat of fusion of inner core: depends upon the rate and history of freezing of the core. We may argue that the core started freezing 3. 5 Ga or as recently as 1 Ga. Ø Radioactive elements in the core and, preferentially, incorporated into the inner core. 40 K is the best candidate. Ø Chemical differentiation releasing light elements into the outer core as Fe-Ni crystallize to form the inner core. Ø A small metallic fissile U-Th core at the centre of the inner core. . . probably fanciful but possibly testable. Ø Fossil primordial heat assembled during accretion. Properly, simply the continuing cooling of the overlying mantle. . . sometimes seen as “entropy increase”. 0. 1 - 1 TW 0 - 1 TW Probably enough
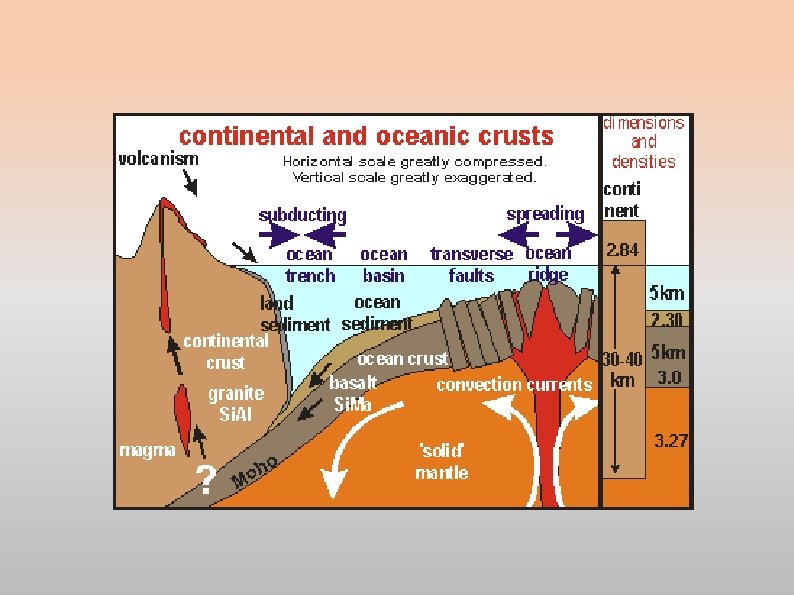
Formation of the oceanic crust and lithosphere The ocean basin deepens with distance from the spreading ridge as a consequence of isostatic adjustment
Ocean bathymetry GEBCO The ocean ridges are the shallowest regions of the basins; they are also the youngest!
Mathematical-physical theory v
Mathematical-physical theory - II v
Mathematical-physical theory - III
Mathematical-physical theory - IV Much manipulation (Sandwell; 2001) takes us here: To Surface temperature 0 C Tm Mantle temperature 1300 C D Thermal diffusivity 8 x 10 -7 m 2/s k Thermal conductivity 3. 3 W/m/K
The error function: erf(x) Explore this special function on Wolfram|Alpha
What happens at a subduction trench? We have seen how the oceanic crust and upper-mantle lithosphere form and deepen as the plate spreads from a ridge. The Earth remains finite in area so that lithospheric plate has to be consumed back into the volume of the Earth somewhere. . . Where? Along “subduction zones”. How does subduction work?
Forces acting of lithospheric plates
Exploring images and maps: tectonics http: //pubs. usgs. gov/gip/dynamic/understanding. html http: //www. earthquakescanada. nrcan. gc. ca/historic-historique/events/17000126 -en. php http: //denali. gsfc. nasa. gov/dtam/data/ftp/gtam. gif http: //denali. gsfc. nasa. gov/dtam/seismic/ http: //denali. gsfc. nasa. gov/dtam/data/ftp/dtam. gif http: //www. gps. caltech. edu/~dla/images/n_polar. jpg http: //www. gps. caltech. edu/~dla/images/s_polar. jpg http: //www. gps. caltech. edu/~dla/images/oblique. jpg
Plate tectonics!
Global Tectonic Activity Map PDF format
Global topography shows Plate Tectonics
Why continents? . . . from Scholl
Formation of continents . . . from Mc. Culloch and Bennett
206 Pb/238 U Accretion of the continents 207 Pb/235 U From Assynt's Geology Iizuka, et al. , 2010
Lutetium- Hafnium geochronology THE Lu-Hf ISOTOPE SYSTEM The Lu-Hf isotope system consists of the spontaneous decay of unstable radionuclide 176 Lu, by β-emission, to the stable 176 Hf with a half-life of 37. 2 Ga. The element Lu is the heaviest Rare Earth Element, belonging to the Lantanides group. It has two natural isotopes: the stable isotope 175 Lu and the radioactive isotopes 176 Lu, representing 97. 41% and the 2. 59% of the natural Lu isotope abundance respectively. Hf isotope signatures, found in a zircon population characterize different magmatic or high-T metamorphic events succeeding in time during the crustal evolution of the source regions (Zeh et al. , 2007).
Uranium – lead geochronology
Jack Hills Zircons Peck, et al. , UWisconsin
Global crustal thickness Wiki. Media Commons
The plate-tectonic paradigm by Vigil, USGS
The plates are seen to move L. Morley and A. Larochelle see magnetic evidence of sea floor spreading. Their discovery actually precedes that claimed by Vine and Matthews. The Cascadia Subduction Zone (CSZ).
The plates! Wiki. Media Commons