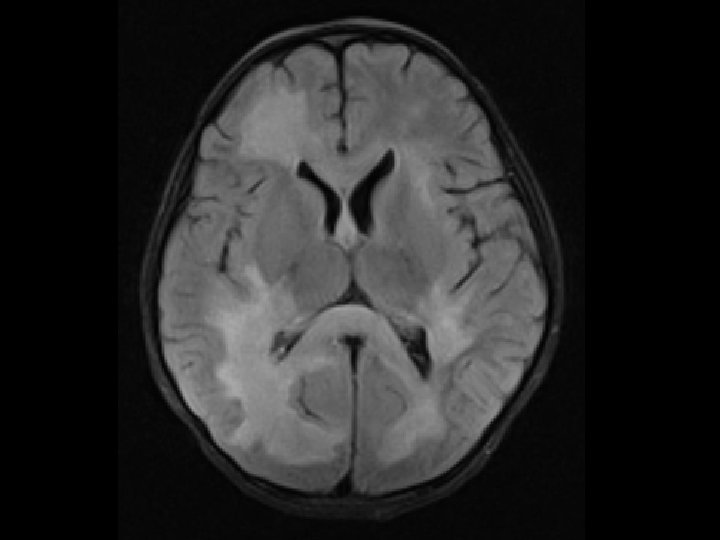
Interhospital Conference Ramathibodi hospital 20 March 2012 Physical

Interhospital Conference Ramathibodi hospital 20 March 2012


Physical Examination V/S: T 37. 8°C, PR 120 bpm, RR 40 bpm, BP 96/44 mm. Hg, BW 14 kg (P 50 -75 th), Ht 95 cm (P 50 -75 th), HC 49 cm (P 50 th) GA: a Thai girl, drowsiness, mild pallor, no jaundice, no dysmorphic feature, capillary refill 3 sec HEENT: bilateral cervical LN 0. 5 cm, no neck mass, pharynx and tonsil not injected

Physical Examination CVS: normal S 1 S 2, no murmur Lung: clear, no adventitious sound, no retraction Abdomen: soft, no distension, liver 3 cm below RCM, liver span 9 cm, spleen 4 cm below LCM Skin : no lesion

Physical Examination Nervous system : drowsiness, pupils 3 mm RTLBE, no stiffness of neck, full EOM by observe, no nystagmus, no facial palsy, corneal reflex positive, gag reflex negative, tongue and uvula in midline, spastic all extremities, motor power: Rt side gr I, Lt side gr II, DTR 3+, BKK: present both sides

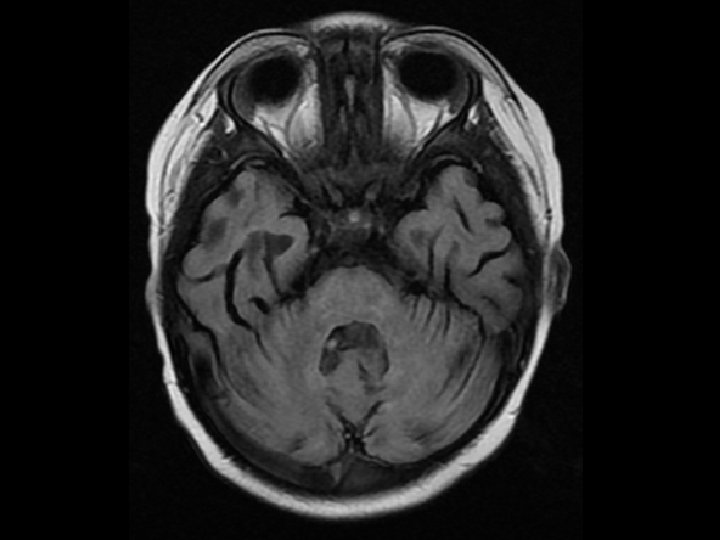
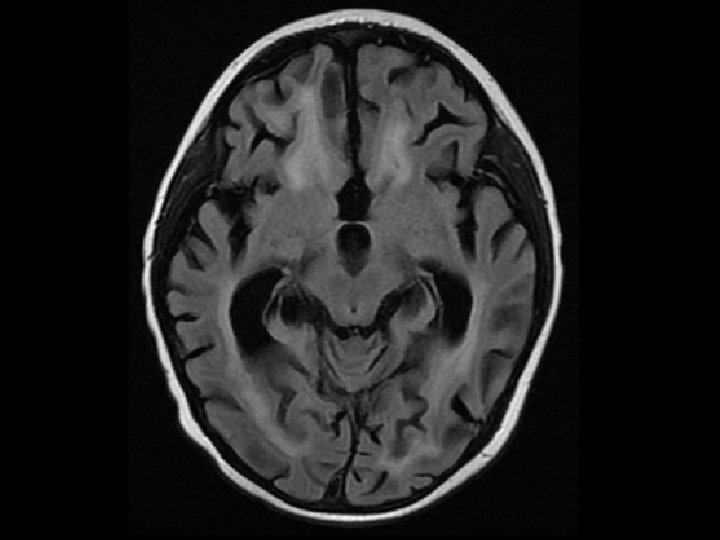
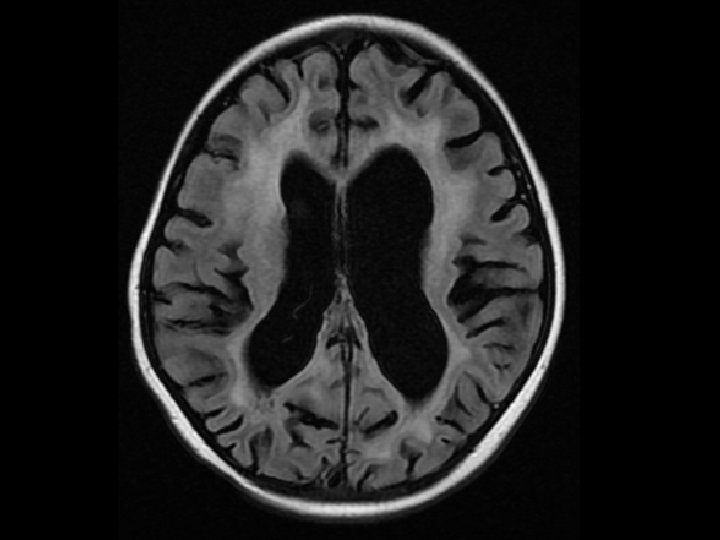
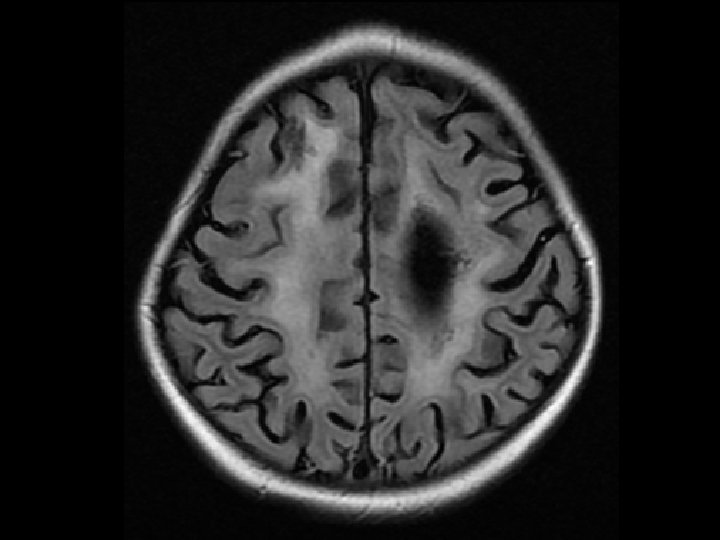
Investigation 1 2 6 10 3 7 11 8 12 5 4 9 13 14

CBC • • Hb 9. 5 g/d. L Hct 28. 2% WBC 2, 930/cumm. PMN 40% Lymph 51% Mono 5% Atyp L 4% Plt 34, 000/cumm. • • RDW 16. 9% MCV 70. 5 f. L MCH 23. 7 pg MCHC 33. 7 g/d. L Anisocytosis 1+ Microcyte 1+ Hypochromia 1+

Coagulogram • • • a. PTT 27 sec PT 13 sec INR 1. 13 TT 11 sec Fibrinogen 248 mg/d. L

Blood chemistry • • • Na 129 mmol/L • BUN 10 mg/d. L K 3. 2 mmol/L • Cr 0. 51 mg/d. L Cl 94 mmol/L CO 2 23. 5 mmol/L Inorganic phosphate 3. 5 mg/d. L Calcium 7. 6 mg/d. L (correct 8. 8) • Mg 1. 8 mg/d. L

Liver function test • • • AST 25 U/L ALT 29 U/L GGT 20 U/L TP 62. 6 g/L Albumin 25. 6 g/L • ALP 63 U/L • TB 0. 2 mg/d. L • DB 0. 1 mg/d. L

CXR

Ferritin • Ferritin 2, 248 ng/m. L

Viral studies • EBV Ig. G : Positive • EBV Ig. M : Negative • EBV viral load < 100 copies

Bone marrow aspiration • Bone marrow aspiration – Hypercellularity 1+ – Adequate in number of megakaryocyte, erythroid, myeloid series – No blast – No abnormal cell – No hemophagocytic activity

Bone marrow biopsy – Active trilinear hematopoiesis with increase histiocytes with hemaphagocytosis activity – No immunophenotypic evidence of increased blasts or non. Hodgkin lymphoma – CD 68 -positive histiocytes are increased

Lipid profile • TG 328 mg/d. L • Chol 112 mg/d. L • LDL 38 mg/d. L

LDH • LDH 164 U/L

CSF profile • CSF – WBC 3 cell/cumm – RBC not seen – Monocyte 100% – Glucose 58 mg/d. L – Protein 93. 8 mg/d. L – Blood glucose 104 mg/d. L

Brain biopsy – Dense perivascular lymphohistiocytic infiltration with demyelination – CD 1 a : negative – CD 3, CD 4, CD 8, CD 20 : Positive – CD 68 : Positive in reactive histiocytic cell
 Perivascular cuffs of mononuclear inflammatory cells")
Brain biopsy (1) Perivascular cuffs of mononuclear inflammatory cells
 Microglial activation")
Brain biopsy (2) Microglial activation
 Infiltrate of foamy histiocytes with reaction astrocytes")
Brain biopsy (3) Infiltrate of foamy histiocytes with reaction astrocytes

PRF 1 gene mutation analysis • PCR amplification and sequencing analysis of PRF 1 gene (exon 2 and 3) • Interpretation : – The mutation of PRF 1 exon 2 or 3 was not identified – The PRF 1 c. 822 C>T and c. 900 C>T which synonymous SNPs
 – Polymorphism or Mutation of UNC 13 D")
UNC 13 D (Munc 13 -4) – Polymorphism or Mutation of UNC 13 D IVS 4 -1 or IVS 9 -1 was not identified – c. 756_757 ins. AC cause a shift in the reading frame UNC 13 D c. 756_757 ins. AC
 Hct (%) WBC (cumm) Neutrophil (%) Platelets (cumm) 1 -week")
Posttreatment Hb (g/d. L) Hct (%) WBC (cumm) Neutrophil (%) Platelets (cumm) 1 -week 1 -month 3 -month 9. 4 10. 9 12. 5 29 30. 9 37. 9 2410 9020 9190 21 13 51 118000 500000 257000

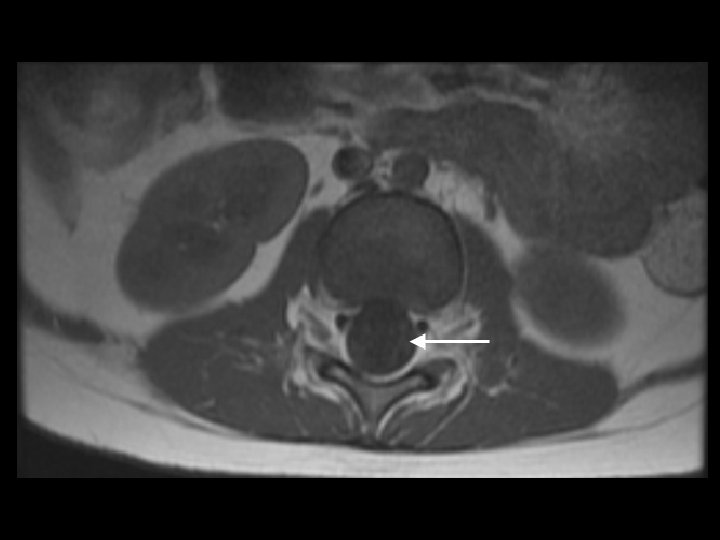
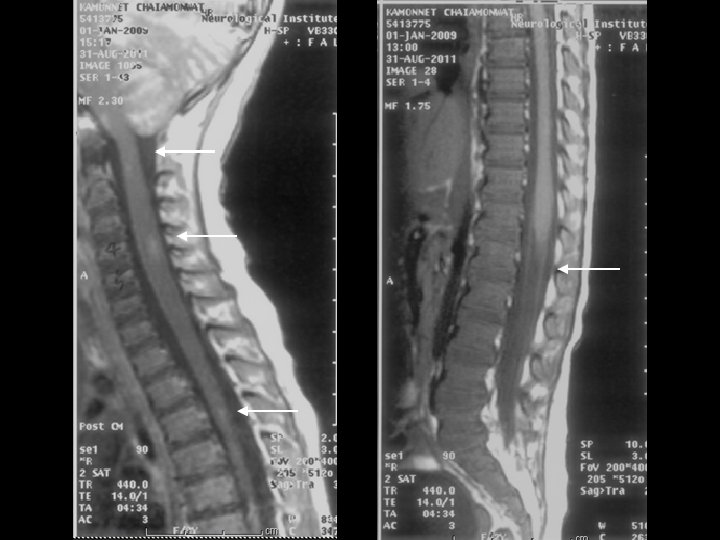
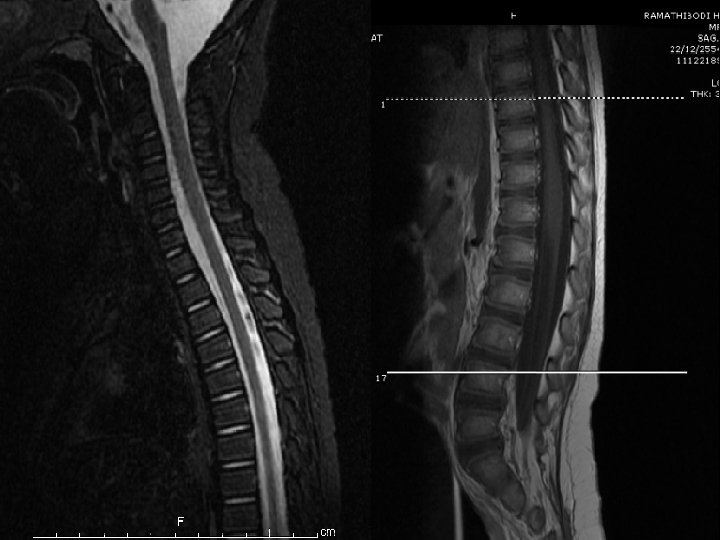
MRI post treatment 3 -month • MRI brain – Marked decrease white matter lesions which severe white matter volume loss with bilateral ventricles dilatation – Increase choline with decrease NAA at residual periventricular lesions without relative hyperperfusion • MRI whole spine – Remaining intramedullary lesions entire spinal cord but not enhancement – Clumping with faint enhancing cauda equina nerve root
 retrospective 1981 to 1993 • 34 patients (19 girls,")
Method • Single center (France) retrospective 1981 to 1993 • 34 patients (19 girls, 15 boys) with HLH – 25 patients with family history (consanguinity or siblings affected same syndrome – 9 patients without family history, no concomitant infectioninduced, recurrence of hemophagocytic syndrome • Evaluate : clinical, CSF, neuroradiolological studies E. Haddad, et al. blood. 1997 Feb; 89: 794 -800.

Results E. Haddad, et al. blood. 1997 Feb; 89: 794 -800.

• Meningitis – 20 -80 lymphocytes/µL with protein 50 -100 mg/d. L • 20 with meningitis (mean age 6. 9 months) • 9 with neurological symptoms (mean age 16 months) E. Haddad, et al. blood. 1997 Feb; 89: 794 -800.

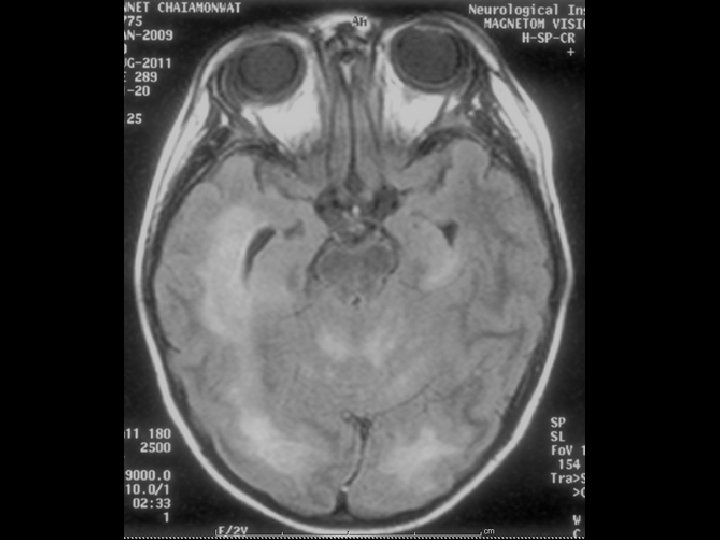
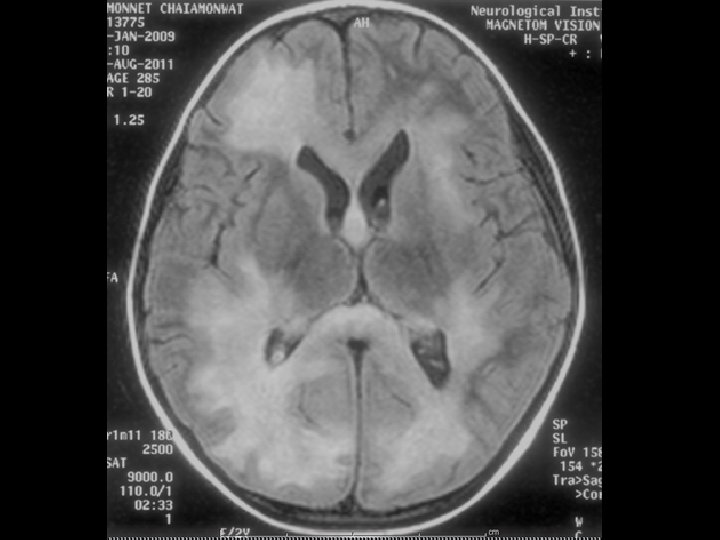
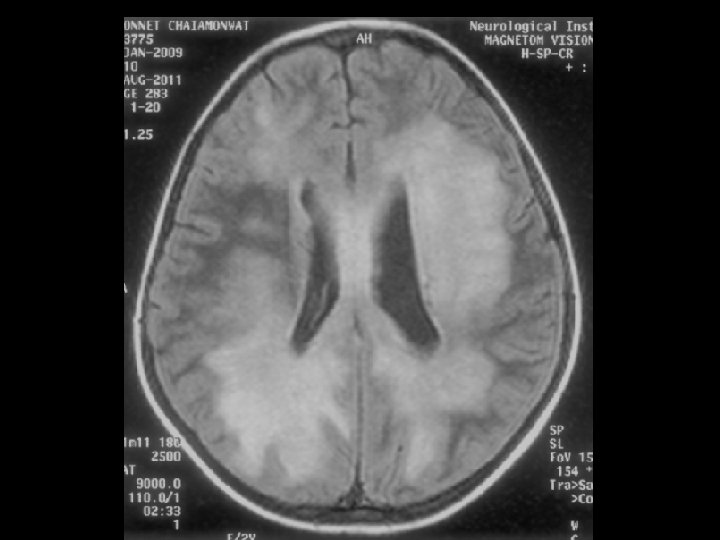
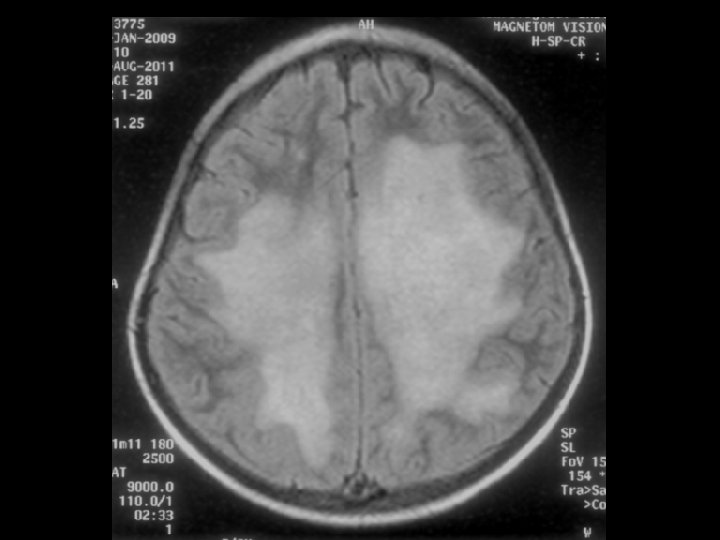
• Brain imaging – 9/20 with meningitis • 4 had abnormal : 2 with pericerebral diffuse subdural dilataion, 2 with white matter lesions – 8/9 with neurological symptoms • Most frequent focal necrosis with parenchyma volume loss and white matter lesions E. Haddad, et al. blood. 1997 Feb; 89: 794 -800.

• 19 patients had severe CNS progression • 4 patients repeat imaging – 3 with severe brain atrophy – 1 with enhance cerebellar white matter and parenchyma loss E. Haddad, et al. blood. 1997 Feb; 89: 794 -800.

E. Haddad, et al. blood. 1997 Feb; 89: 794 -800.

• 7 alive with normal neurological examination, CSF, cognitive development • 3 cases perform MRI before and after BMT – 2 had normal MRI (pre/post BMT) – 1 had white matter lesion before BMT and remain 2 years after BMT E. Haddad, et al. blood. 1997 Feb; 89: 794 -800.
 Originated from 25 countries")
• • Large cohort of children (n = 193) Originated from 25 countries Median age at diagnosis 9 months 106 (55%) less than 1 year of age at diagnosis 43/192 (22%) (no data = 1) familial disease Consanguinity 37/186 (20%) cases (no data = 7) 11 patients studied specified viral infections at diagnosis A. Horne, et al. BJH. 2007 Dec; 140: 327– 335.

A. Horne, et al. BJH. 2007 Dec; 140: 327– 335.

Neurological symptoms and relation to abnormal CSF A. Horne, et al. BJH. 2007 Dec; 140: 327– 335.
 abnormal CSF – Elevated CSF protein 76/188 (40%) –")
CSF • 101 patients (52%) abnormal CSF – Elevated CSF protein 76/188 (40%) – Elevated cell counts in 79/189 42%)) • Abnormal CSF at onset had sequelae compared to 5/61 (8%) patients with normal CSF (P = 0. 024) A. Horne, et al. BJH. 2007 Dec; 140: 327– 335.

A. Horne, et al. BJH. 2007 Dec; 140: 327– 335.
 • 35/115 patients (30%) reported abnormal – Generalized")
Neuroradiology • Performed 115/193 patients (60%) • 35/115 patients (30%) reported abnormal – Generalized cerebral atrophy (n = 16) – White matter lesions and demyelination (n = 5) – Non-specific inflammatory changes (n = 4), – Intracerebral bleeding (n = 2) and brain edema (n = 1) – Cerebellar involvement (n=5) A. Horne, et al. BJH. 2007 Dec; 140: 327– 335.
 transplanted")
Mortality and CNS involvement • 3 -year probability of was 56% – 67(61%) transplanted – 37 (34%) ‘off-therapy’ • 49 patients died before SCT – 18 of these (37%) CNS involvement – No neurological symptom but abnormal CSF (CNS group 3) A. Horne, et al. BJH. 2007 Dec; 140: 327– 335.

A. Horne, et al. BJH. 2007 Dec; 140: 327– 335.
 were")
Neurological symptoms at follow-up Transplanted patients • 102 patients undergone SCT, 67 (66%) were alive • Most common sequelae – Neurodevelopmental retardation (n = 7) – Epilepsy (n = 4) – ADHD (n = 2) – Hearing loss (n = 2) – minimal cerebral palsy and hemiplegia (n = 1 each) A. Horne, et al. BJH. 2007 Dec; 140: 327– 335.

• 92 patients with HLH January 2004 to August 2008 • 82 patients (89%) active viral infection – 69/82 patients (75%) EBV infection • 9 patients not find any underlying disease • None of the patients were offspring of consanguineous marriages or history of siblings affected by same syndrome – 82 were only child in the family S. Yang, et al. Pediatr Blood Cancer 2010; 54: 408– 415.

Methods • Prior to start therapy, all patients underwent – CSF cytology and biochemical assays – Brain CT and/or MRI examination • CSF analysis repeated weekly until normalize • CT or MRI examinations – Repeated at 8 -week intervals until treatment stopped – Completed therapy every 6 months for at least 1 year

RESULTS • 43 patients CNS involvement, either clinical, MRI/CT or CSF abnormalities • 36 (84%) patients had EBV-HLH • No underlying disease found in 5 patients S. Yang, et al. Pediatr Blood Cancer 2010; 54: 408– 415.

RESULTS • • 4 : S+R+C 4 : S+R 2 : S+C 6 : R+C 2: S 3: C 22 : R S, symptoms R, neuroradiology C, CSF S. Yang, et al. Pediatr Blood Cancer 2010; 54: 408– 415.

Neuroradiological Examinations • CT 46 patients, 8 showed abnormalities – Calcifications (n= , (2 atrophy (n= , (2 demyelination (n=, (2 edema (n= , (1 and hemorrhage (n=(1 • MRI 64 patients, 34 showed abnormalities – High signal intensity lesions on T 2 -weighted and FLAIR MRI images (n= , (29 atrophy (n= , (9 hemorrhage (n= , (5 cerebromalacia (n= , (4 and calcifications (n=(2 S. Yang, et al. Pediatr Blood Cancer 2010; 54: 408– 415.

Clinical Manifestations • 12 patients neurological symptoms at diagnosis • Eleven of these EBV-HLH • Seizures (n= , (10 hemiplegia (n= , (3 ataxia (n= , (3 coma (n= , (2 cranial nerve palsy (n=(2 • 8 pathological changes in CT/MRI images • 6 abnormal CSF S. Yang, et al. Pediatr Blood Cancer 2010; 54: 408– 415.
 CSF abnormalities at onset – 11 patients")
Cerebrospinal Fluid Tests • 15 patients (16%) CSF abnormalities at onset – 11 patients elevated spinal fluid protein – 10 patients elevated spinal fluid leukocyte counts S. Yang, et al. Pediatr Blood Cancer 2010; 54: 408– 415.

CNS Involvement After Start of Therapy • 12 patients with neurological symptoms had improved • 3 discontinued therapy due to progressive systemic symptoms • One patient, presenting with CNS dysfunction preceding systemic HLH disease, improved initially but repeated relapses and progressive CNS symptoms 6 months later • 15 patients with CSF abnormalities at diagnosis – Normal within 6 weeks of therapy S. Yang, et al. Pediatr Blood Cancer 2010; 54: 408– 415.

CNS Involvement After Start of Therapy • • • Neuroradiological abnormalities showed slow recovery rate, Neurological symptoms resolved quickly 36 patients with neuroradiological abnormalities 2 patients showed any improvement 15 patients lost to follow-up, 5 patients still undergoing treatment at the end of study S. Yang, et al. Pediatr Blood Cancer 2010; 54: 408– 415.

CNS Involvement After Start of Therapy • 16 patients followed post-therapy • 12 showed some improvement of imaging after 3– 12 months • 5 completely normal CT/MRI scans at follow-up • One progressive changes in the CT/MRI images and relapsed • 3 patients CT/MRI findings unchanged S. Yang, et al. Pediatr Blood Cancer 2010; 54: 408– 415.

CNS Involvement After Start of Therapy • 42 patients followed after discontinuation of therapy • 21/42 had at least one manifestation of CNS involvement at diagnosis • 10/42 recovered completely from CNS involvement • 3 patients not improve with radiological findings while CSF analysis and clinical examination normalized S. Yang, et al. Pediatr Blood Cancer 2010; 54: 408– 415.

THANK YOU FOR YOUR ATTENTION
- Slides: 82