
Interference figures n Very important tool to determine
- Slides: 33
Interference figures n Very important tool to determine optical characteristics. They will tell you: Uniaxial vs biaxial n Optic sign n 2 V angle – for biaxial n Used for estimating chemistry of mineral n
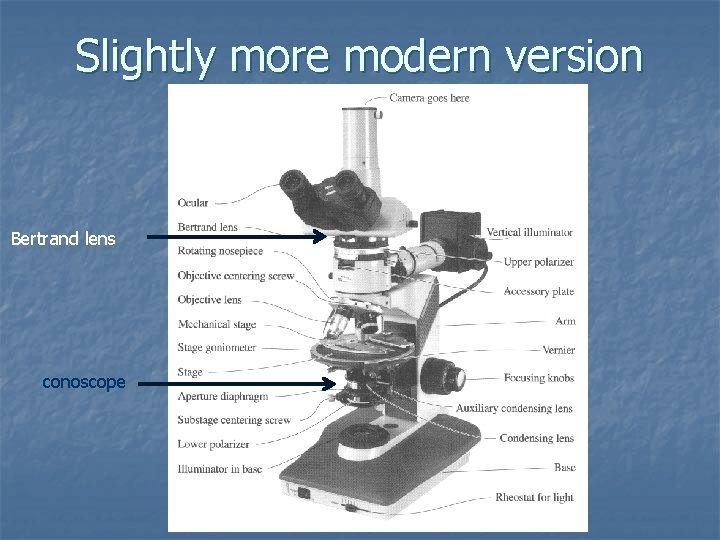
n Technique Focus with highest power objective n Be certain observation is conoscopic light n Flip in conoscope on some microscopes n Most of them have to raise light sources as high as possible n n Insert Betrand lens or remove ocular Interference figure forms on top of objective lens n Betrand lens required to refocus the image n
Slightly more modern version Bertrand lens conoscope
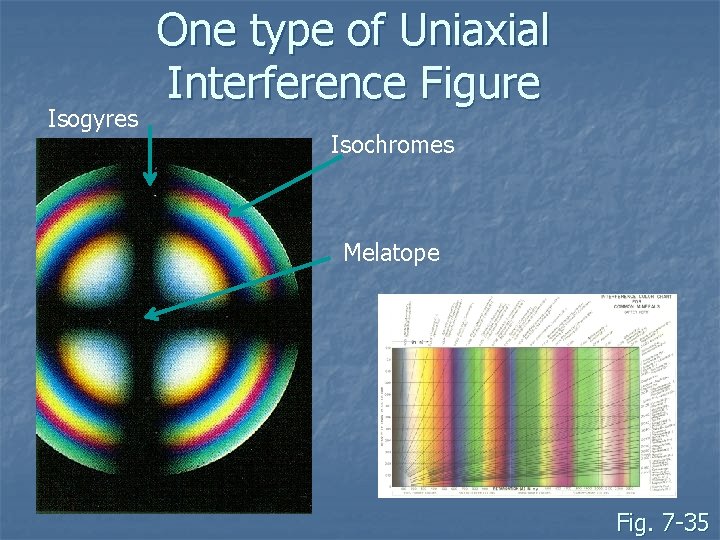
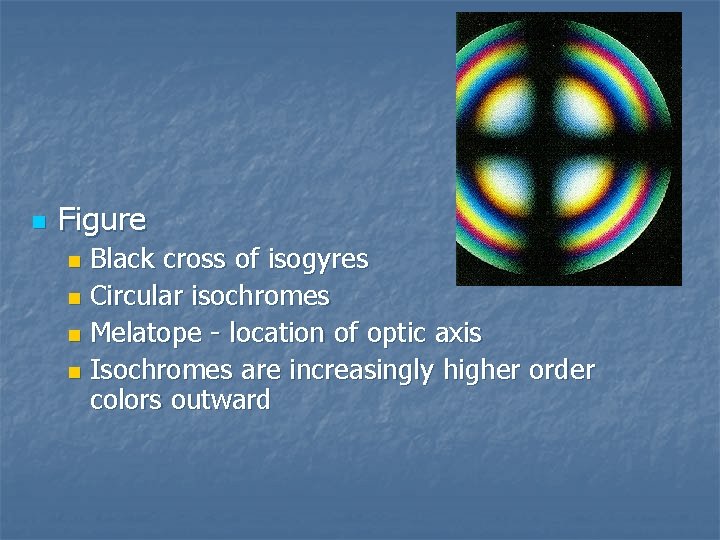
Isogyres One type of Uniaxial Interference Figure Isochromes Melatope Fig. 7 -35
n Figure consist of isogyres and isochromes Isochromes: patterns of interference colors n Isogyres: dark bands (extinction) n n n Nature of interference figure and patterns as stage rotated determines optical property Types of figures controlled by cut of the grain
Uniaxial Interference Figure n Three types: Optic axis figure n Off-center optic axis figure n Flash Figure n n Note – these correspond with the principle cuts of the indicatrix
Optic Axis Figure n Forms when optic axis perpendicular to stage n Grain exhibits low interference color (extinct)
n Figure Black cross of isogyres n Circular isochromes n Melatope - location of optic axis n Isochromes are increasingly higher order colors outward n
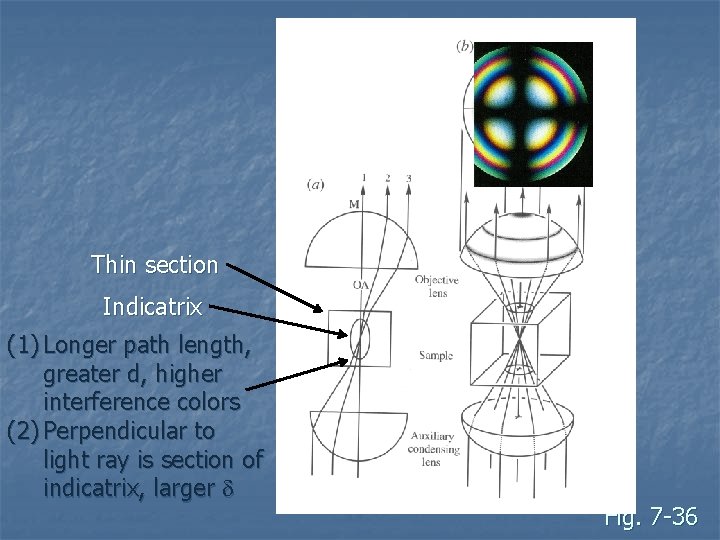
n Isochromes (and isogyres) result from ray paths of conoscopic light: n n Light traveling along optic axis (melatope) has no retardation Light near melatope has low retardation (d and d little higher Light far from melatope have higher retardation (d and d increase more) Thicker and high birefringent minerals have more isochromes n E. g. calcite (large d) vs quartz (small d)
Thin section Indicatrix (1) Longer path length, greater d, higher interference colors (2) Perpendicular to light ray is section of indicatrix, larger d Fig. 7 -36
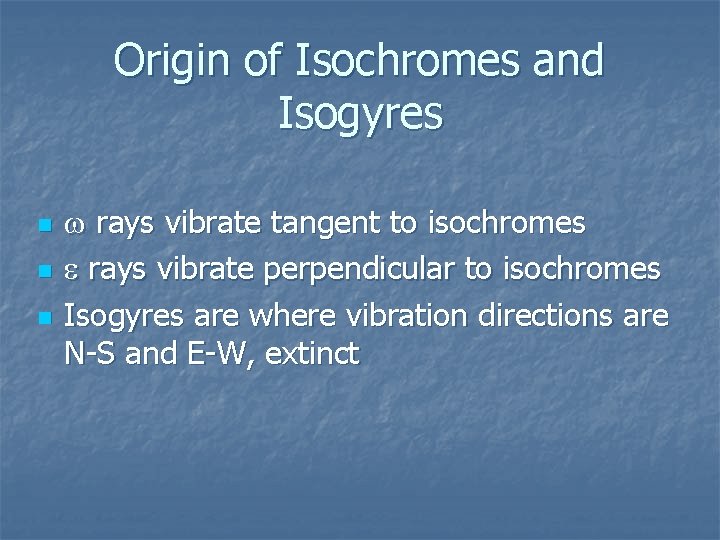
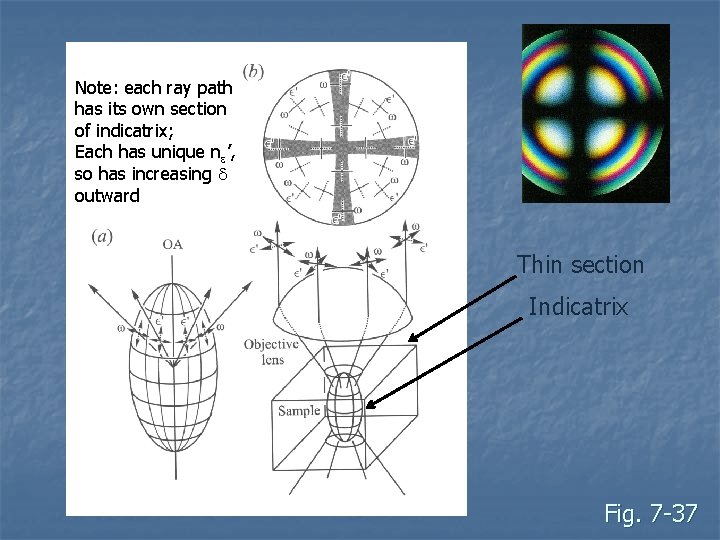
Origin of Isochromes and Isogyres n n n w rays vibrate tangent to isochromes e rays vibrate perpendicular to isochromes Isogyres are where vibration directions are N-S and E-W, extinct
Note: each ray path has its own section of indicatrix; Each has unique ne’, so has increasing d outward Thin section Indicatrix Fig. 7 -37
Off-center OA figure n n n Figure forms when OA is not perpendicular to stage Correct grain will have intermediate interference colors Use of figure similar to centered OA figure
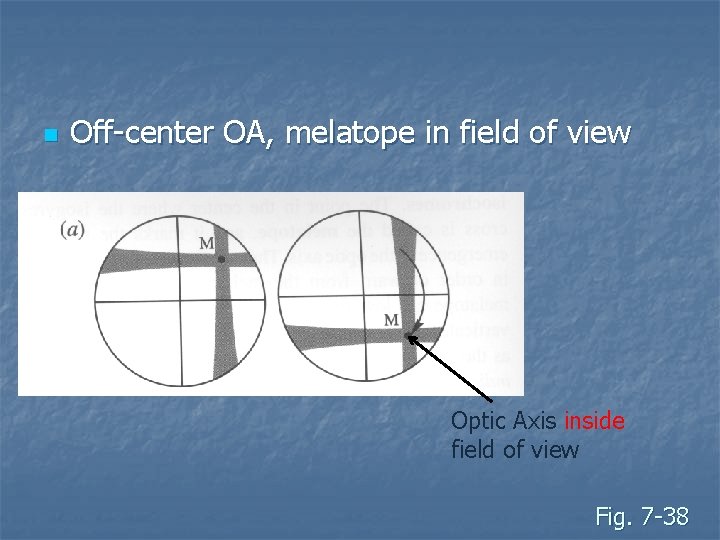
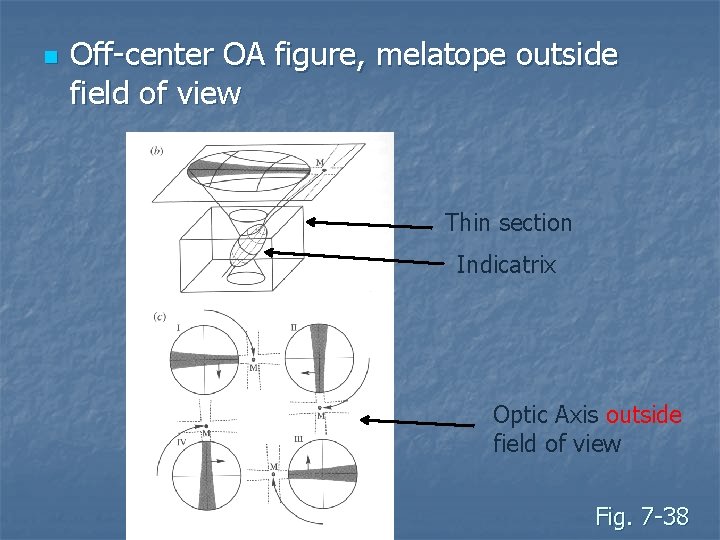
Off-center OA figure n n n If OA < ~30º to stage, melatope in field of view Isogyres swing around center of cross hairs If melatope is out of field of view, difficult but possible to determine optic sign
n Off-center OA, melatope in field of view Optic Axis inside field of view Fig. 7 -38
n Off-center OA figure, melatope outside field of view Thin section Indicatrix Optic Axis outside field of view Fig. 7 -38
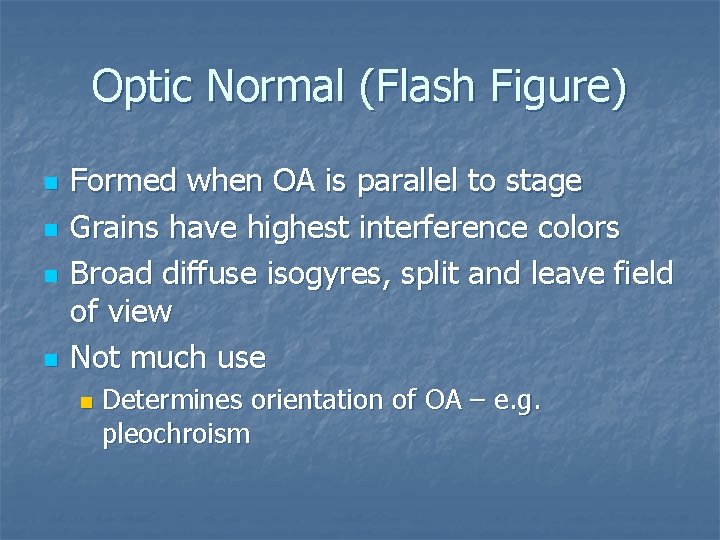
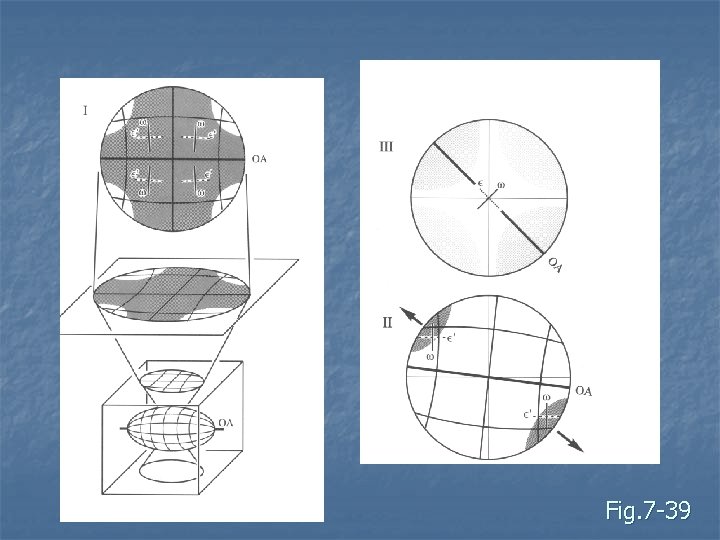
Optic Normal (Flash Figure) n n Formed when OA is parallel to stage Grains have highest interference colors Broad diffuse isogyres, split and leave field of view Not much use n Determines orientation of OA – e. g. pleochroism
Fig. 7 -39
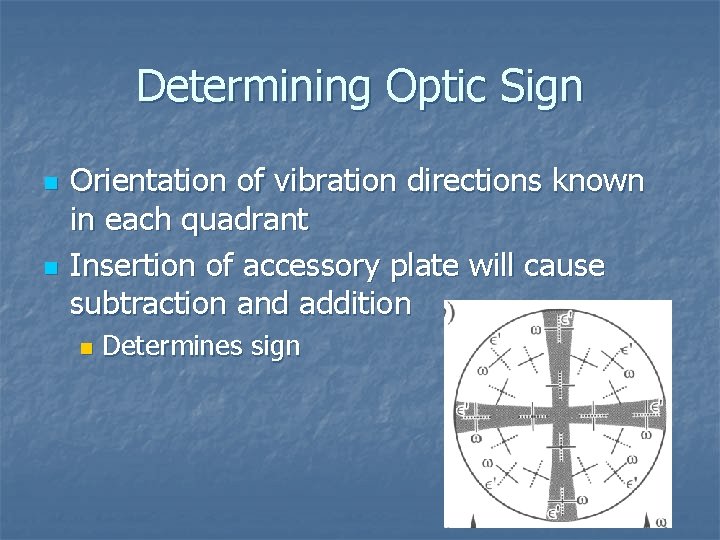
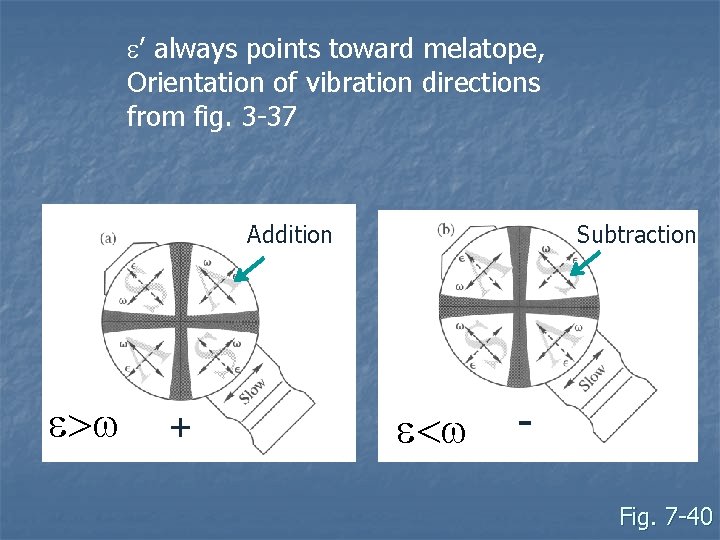
Determining Optic Sign n n Orientation of vibration directions known in each quadrant Insertion of accessory plate will cause subtraction and addition n Determines sign
e’ always points toward melatope, Orientation of vibration directions from fig. 3 -37 Addition e>w + Subtraction e<w Fig. 7 -40
Biaxial Interference Figures n n 5 major figures 2 useful ones: Acute bisectrix (Bxa) figure n Optic axis figure n n 3 worthless ones: Obtuse Bisectrix (Bxo) figure n Optic Normal figure (Flash figure) n Off-center figure n
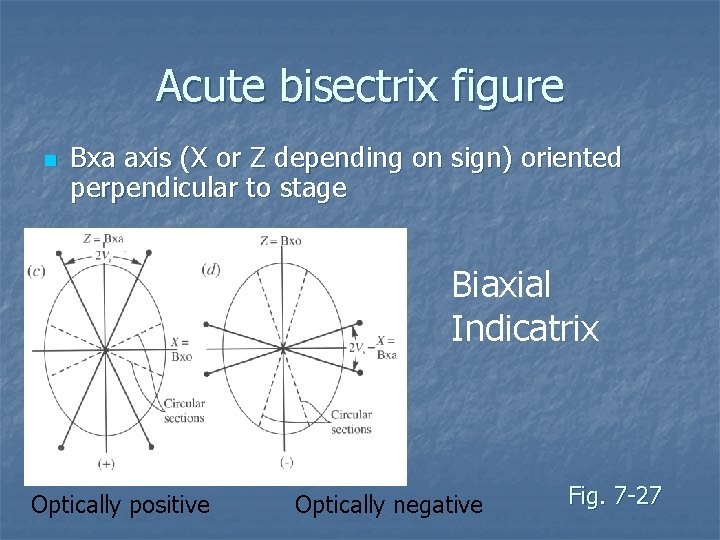
Acute bisectrix figure n Bxa axis (X or Z depending on sign) oriented perpendicular to stage Biaxial Indicatrix Optically positive Optically negative Fig. 7 -27
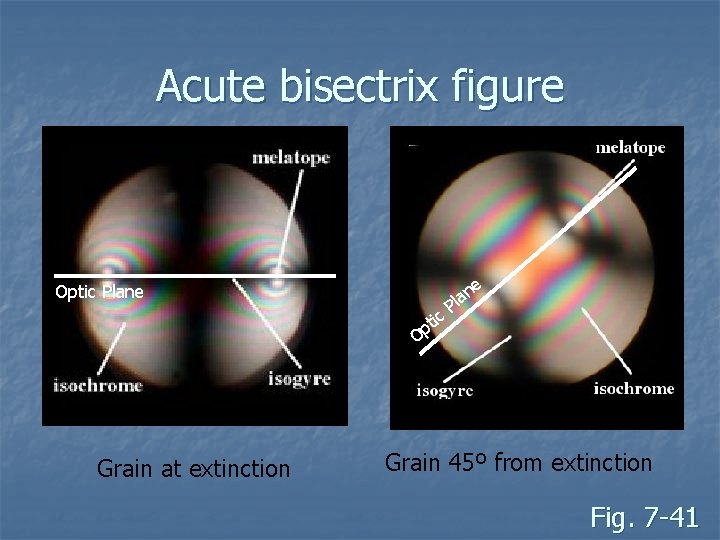
Acute bisectrix figure n n Grains have intermediate to low interference colors (depends on 2 V) Isogyres form cross that splits and leaves field of view as stage is rotated Two melatopes (i. e. two OA) Isochromes are oval or figure 8 around the melatope
Acute bisectrix figure Optic Plane tic p O Grain at extinction e n la P Grain 45º from extinction Fig. 7 -41
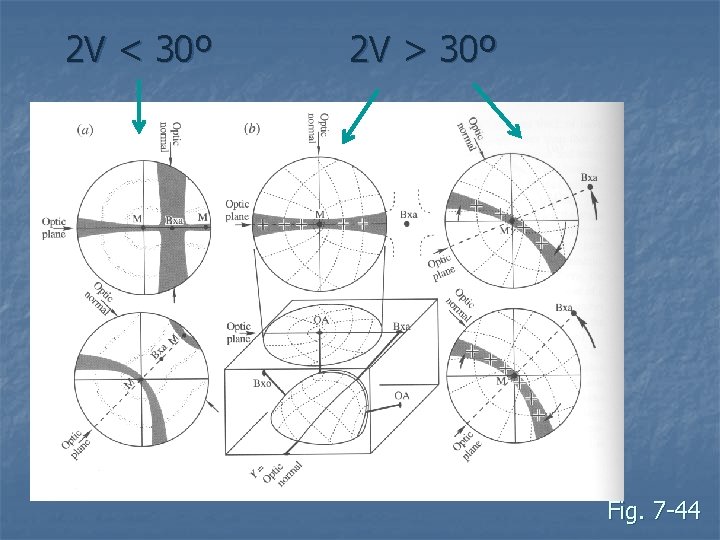
Optic Axis Figure n n Formed when OA is vertical These grains have zero or small retardation If 2 V > 30º, only one melatope (OA) in field of view If 2 V very small, looks like an off-center Bxa figure
2 V < 30º 2 V > 30º Fig. 7 -44
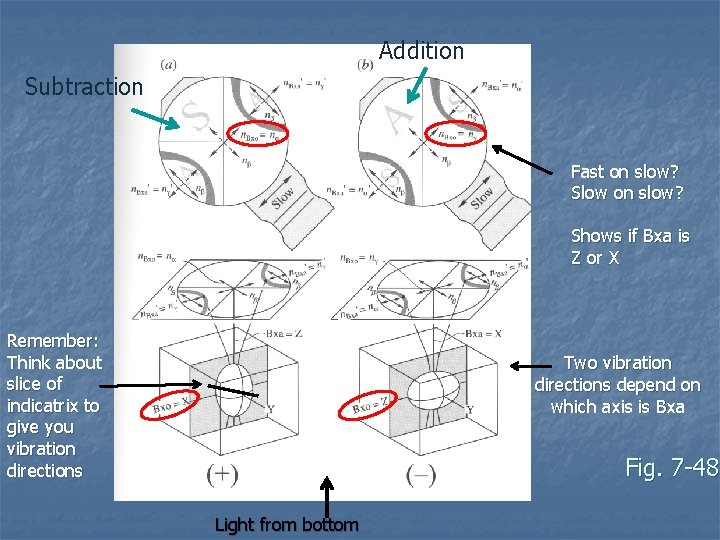
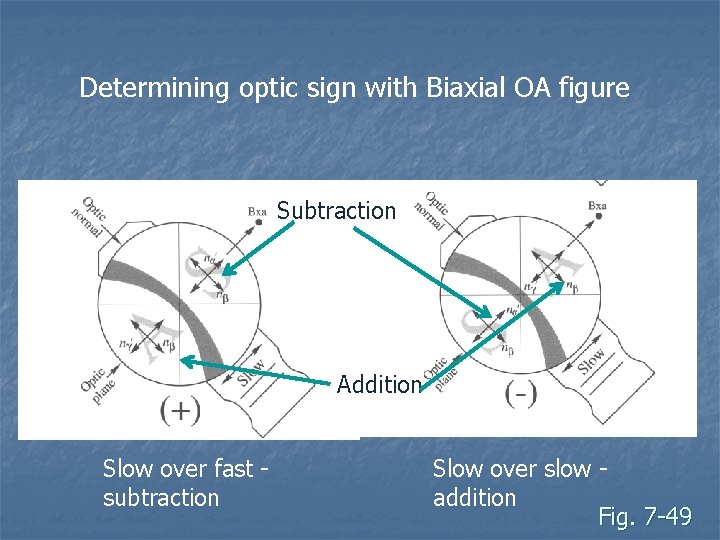
Determining Optic Sign n n Done with Bxa or OA figure Example of Bxa figure: n n n Two light rays vibrate along Bxa axis (either Z or X, the other must be Y) Y vibration is nb, this one is perpendicular to the optic plane Other depends if mineral is + or – If +, then vibration is X = na If -, then vibration is Z = ng Use accessory plate to determine if vibration is fast or slow
Addition Subtraction Fast on slow? Slow on slow? Shows if Bxa is Z or X Remember: Think about slice of indicatrix to give you vibration directions Two vibration directions depend on which axis is Bxa Fig. 7 -48 Light from bottom
Determining optic sign with Biaxial OA figure Subtraction Addition Slow over fast subtraction Slow over slow addition Fig. 7 -49
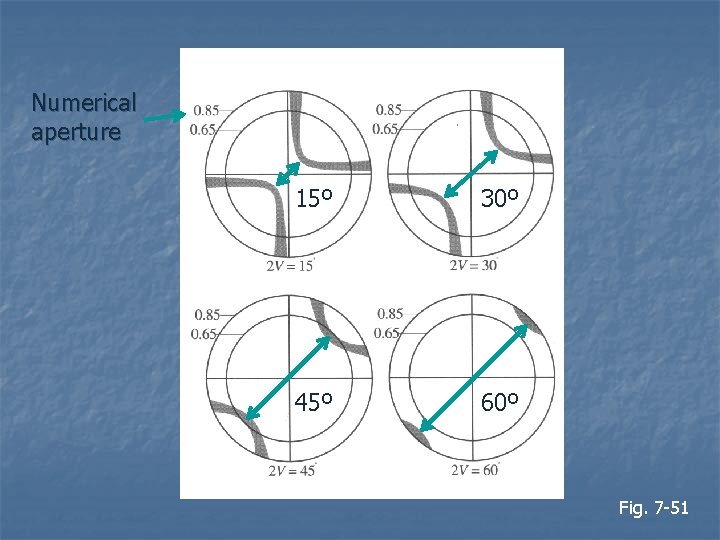
Determining 2 V – several techniques n Bxa figure: Spacing between melatopes relates to 2 V n Depends on numerical aperture (NA) of objectives n Can guess within about 10º n
Numerical aperture 15º 30º 45º 60º Fig. 7 -51
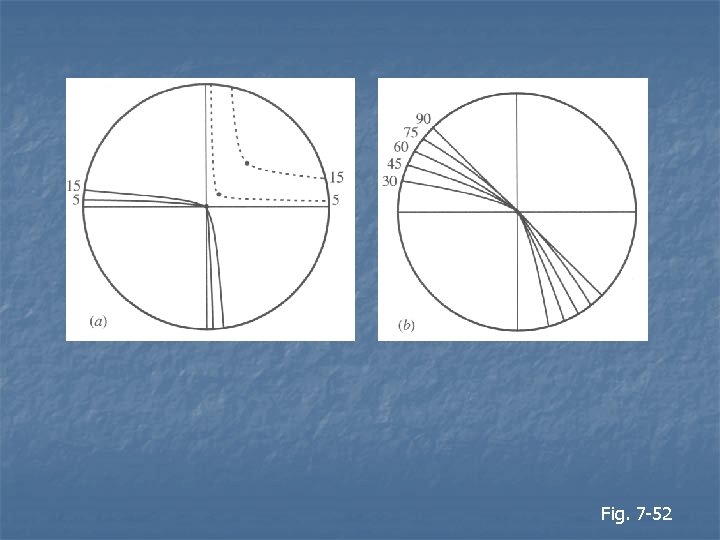
Optic axis figure n n n Curvature of the isogyre depends on 2 V If 2 V = 90º, the isogyre is a straight line If 2 V = 0º, the isogyre forms a cross – it is uniaxial
Fig. 7 -52