
Interfacial friction between soils and solid surfaces Dr
Interfacial friction between soils and solid surfaces Dr. R. G. Robinson Assistant Professor Department of Civil Engineering IIT Madras
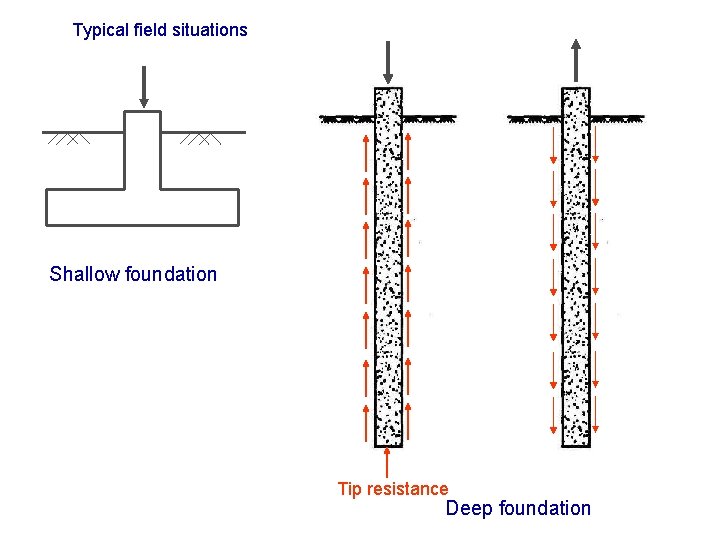
Typical field situations Shallow foundation Tip resistance Deep foundation
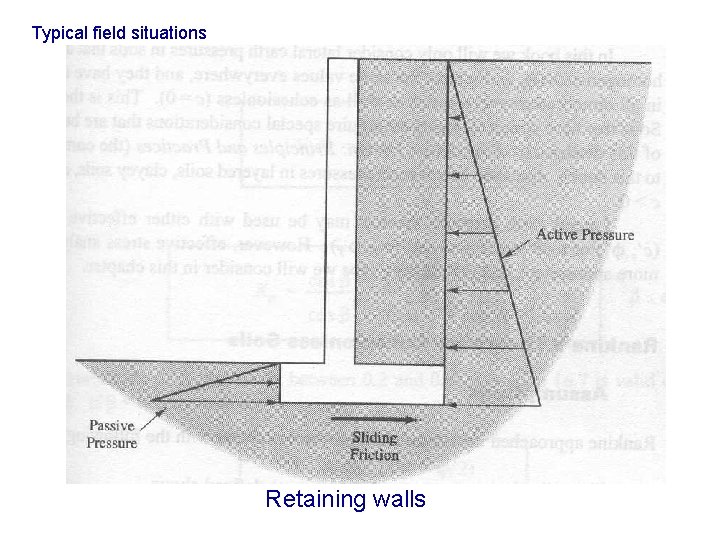
Typical field situations Retaining walls
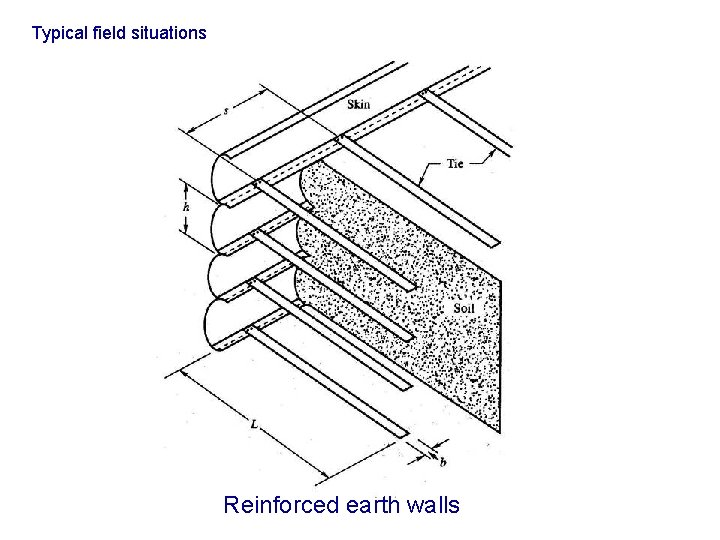
Typical field situations Reinforced earth walls
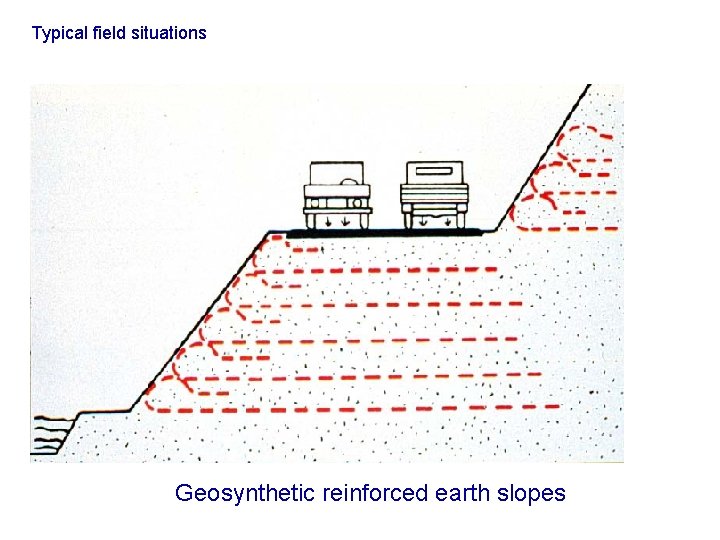
Typical field situations Geosynthetic reinforced earth slopes
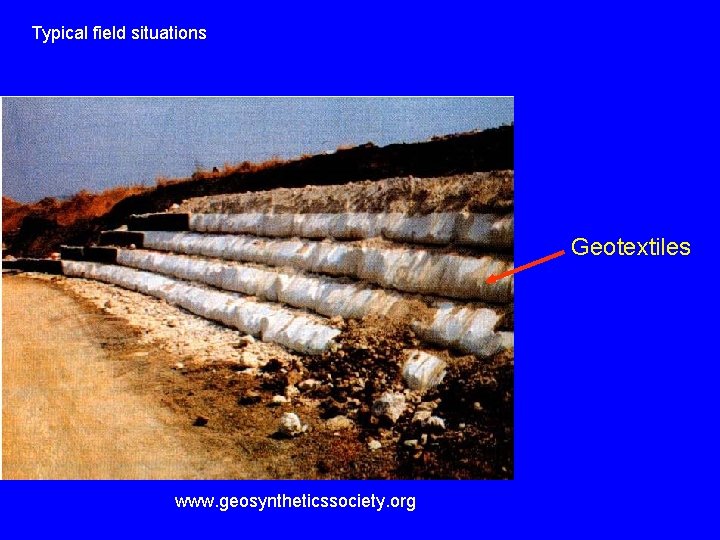
Typical field situations Geotextiles www. geosyntheticssociety. org
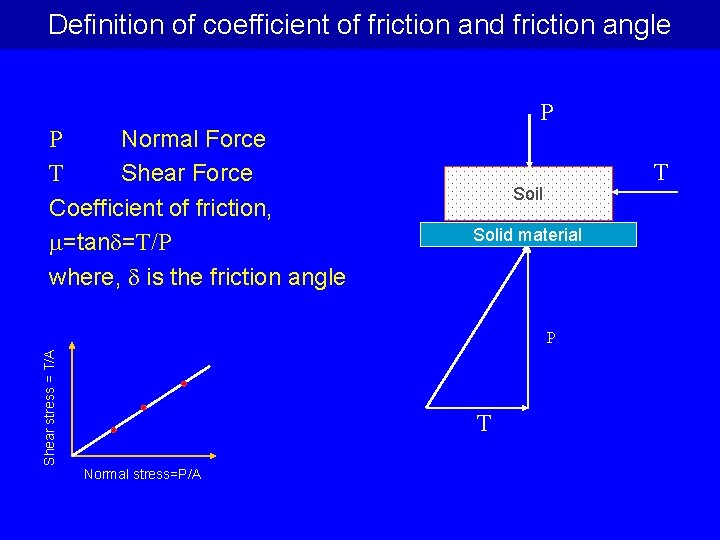
Definition of coefficient of friction and friction angle P Normal Force T Shear Force Coefficient of friction, =tan =T/P where, is the friction angle P T Soil Solid material Shear stress = T/A P T Normal stress=P/A
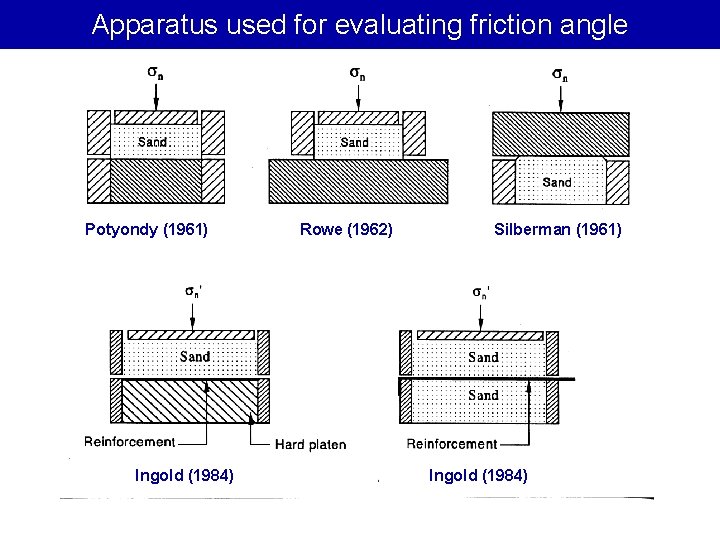
Apparatus used for evaluating friction angle Potyondy (1961) Ingold (1984) Rowe (1962) Silberman (1961) Ingold (1984)
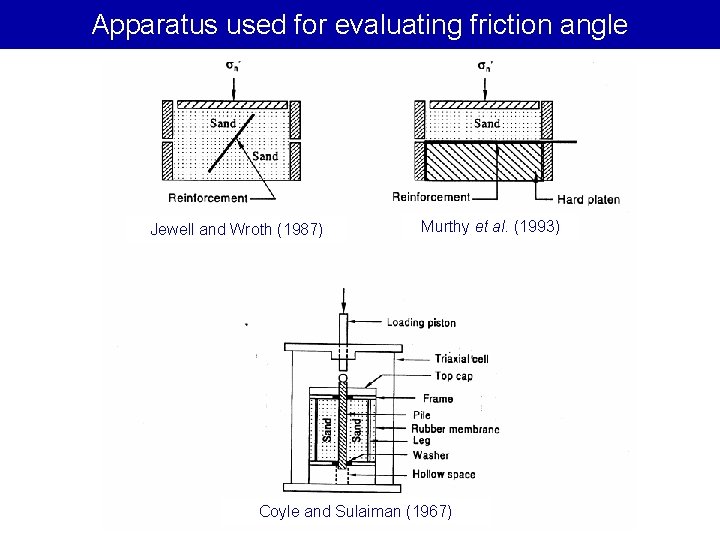
Apparatus used for evaluating friction angle Jewell and Wroth (1987) Murthy et al. (1993) Coyle and Sulaiman (1967)
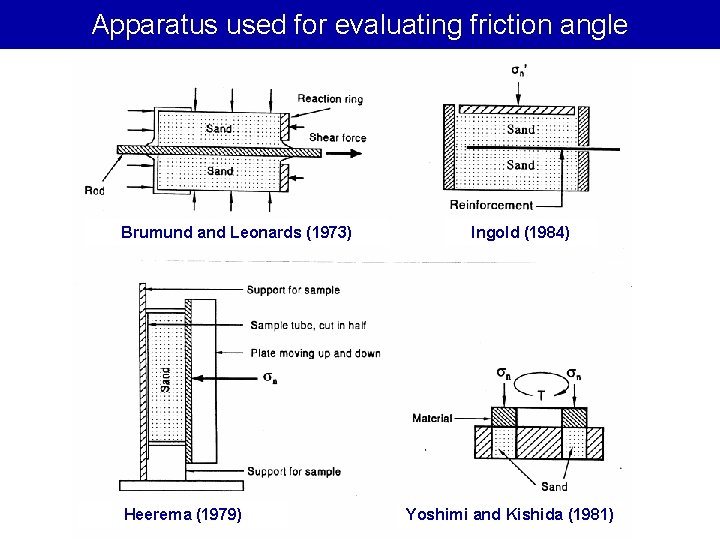
Apparatus used for evaluating friction angle Brumund and Leonards (1973) Heerema (1979) Ingold (1984) Yoshimi and Kishida (1981)
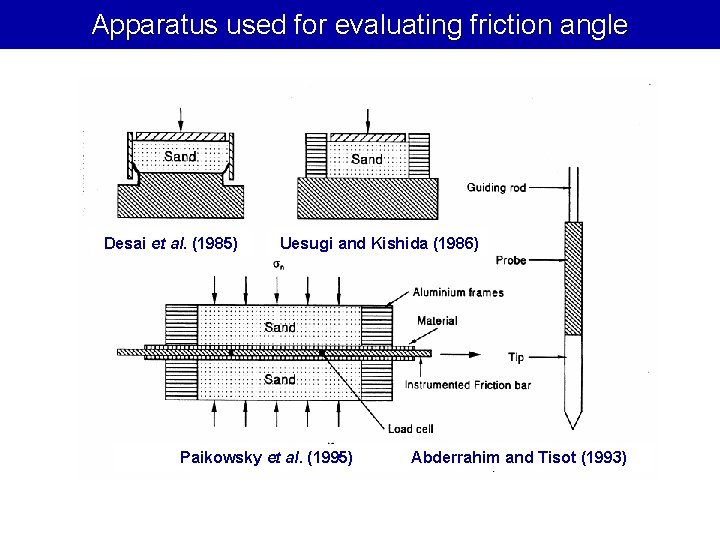
Apparatus used for evaluating friction angle Desai et al. (1985) Uesugi and Kishida (1986) Paikowsky et al. (1995) Abderrahim and Tisot (1993)

Some Terminologies
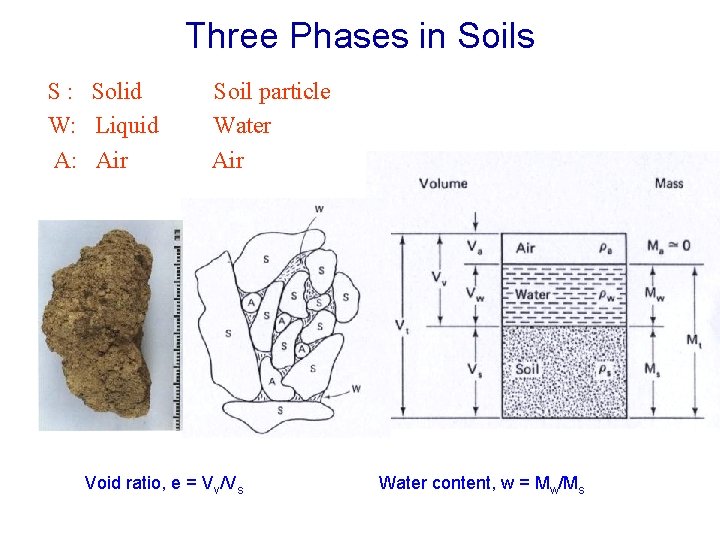
Three Phases in Soils S : Solid W: Liquid A: Air Soil particle Water Air Void ratio, e = Vv/Vs Water content, w = Mw/Ms
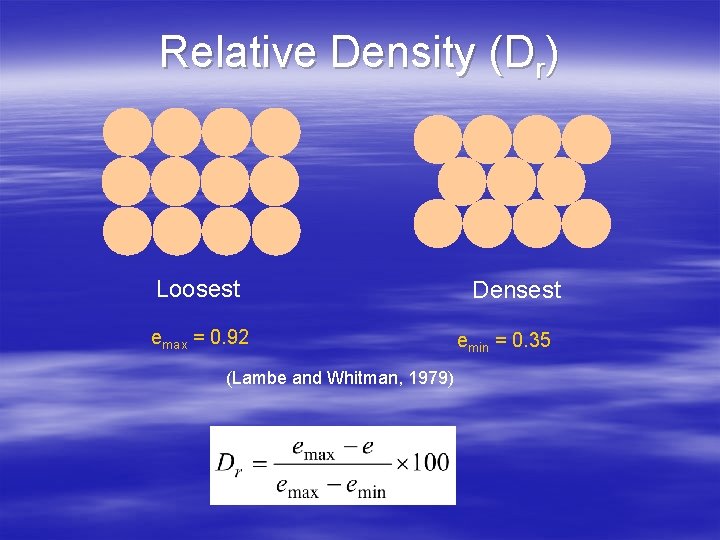
Relative Density (Dr) Loosest emax = 0. 92 (Lambe and Whitman, 1979) Densest emin = 0. 35
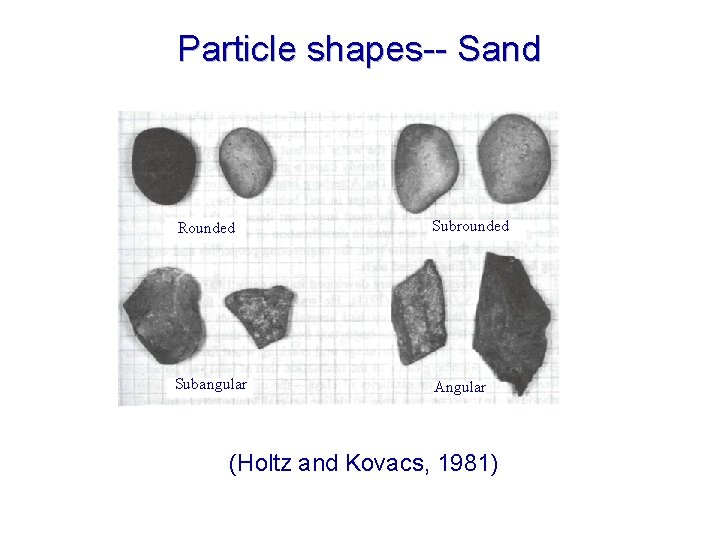
Particle shapes-- Sand Coarsegrained soils Rounded Subrounded Subangular Angular (Holtz and Kovacs, 1981)
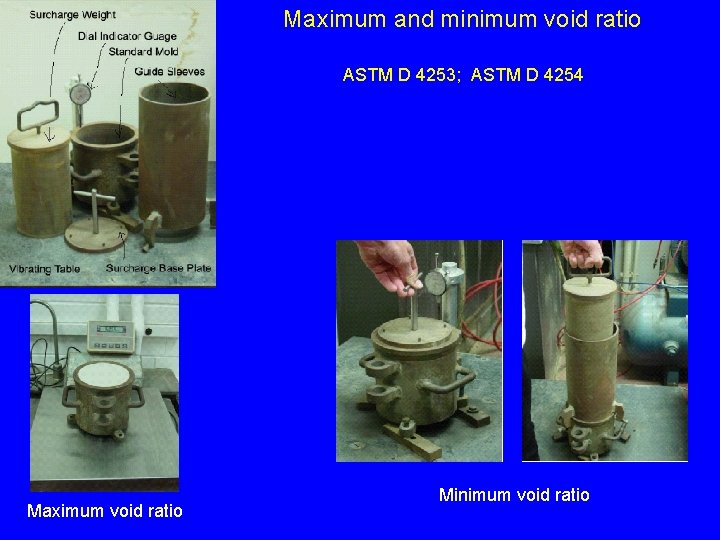
Maximum and minimum void ratio ASTM D 4253; ASTM D 4254 Maximum void ratio Minimum void ratio
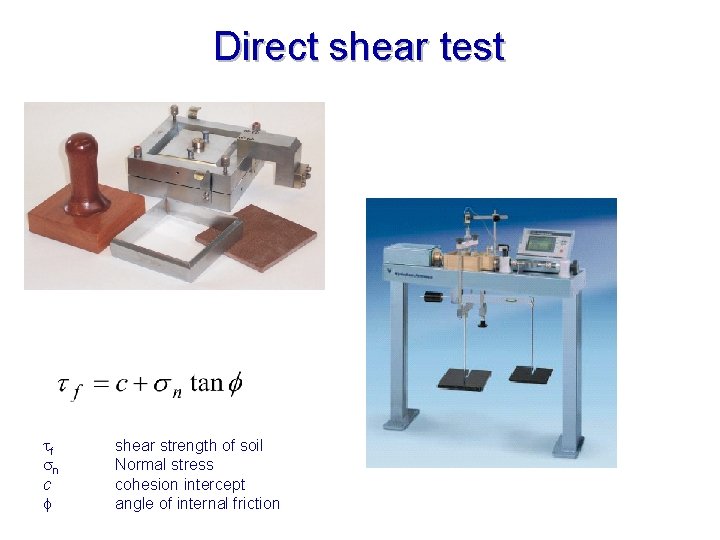
Direct shear test tf sn c shear strength of soil Normal stress cohesion intercept angle of internal friction
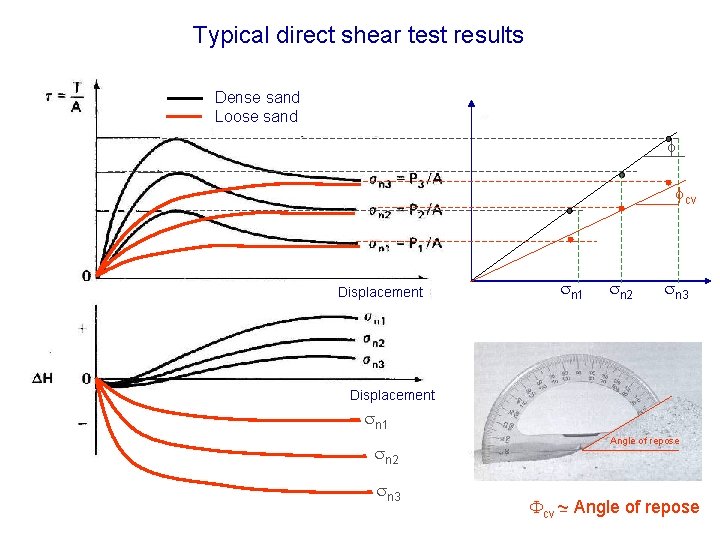
Typical direct shear test results Dense sand Loose sand cv Displacement sn 1 sn 2 sn 3 Angle of repose Fcv ~ Angle of repose
Interface friction in sands
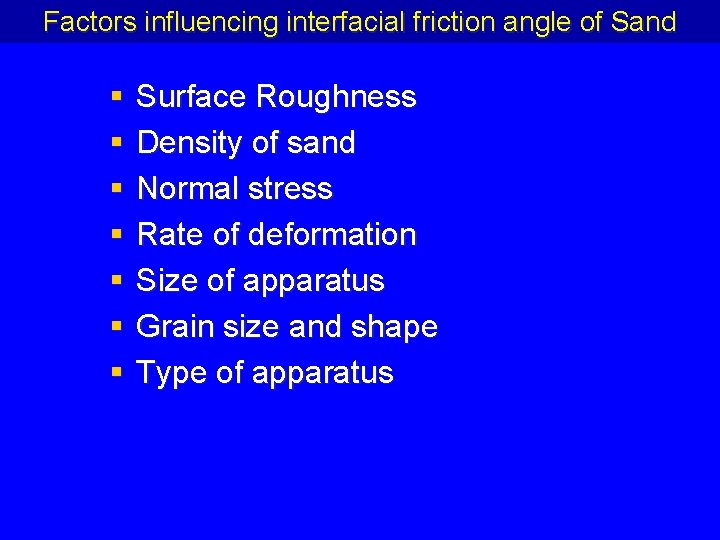
Factors influencing interfacial friction angle of Sand § § § § Surface Roughness Density of sand Normal stress Rate of deformation Size of apparatus Grain size and shape Type of apparatus
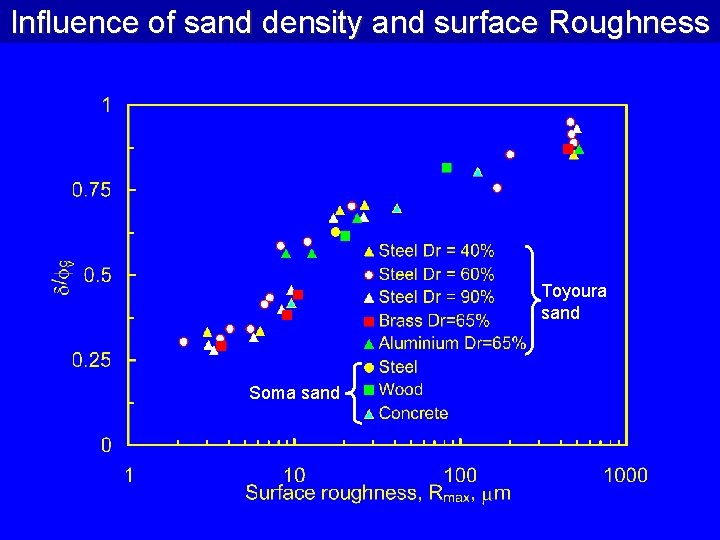
Influence of sand density and surface Roughness Toyoura sand Soma sand
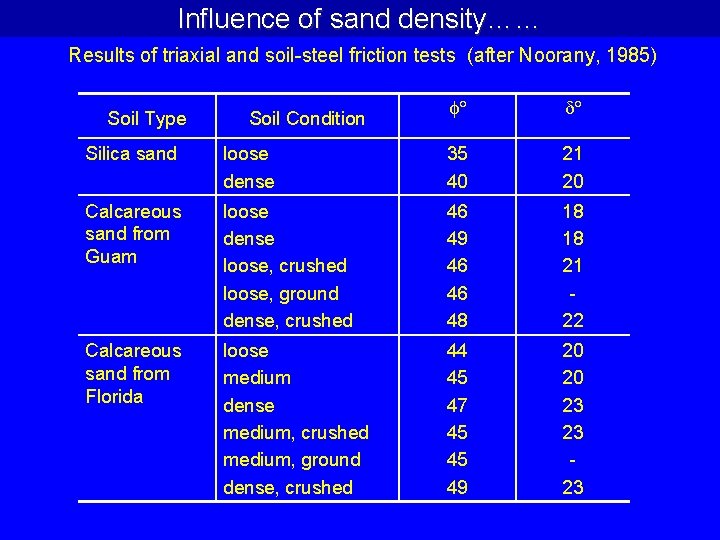
Influence of sand density…… Results of triaxial and soil-steel friction tests (after Noorany, 1985) Soil Type Soil Condition Silica sand loose dense 35 40 21 20 Calcareous sand from Guam loose dense loose, crushed loose, ground dense, crushed 46 49 46 46 48 18 18 21 22 Calcareous sand from Florida loose medium dense medium, crushed medium, ground dense, crushed 44 45 47 45 45 49 20 20 23 23 23
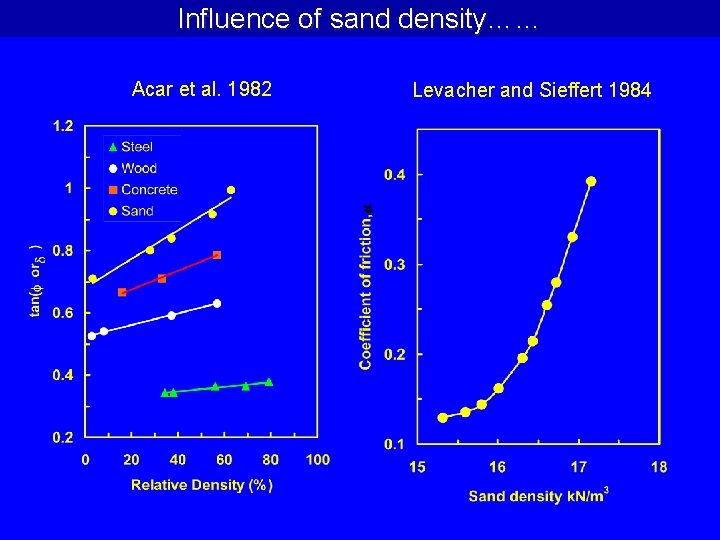
Influence of sand density…… Acar et al. 1982 Levacher and Sieffert 1984
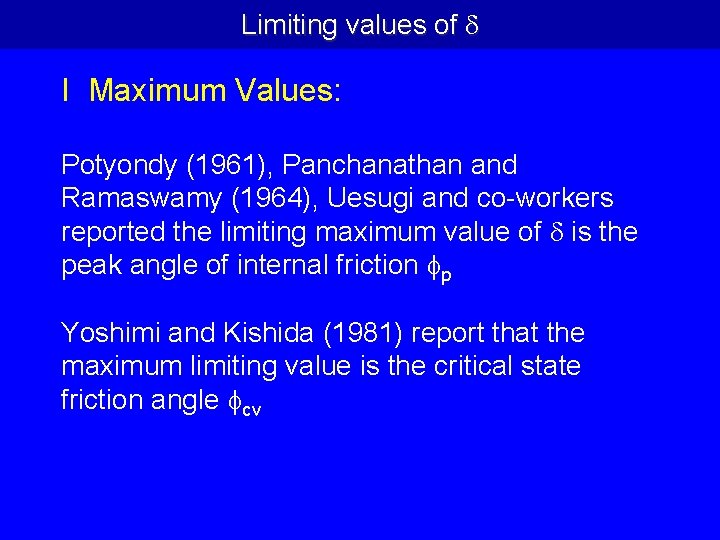
Limiting values of I Maximum Values: Potyondy (1961), Panchanathan and Ramaswamy (1964), Uesugi and co-workers reported the limiting maximum value of is the peak angle of internal friction p Yoshimi and Kishida (1981) report that the maximum limiting value is the critical state friction angle cv
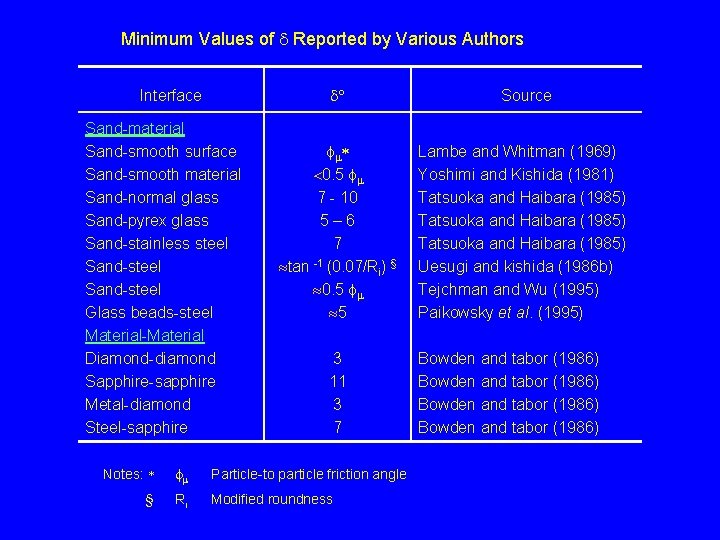
Minimum Values of Reported by Various Authors Interface Sand-material Sand-smooth surface Sand-smooth material Sand-normal glass Sand-pyrex glass Sand-stainless steel Sand-steel Glass beads-steel Material-Material Diamond-diamond Sapphire-sapphire Metal-diamond Steel-sapphire Source <0. 5 7 - 10 5– 6 7 » tan -1 (0. 07/Ri) § » 0. 5 » 5 Lambe and Whitman (1969) Yoshimi and Kishida (1981) Tatsuoka and Haibara (1985) Uesugi and kishida (1986 b) Tejchman and Wu (1995) Paikowsky et al. (1995) 3 11 3 7 Notes: Particle-to particle friction angle § Ri Modified roundness Bowden and tabor (1986)
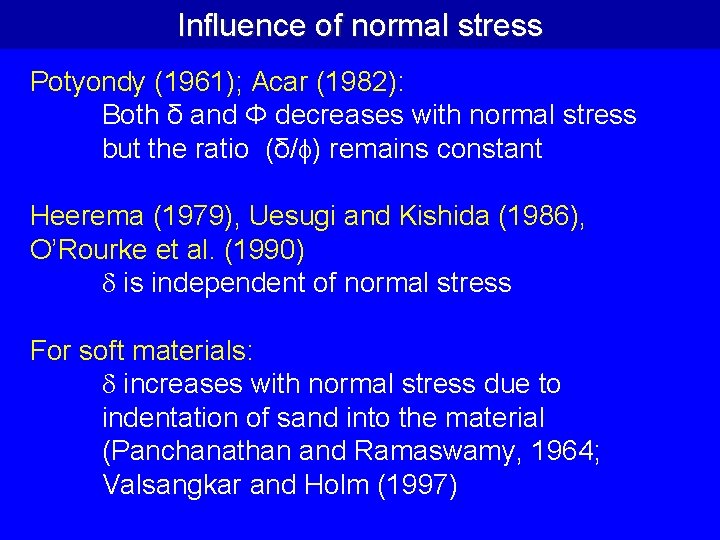
Influence of normal stress Potyondy (1961); Acar (1982): Both δ and Φ decreases with normal stress but the ratio (δ/ ) remains constant Heerema (1979), Uesugi and Kishida (1986), O’Rourke et al. (1990) is independent of normal stress For soft materials: increases with normal stress due to indentation of sand into the material (Panchanathan and Ramaswamy, 1964; Valsangkar and Holm (1997)
Influence of Rate of deformation § Heerema (1979) – Rate of deformation from 0. 7 to 600 mm/s – No influence § Lemos (1986) – Rate of deformation 0. 0038 to 133 mm/min – No influence
Influence of Size of apparatus § Brumund and Leonards (1973) – Rods with interface area of 225 cm 2 and 400 cm 2 – No appreciable difference § Uesugi and kishida (1986) – Simple shear apparatus, 40 cm 2 and 400 cm 2 – No influence § O’Rourke et al (1990) – Direct shear apparatus of size equal to 6 cm x 6 cm, 10 cm x 10 cm, 28 cm x 28 cm and 30. 5 x 30. 5 cm – No significant influence
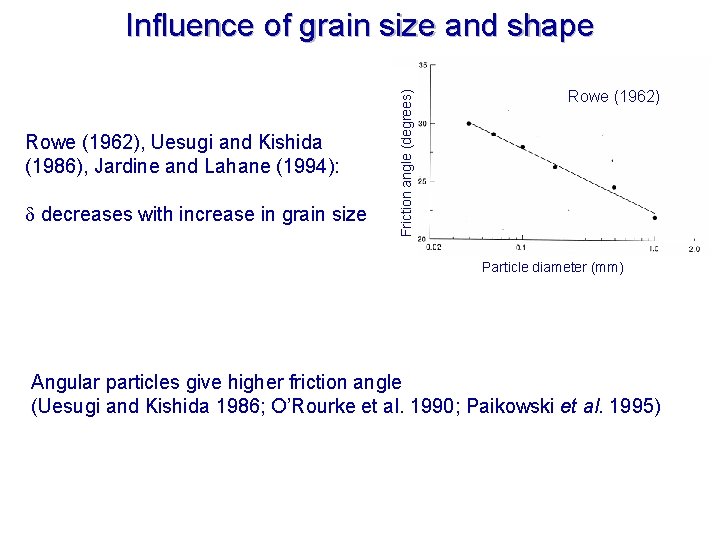
Rowe (1962), Uesugi and Kishida (1986), Jardine and Lahane (1994): decreases with increase in grain size Friction angle (degrees) Influence of grain size and shape Rowe (1962) Particle diameter (mm) Angular particles give higher friction angle (Uesugi and Kishida 1986; O’Rourke et al. 1990; Paikowski et al. 1995)
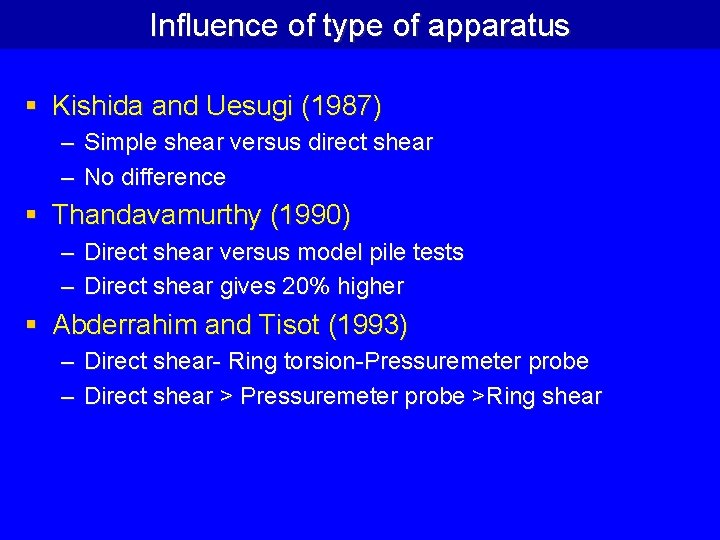
Influence of type of apparatus § Kishida and Uesugi (1987) – Simple shear versus direct shear – No difference § Thandavamurthy (1990) – Direct shear versus model pile tests – Direct shear gives 20% higher § Abderrahim and Tisot (1993) – Direct shear- Ring torsion-Pressuremeter probe – Direct shear > Pressuremeter probe >Ring shear
QUANTIFICATION OF INTERFACE ROUGHNESS
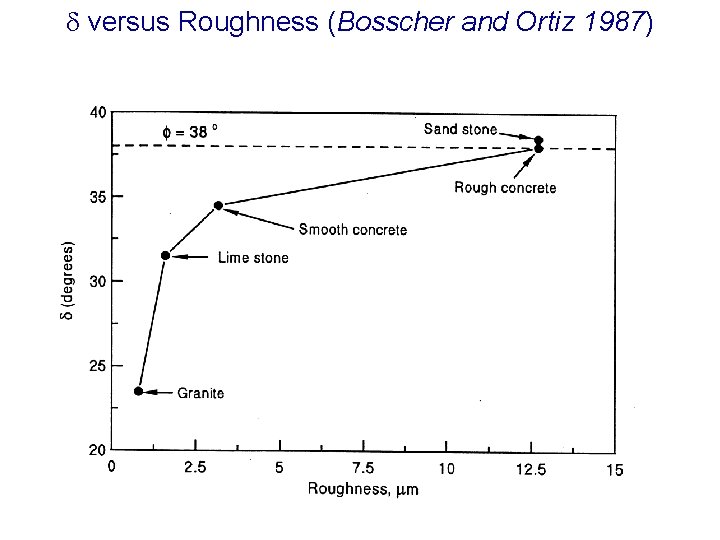
versus Roughness (Bosscher and Ortiz 1987)
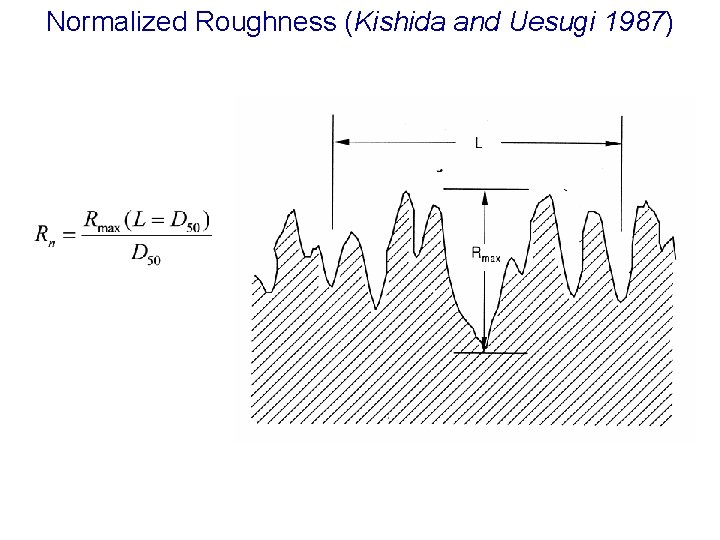
Normalized Roughness (Kishida and Uesugi 1987)
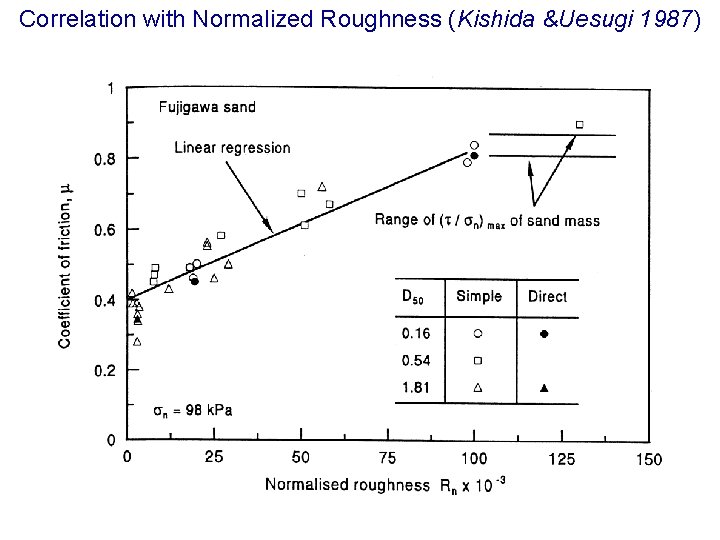
Correlation with Normalized Roughness (Kishida &Uesugi 1987)
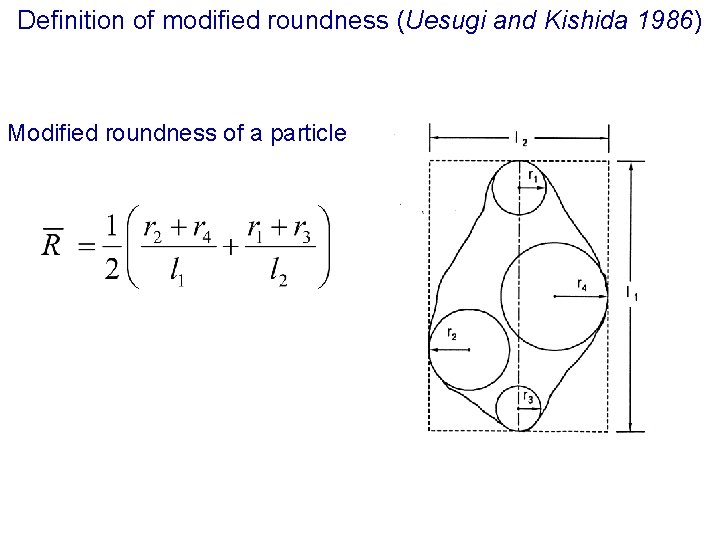
Definition of modified roundness (Uesugi and Kishida 1986) Modified roundness of a particle
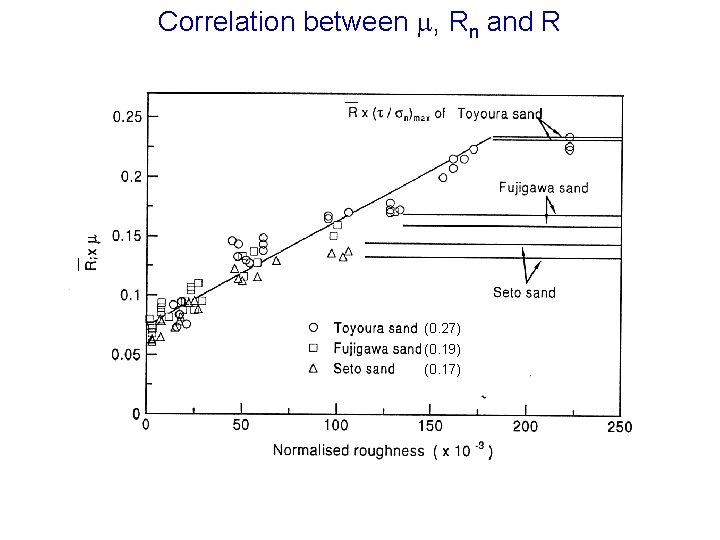
Correlation between , Rn and R (0. 27) (0. 19) (0. 17)
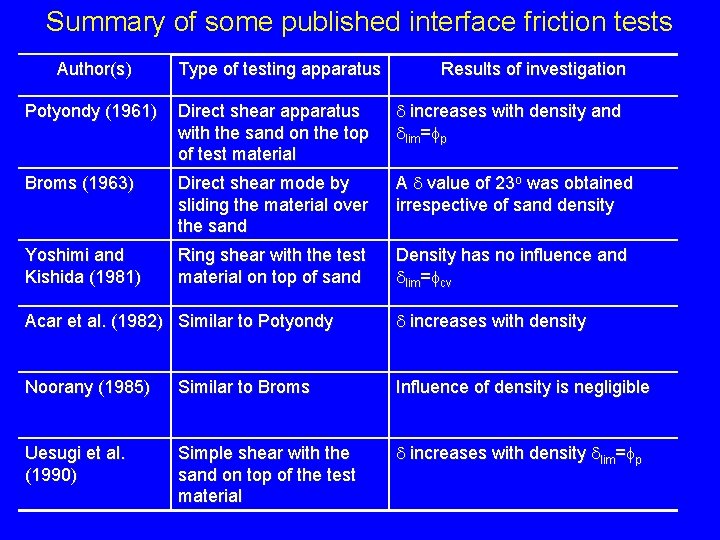
Summary of some published interface friction tests Author(s) Type of testing apparatus Results of investigation Potyondy (1961) Direct shear apparatus with the sand on the top of test material increases with density and lim= p Broms (1963) Direct shear mode by sliding the material over the sand A value of 23 o was obtained irrespective of sand density Yoshimi and Kishida (1981) Ring shear with the test material on top of sand Density has no influence and lim= cv Acar et al. (1982) Similar to Potyondy increases with density Noorany (1985) Similar to Broms Influence of density is negligible Uesugi et al. (1990) Simple shear with the sand on top of the test material increases with density lim= p
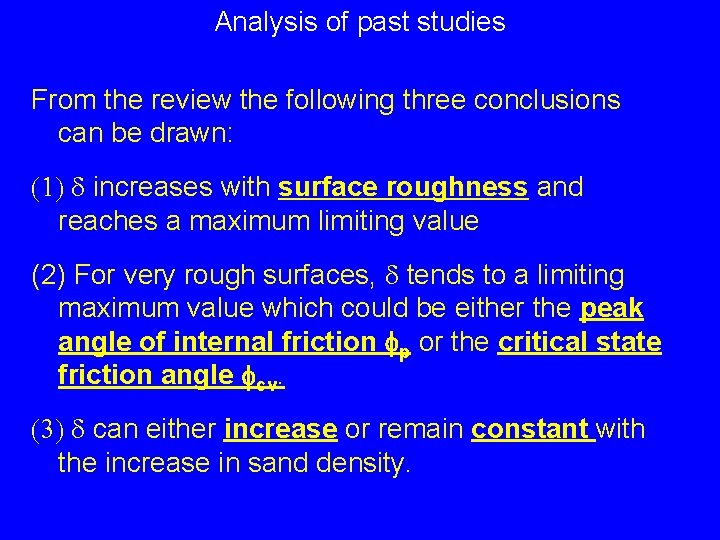
Analysis of past studies From the review the following three conclusions can be drawn: (1) increases with surface roughness and reaches a maximum limiting value (2) For very rough surfaces, tends to a limiting maximum value which could be either the peak angle of internal friction fp or the critical state friction angle fcv. (3) can either increase or remain constant with the increase in sand density.
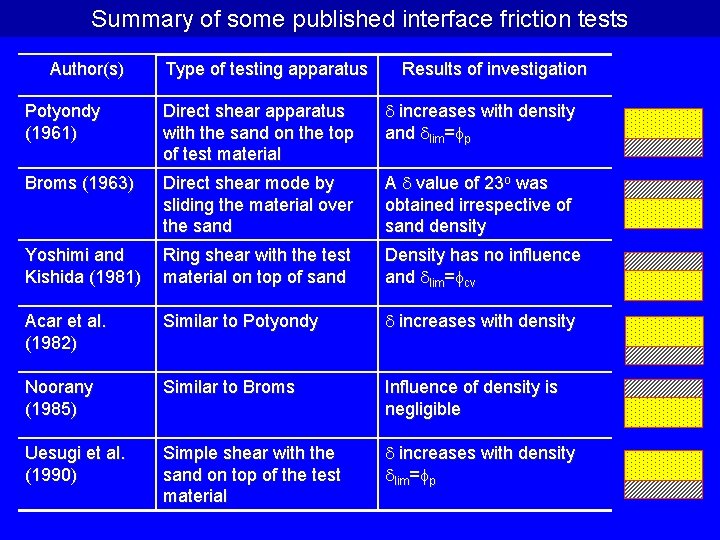
Summary of some published interface friction tests Author(s) Type of testing apparatus Results of investigation Potyondy (1961) Direct shear apparatus with the sand on the top of test material increases with density and lim= p Broms (1963) Direct shear mode by sliding the material over the sand A value of 23 o was obtained irrespective of sand density Yoshimi and Kishida (1981) Ring shear with the test material on top of sand Density has no influence and lim= cv Acar et al. (1982) Similar to Potyondy increases with density Noorany (1985) Similar to Broms Influence of density is negligible Uesugi et al. (1990) Simple shear with the sand on top of the test material increases with density lim= p
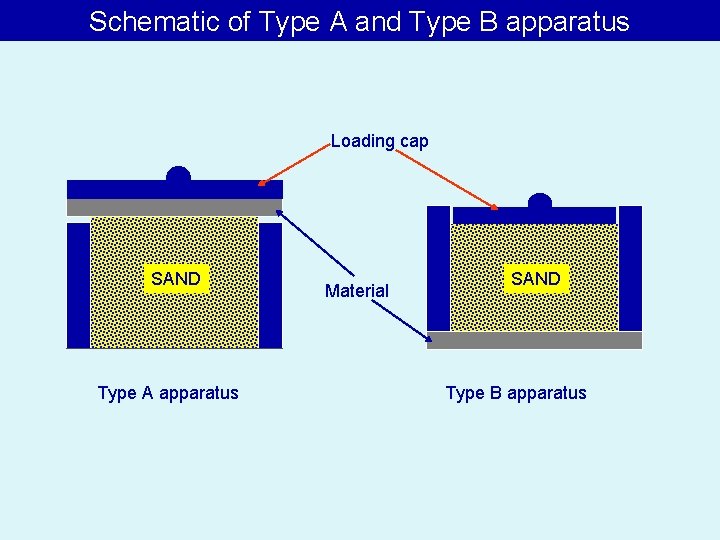
Schematic of Type A and Type B apparatus Loading cap SAND Type A apparatus Material SAND Type B apparatus
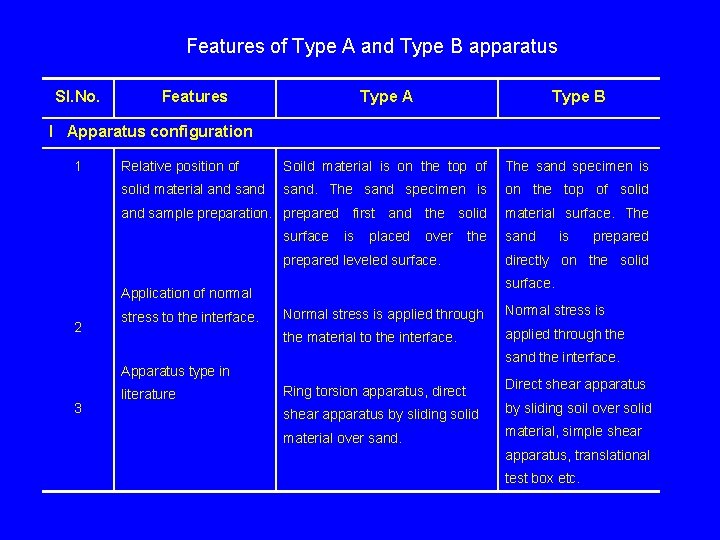
Features of Type A and Type B apparatus Sl. No. Features Type A Type B Relative position of Soild material is on the top of The sand specimen is solid material and sand. The sand specimen is on the top of solid and sample preparation. prepared first and the solid material surface. The I Apparatus configuration 1 surface is placed over the prepared leveled surface. 2 3 prepared directly on the solid Normal stress is applied through Normal stress is the material to the interface. applied through the sand the interface. Apparatus type in literature is surface. Application of normal stress to the interface. sand Ring torsion apparatus, direct Direct shear apparatus by sliding solid by sliding soil over solid material over sand. material, simple shear apparatus, translational test box etc.
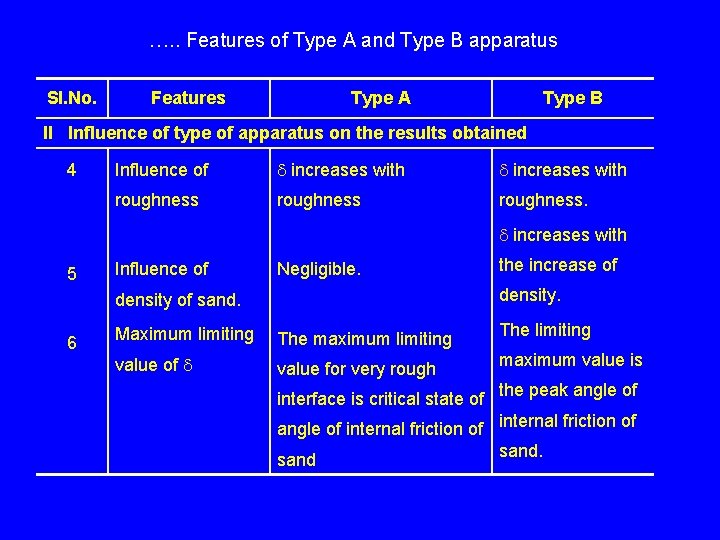
…. . Features of Type A and Type B apparatus Sl. No. Features Type A Type B II Influence of type of apparatus on the results obtained 4 Influence of increases with roughness. increases with 5 Influence of Negligible. density of sand. 6 the increase of Maximum limiting The maximum limiting The limiting value of value for very rough maximum value is interface is critical state of the peak angle of internal friction of sand.
Experiments in Direct shear apparatus
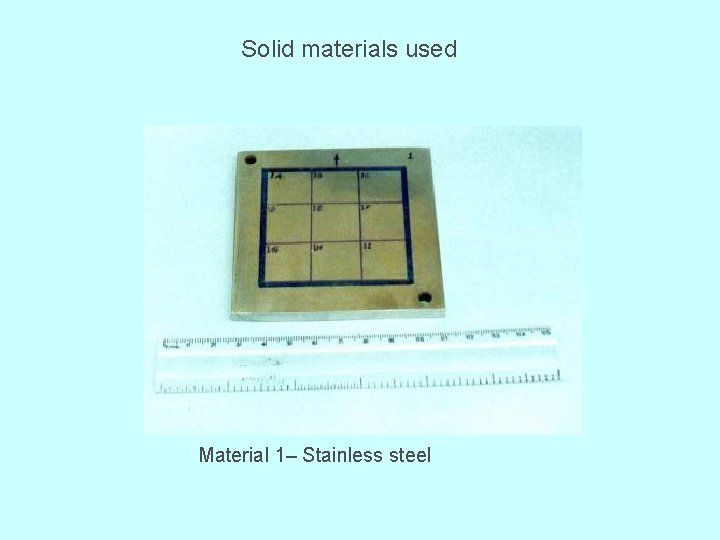
Solid materials used Material 1– Stainless steel
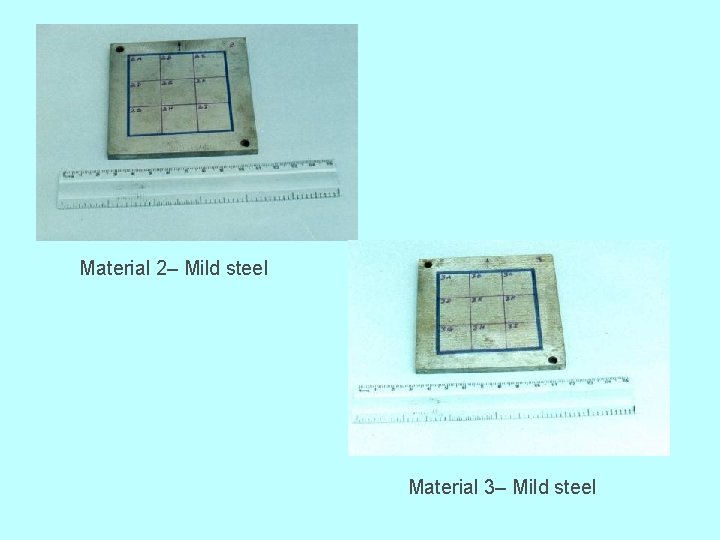
Material 2– Mild steel Material 3– Mild steel
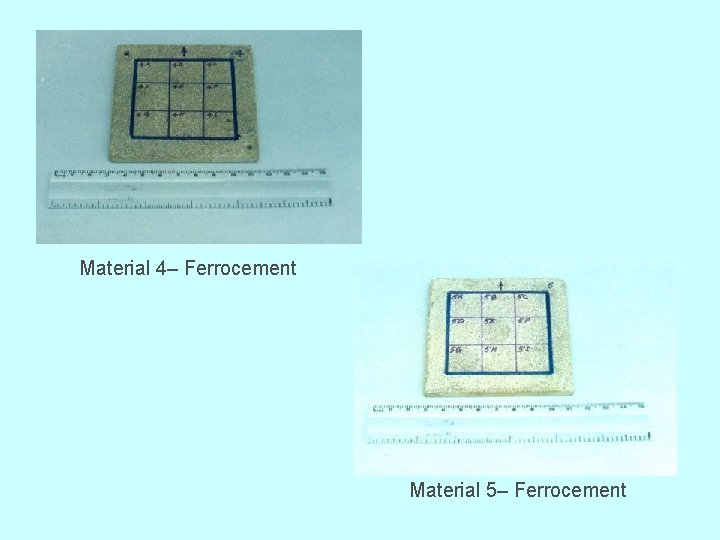
Material 4– Ferrocement Material 5– Ferrocement
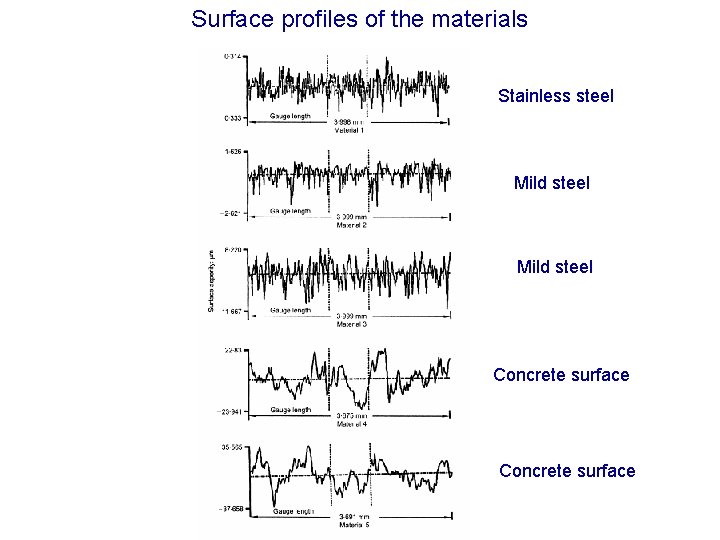
Surface profiles of the materials Stainless steel Mild steel Concrete surface
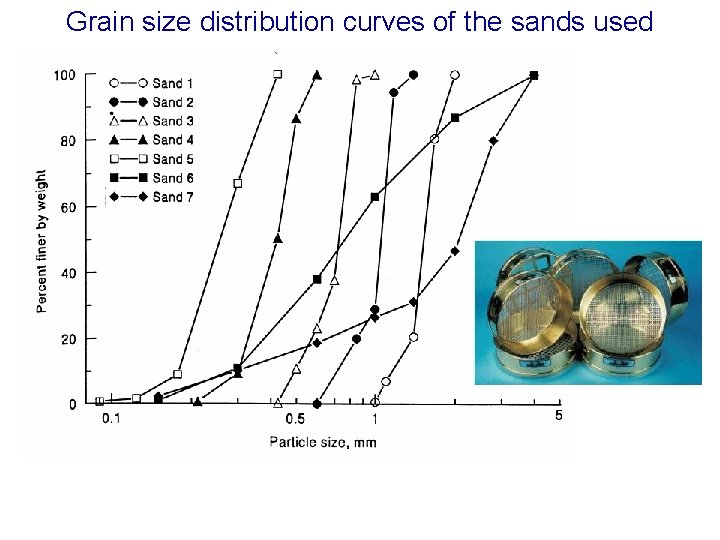
Grain size distribution curves of the sands used
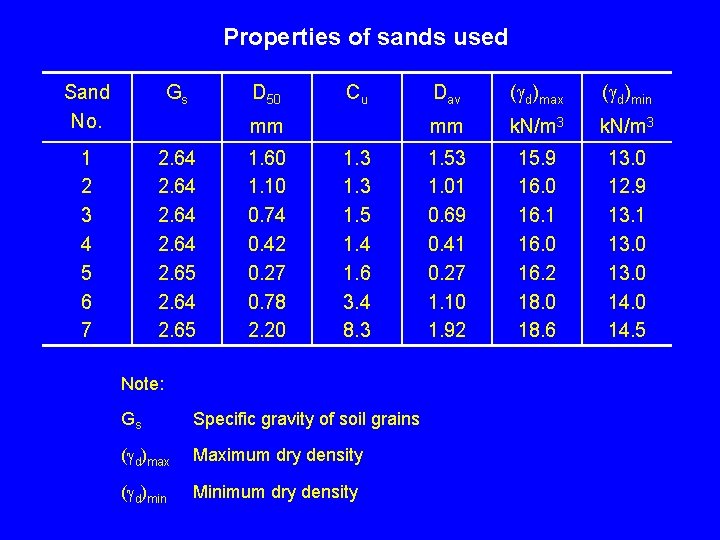
Properties of sands used Sand No. Gs D 50 1 2 3 4 5 6 7 2. 64 2. 65 Cu mm 1. 60 1. 10 0. 74 0. 42 0. 27 0. 78 2. 20 1. 3 1. 5 1. 4 1. 6 3. 4 8. 3 Note: Gs Specific gravity of soil grains ( d)max Maximum dry density ( d)min Minimum dry density Dav ( d)max ( d)min mm k. N/m 3 1. 53 1. 01 0. 69 0. 41 0. 27 1. 10 1. 92 15. 9 16. 0 16. 1 16. 0 16. 2 18. 0 18. 6 13. 0 12. 9 13. 1 13. 0 14. 5
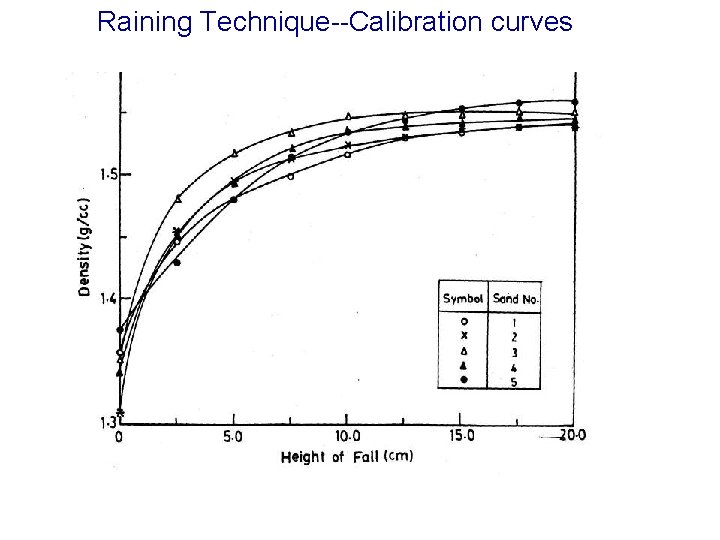
Raining Technique--Calibration curves
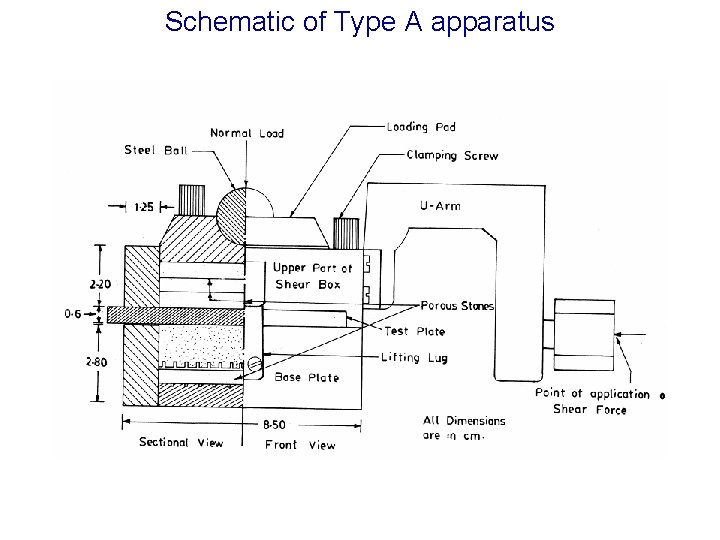
Schematic of Type A apparatus
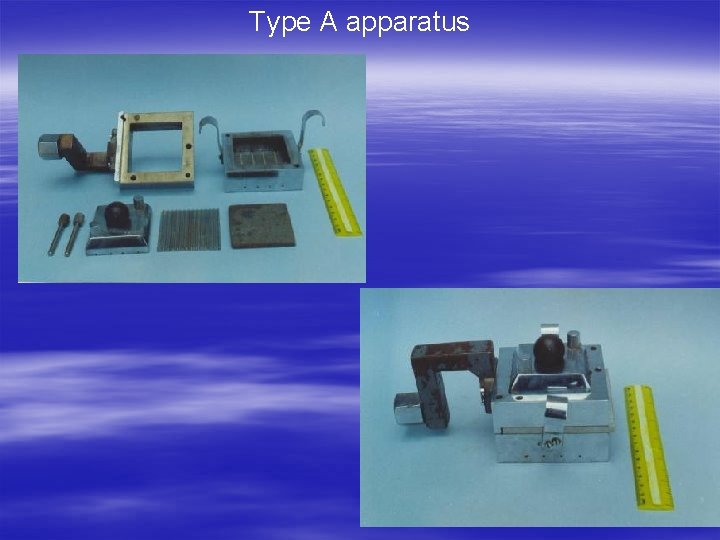
Type A apparatus
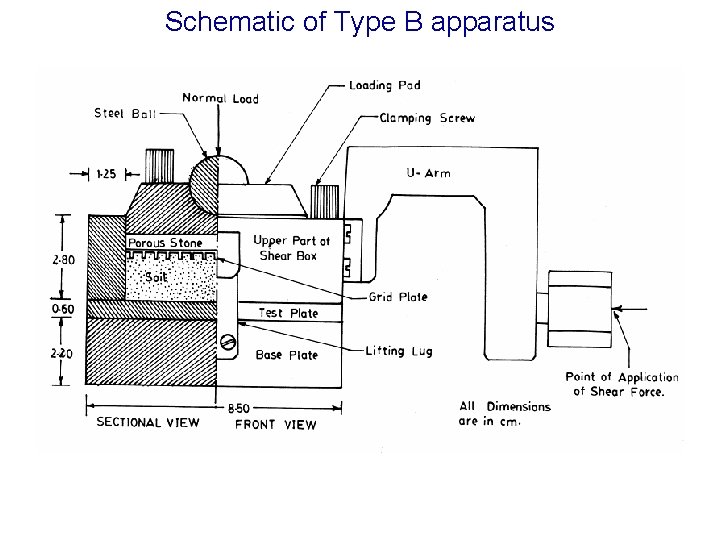
Schematic of Type B apparatus
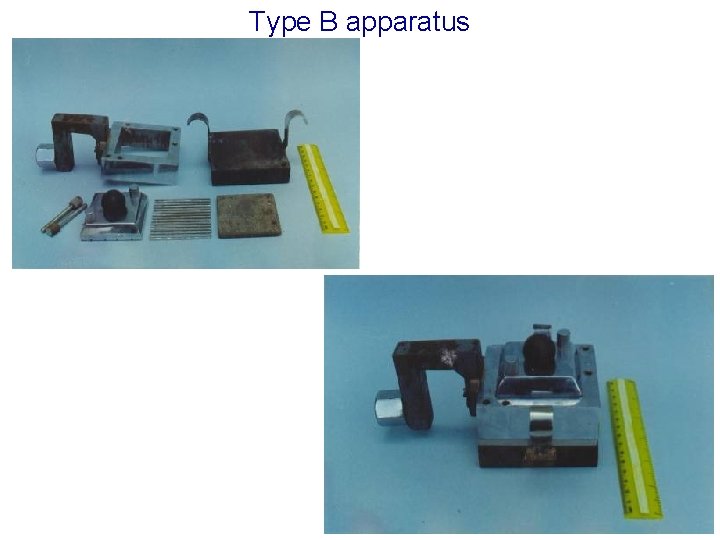
Type B apparatus
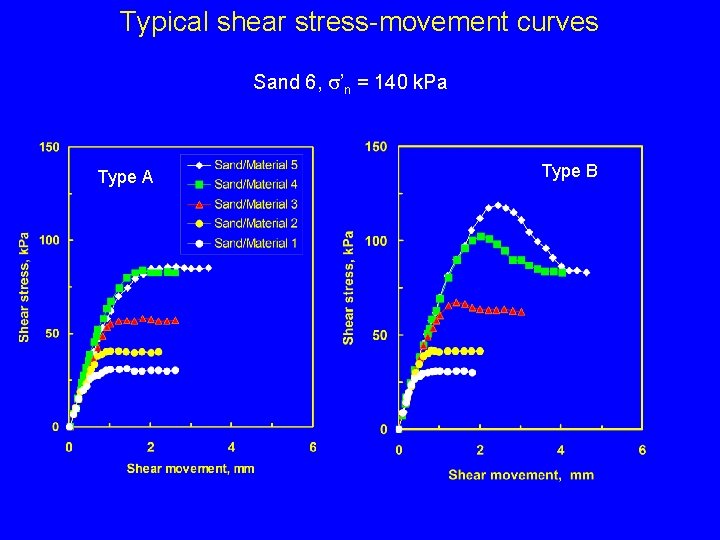
Typical shear stress-movement curves Sand 6, s’n = 140 k. Pa Type A Type B
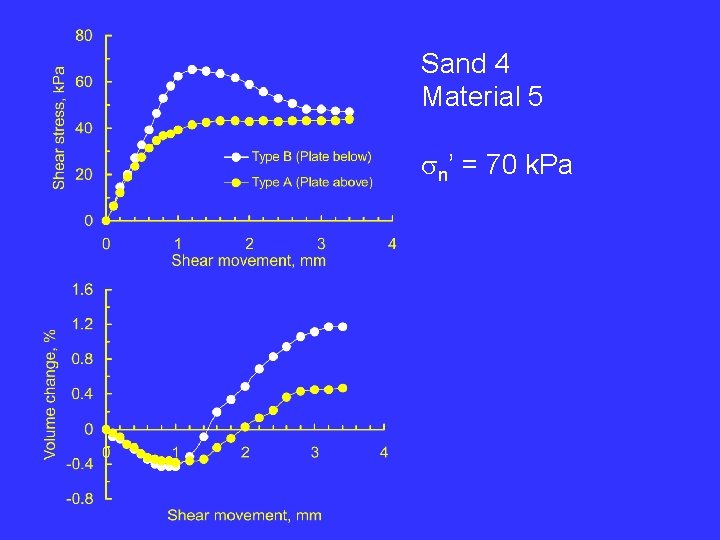
Sand 4 Material 5 sn’ = 70 k. Pa
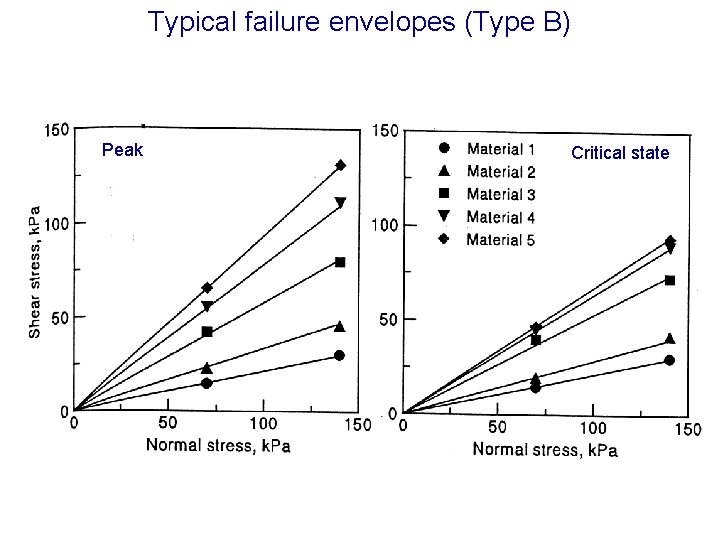
Typical failure envelopes (Type B) Peak Critical state
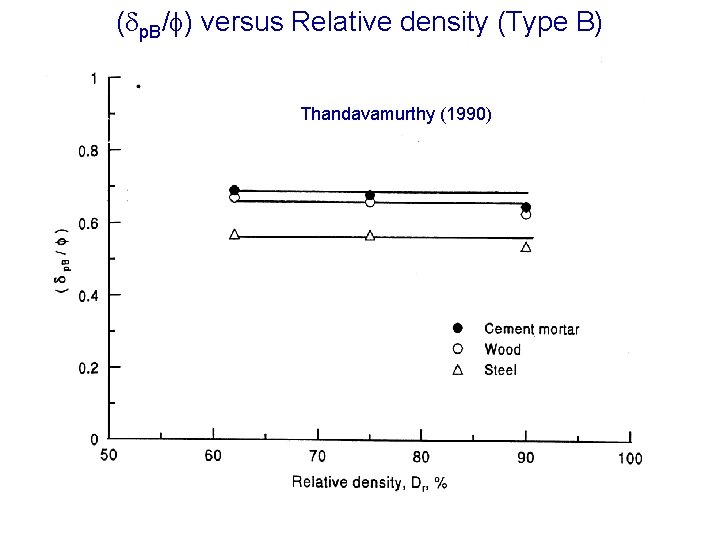
( p. B/ ) versus Relative density (Type B) Thandavamurthy (1990)
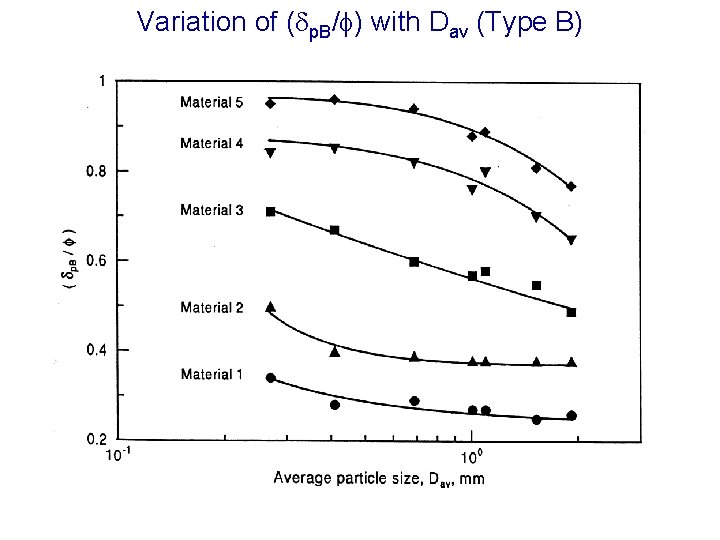
Variation of ( p. B/ ) with Dav (Type B)
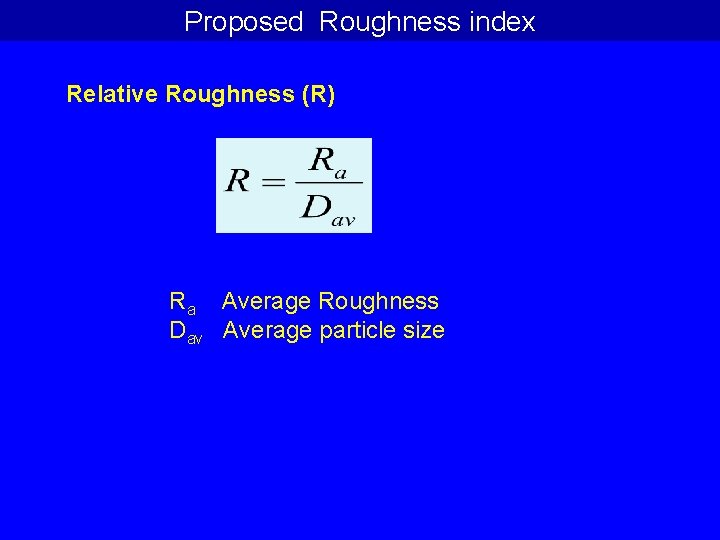
Proposed Roughness index Relative Roughness (R) Ra Average Roughness Dav Average particle size
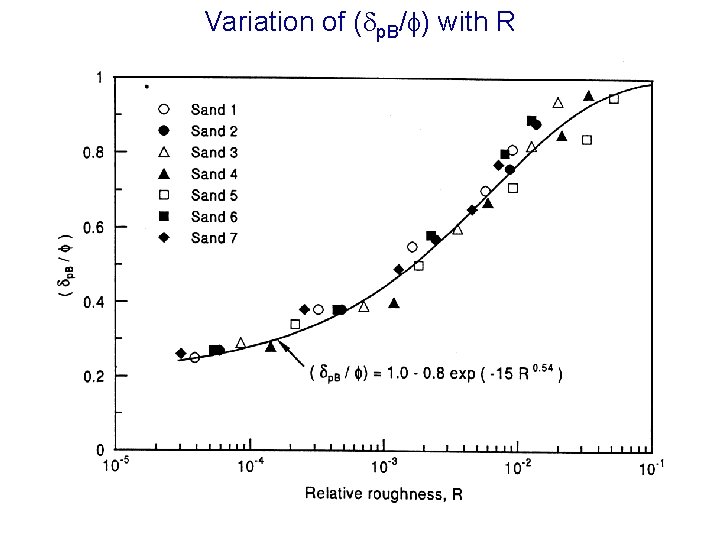
Variation of ( p. B/ ) with R
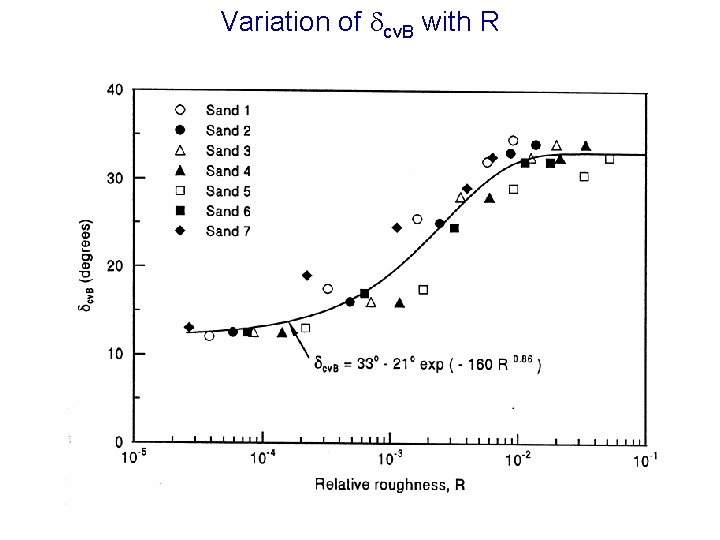
Variation of cv. B with R
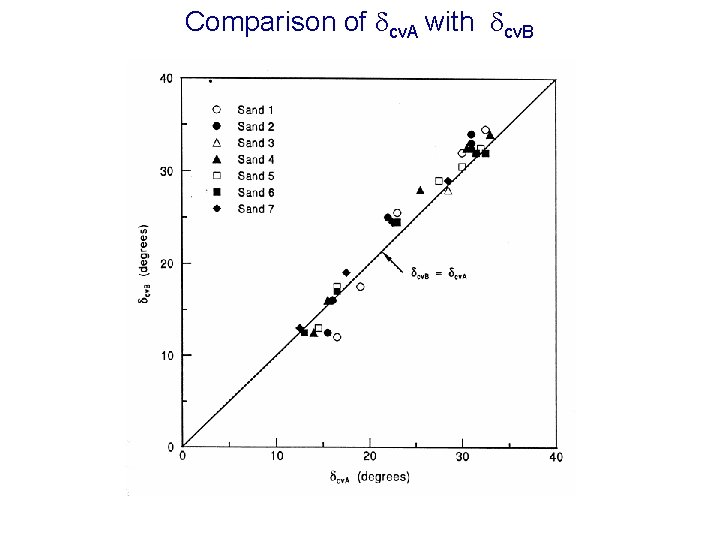
Comparison of cv. A with cv. B
Drained shear strength of finegrained soil-solid surface interfaces
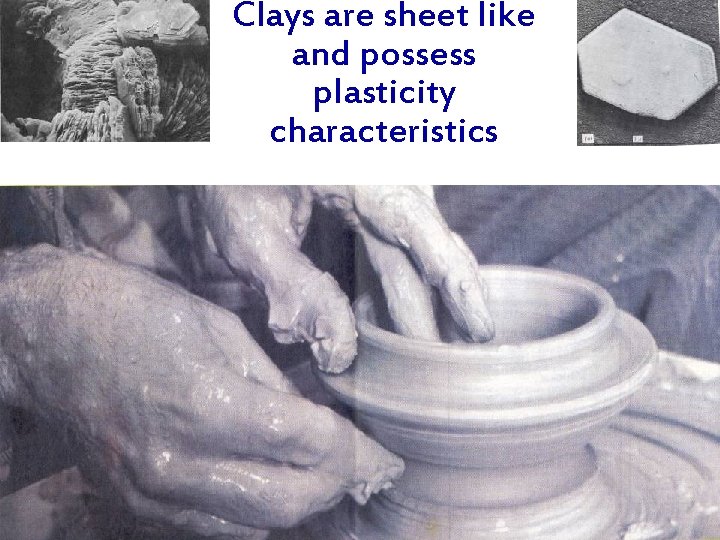
Clays are sheet like and possess plasticity characteristics
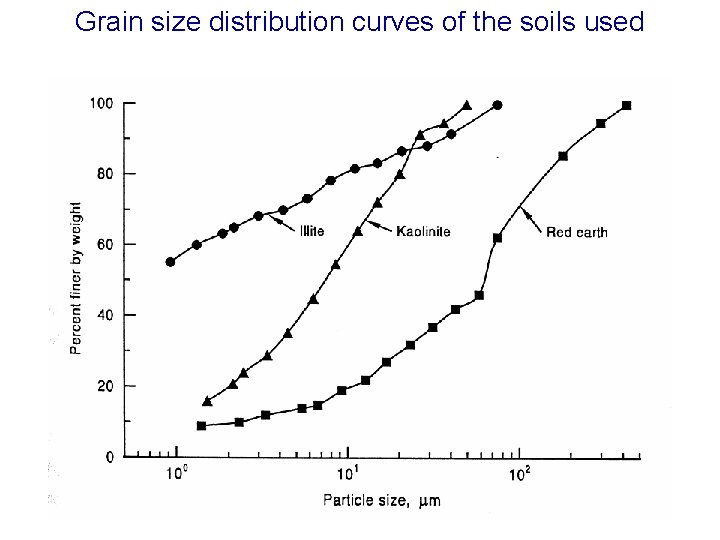
Grain size distribution curves of the soils used
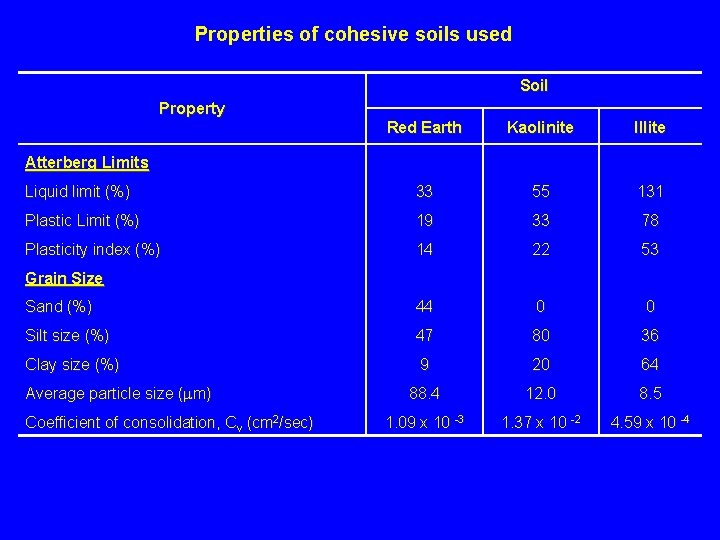
Properties of cohesive soils used Soil Property Red Earth Kaolinite Illite Liquid limit (%) 33 55 131 Plastic Limit (%) 19 33 78 Plasticity index (%) 14 22 53 Sand (%) 44 0 0 Silt size (%) 47 80 36 Clay size (%) 9 20 64 88. 4 12. 0 8. 5 1. 09 x 10 -3 1. 37 x 10 -2 4. 59 x 10 -4 Atterberg Limits Grain Size Average particle size ( m) Coefficient of consolidation, Cv (cm 2/sec)
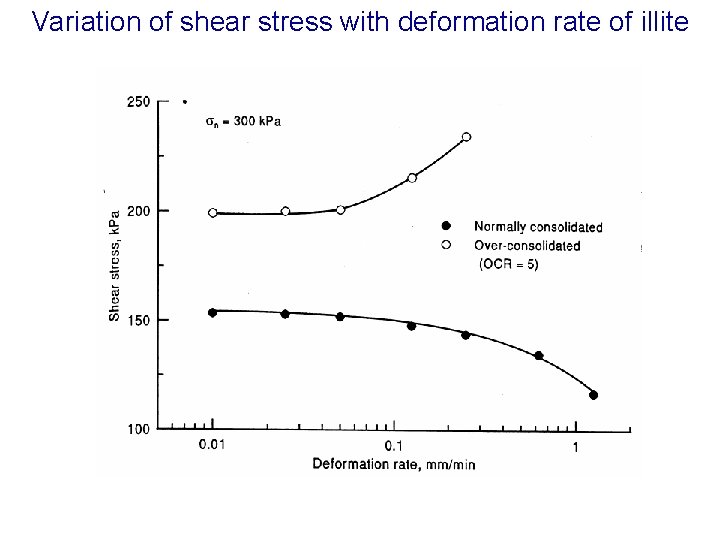
Variation of shear stress with deformation rate of illite
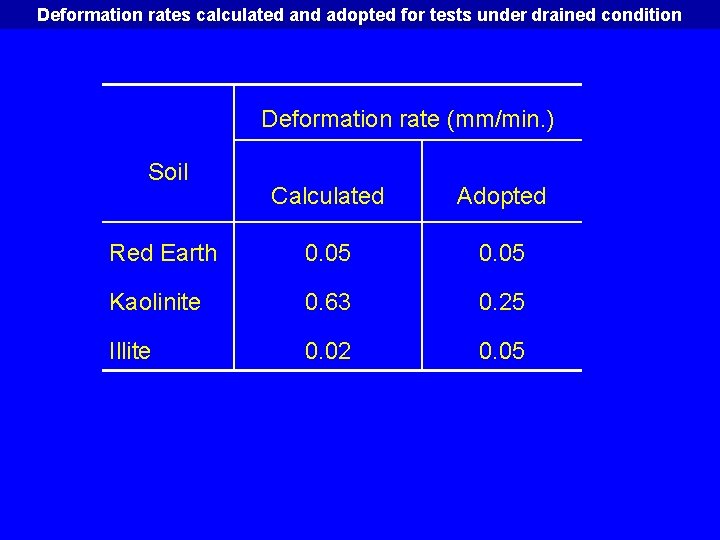
Deformation rates calculated and adopted for tests under drained condition Deformation rate (mm/min. ) Soil Calculated Adopted Red Earth 0. 05 Kaolinite 0. 63 0. 25 Illite 0. 02 0. 05
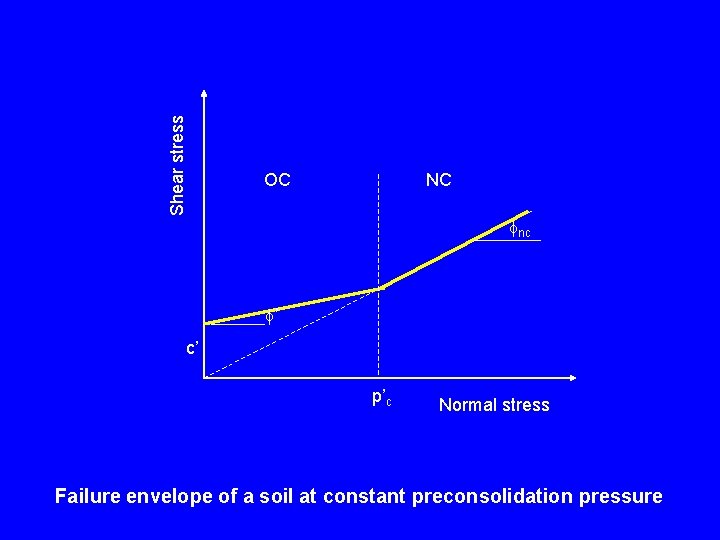
Shear stress OC NC nc ’ c’ p’c Normal stress Failure envelope of a soil at constant preconsolidation pressure
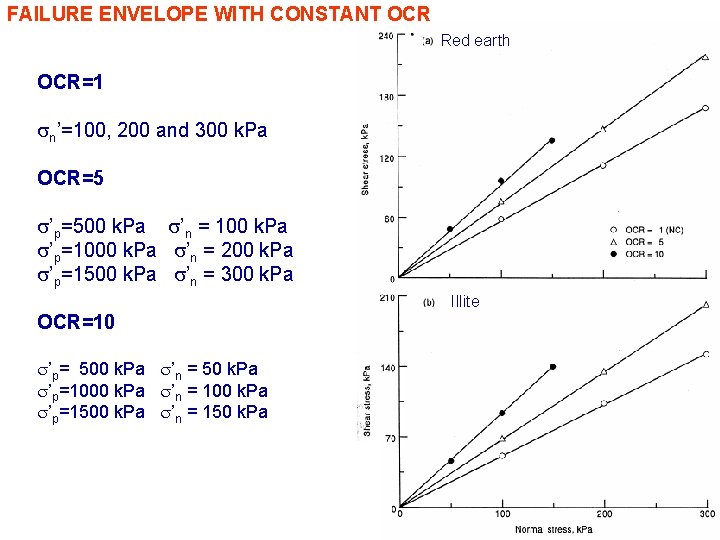
FAILURE ENVELOPE WITH CONSTANT OCR Red earth OCR=1 sn’=100, 200 and 300 k. Pa OCR=5 s’p=500 k. Pa s’n = 100 k. Pa s’p=1000 k. Pa s’n = 200 k. Pa s’p=1500 k. Pa s’n = 300 k. Pa Illite OCR=10 s’p= 500 k. Pa s’n = 50 k. Pa s’p=1000 k. Pa s’n = 100 k. Pa s’p=1500 k. Pa s’n = 150 k. Pa
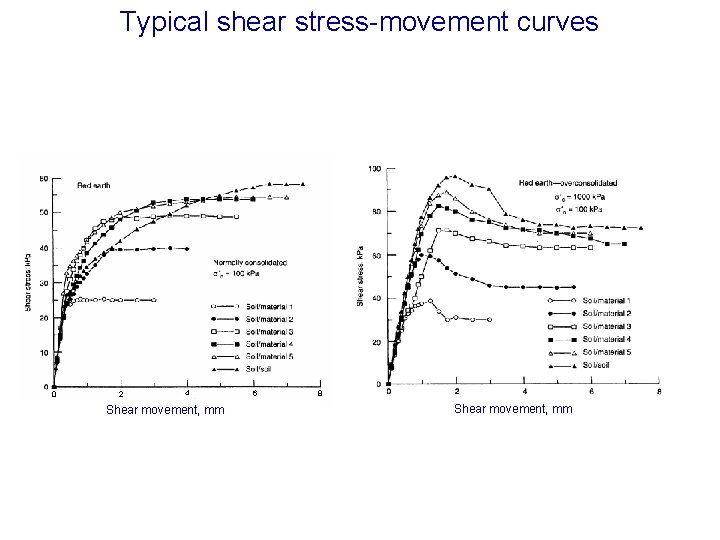
Typical shear stress-movement curves 0 2 4 Shear movement, mm 6 8 Shear movement, mm
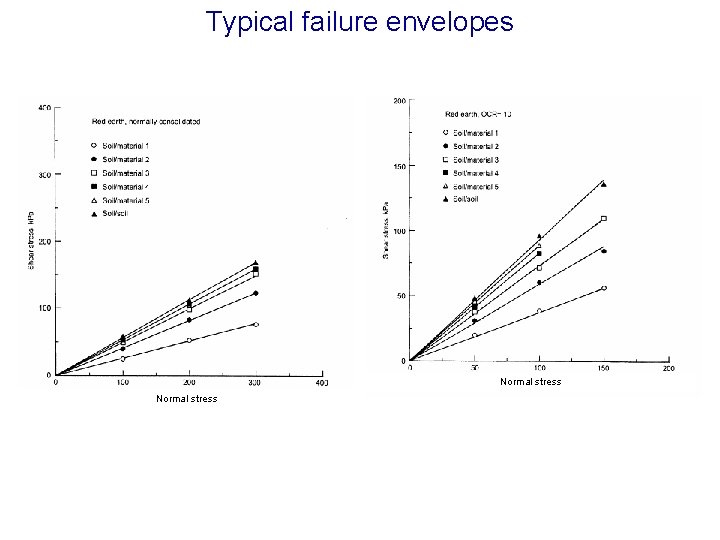
Typical failure envelopes Normal stress
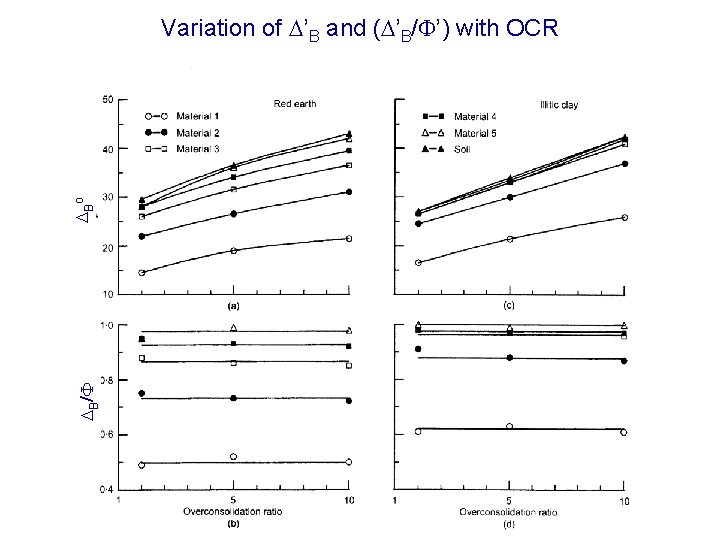
DB/F DBo Variation of D’B and (D’B/F’) with OCR
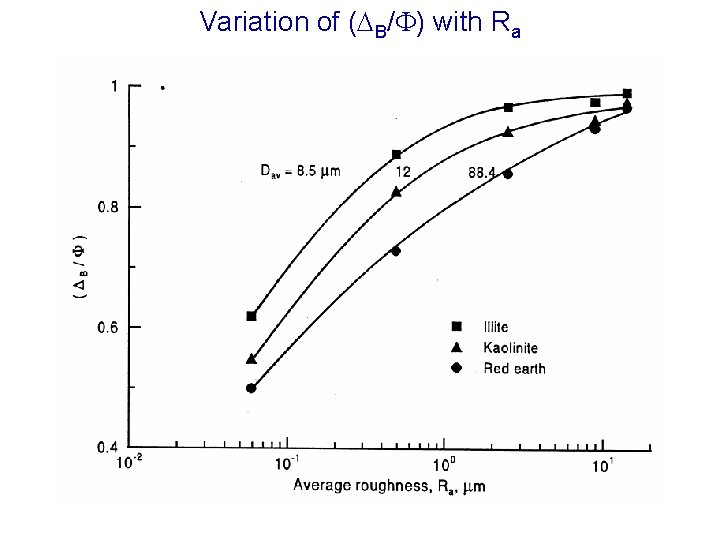
Variation of (DB/F) with Ra
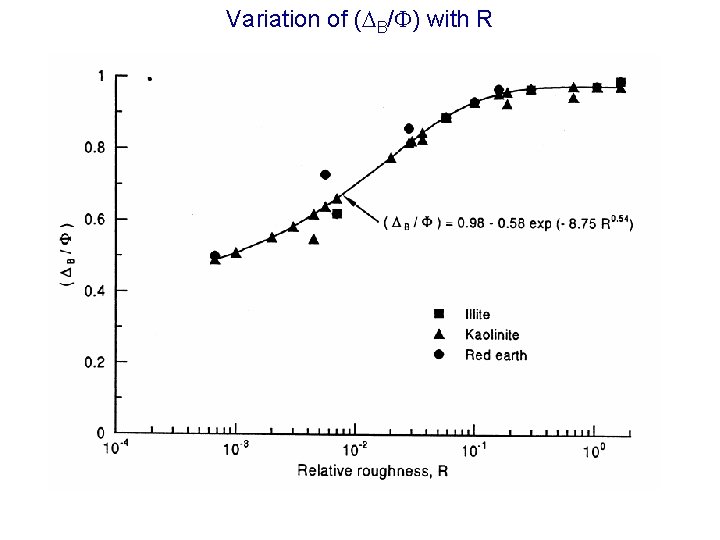
Variation of (DB/F) with R
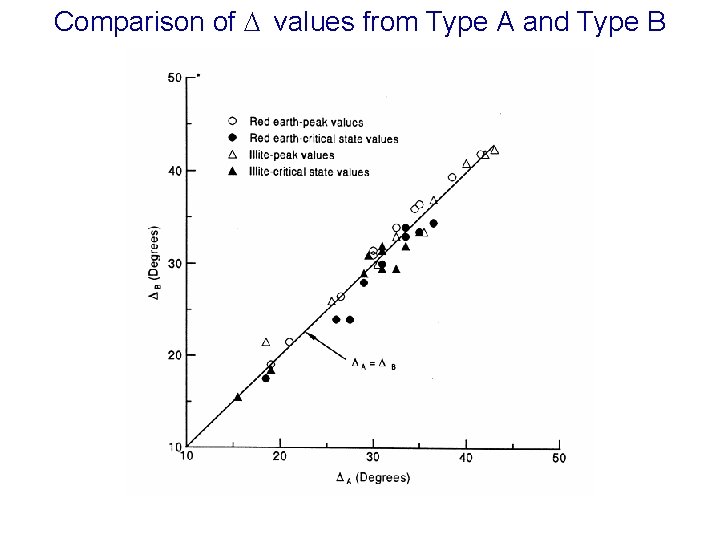
Comparison of D values from Type A and Type B
SUMMARY § Interfacial friction depends on mode of shear for sands and the maximum value of friction angle is controlled by the type of apparatus used to evaluate the friction angle § For clays, mode of shear has no influence
Research Issues § Modeling of interface behaviour : shear stress-movement curves § Roughness § Hardness of solid material § Rigidity of materials § Mode of shear § Particle size and shape

Acknowledgements 1. Prof. K. S. SUBBA RAO 2. Department of Civil Engineering 3. IISc, Bangalore 2. Prof. M. M. Allam Department of Civil Engineering IISc, Bangalore CSIR for funding

Thank you
- Slides: 81