Interannual Variability of WarmSeason Rainfall over the US

Interannual Variability of Warm-Season Rainfall over the US Great Plains in NASA/NSIPP and NCAR/CAM 2. 0 AMIP Simulations By Alfredo Ruiz-Barradas and Sumant Nigam Department of Meteorology University of Maryland December 11, 2003

Goal • To assess interannual variability of precipitation over North America in AMIPlike runs of CAM 2. 0 and NSIPP models during summer months (June, July, August).

Outline • • Data JJA Climatology Interannual Variability Remarks

From TV News: it seems we have “the flood of the century” every year…

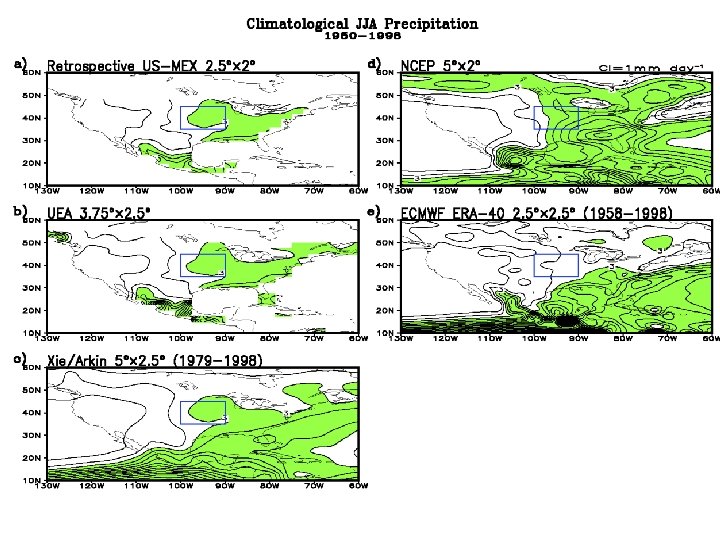
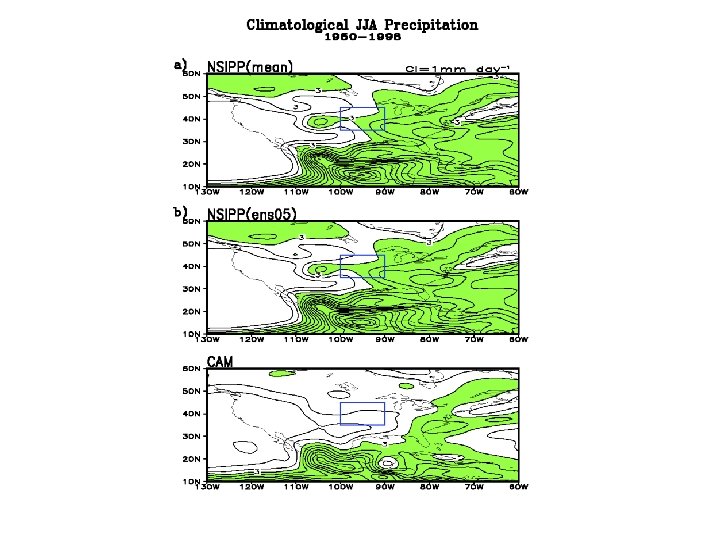
Data • Precipitation: – – Retrospective US and Mexico analysis. Hulme (University of East Anglia) data set. Xie/Arkin precipitation data set. NCEP & ERA 40 Reanalyses. • SST from Hadley Center. • NCEP & ERA 40 Reanalyses. • AMIP simulations (ens 05 & mean) from the NSIPP model. • AMIP simulation (case newsstamip 06) from the CAM model.

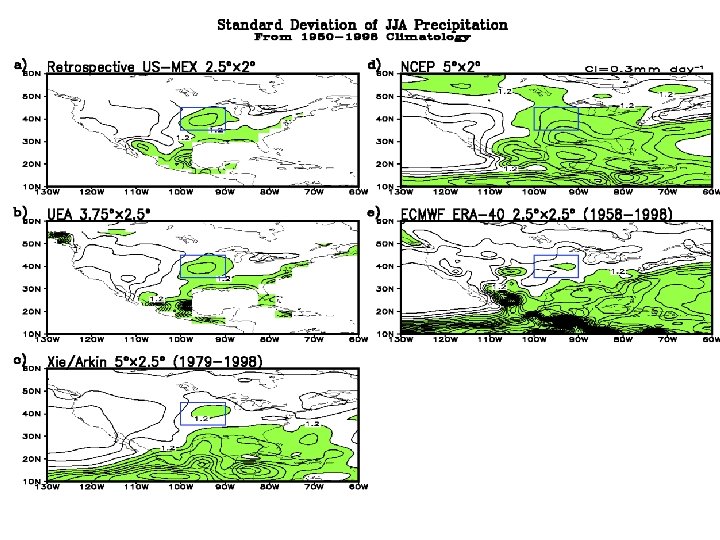
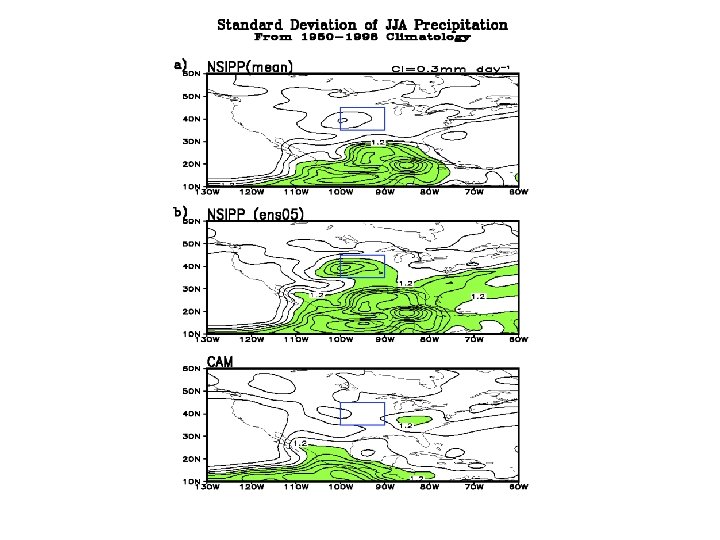
Data • Reanalysis and simulations extrapolated to a 5° 2. 5 grid on 17 pressure levels. • Monthly climatology for the 1950 -1998 period. • Monthly anomalies wrt 1950 -1998 climatology. • JJA is the mean of June, July, August. • Assessment through: – Standard Deviation – Precipitation Index – Multivariate analysis

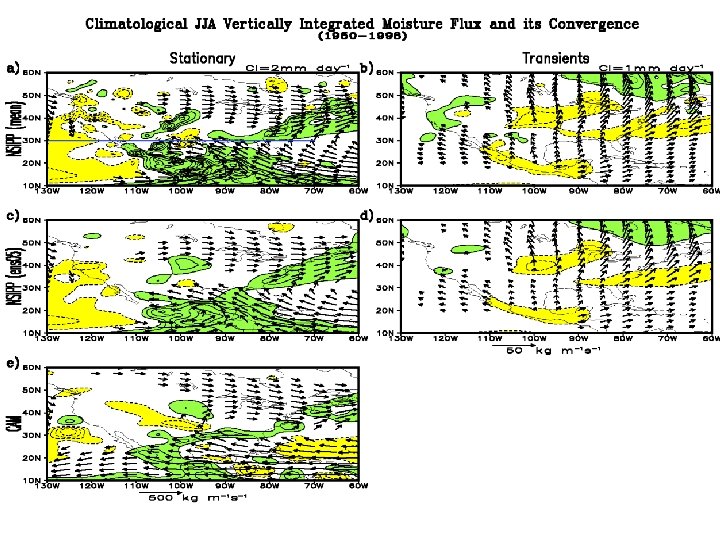
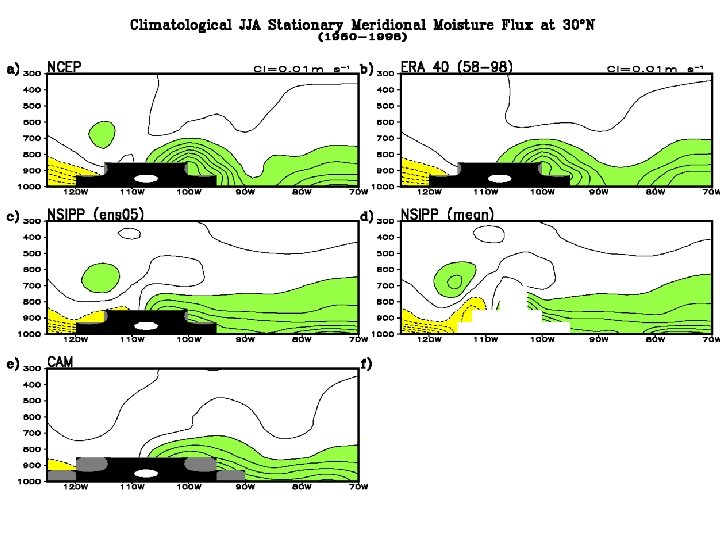
CLIMATOLOGY OF MOISTURE FLUXES
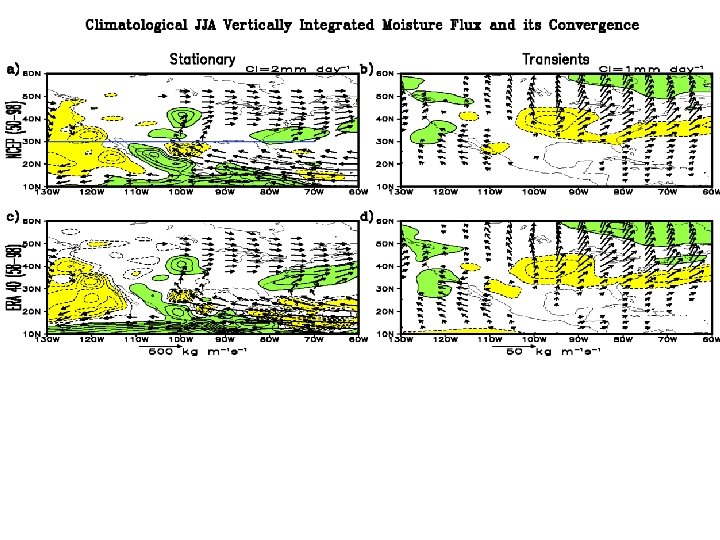
 Observations in agreement: mean southerly moisture")
Remarks: Climatology • Vertically Integrated Moisture Fluxes: 1) Observations in agreement: mean southerly moisture fluxes from MFD in the Gulf of Mexico and Caribbean Sea toward MFC in the GP; output of moisture fluxes by transients from the GP region to the N and NE. 2) Simulations reproduce observed features at different extent with NSIPP and CAM having problems to capture both MFC and southerly moisture flux. • Precipitation: 1) No-reanalysis data sets agree very well. 2) NCEP Reanalysis overestimate precipitation; ERA-40 is reasonably well. 3) Shifted maximum in simulations: W in NSIPP, E in CAM.

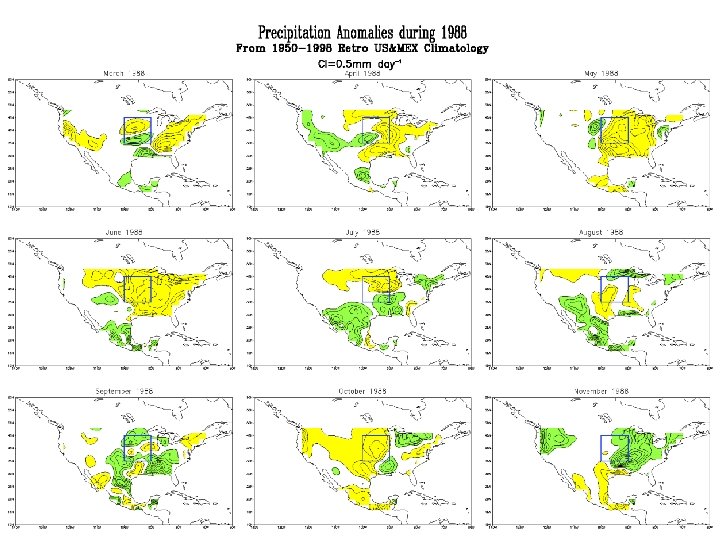
INTERANNUAL VARIABILITY OF PRECIPITATION

 No-reanalysis data sets agree very well. 2) NCEP has")
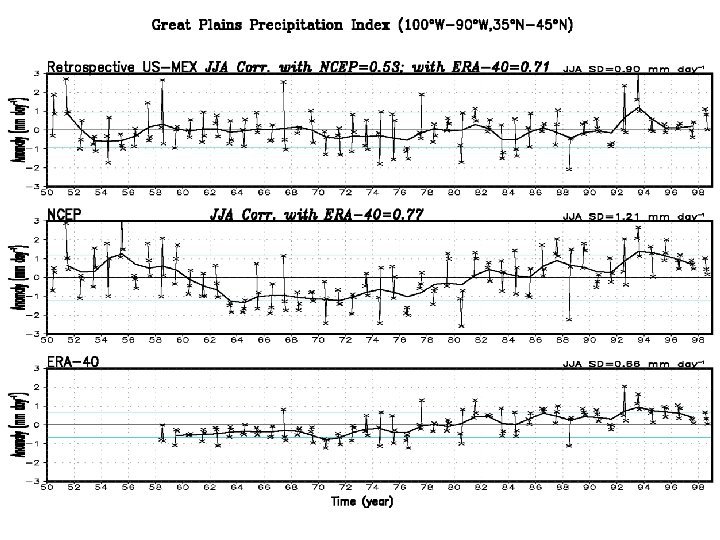
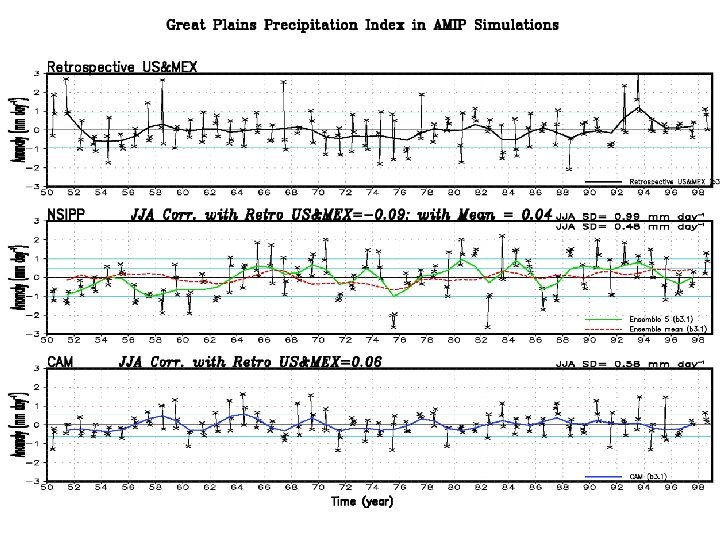
Remarks: Variability • Precipitation: 1) No-reanalysis data sets agree very well. 2) NCEP has larger variability than observations; ERA-40 has reasonably variability but maximum is to the W of the GP. 3) Maximum of STD is shifted to the W in NSIPP and to the E in CAM. • Indices: 1) ERA 40 has larger correlation with noreanalysis indices than NCEP has. 2) Simulations disagree with each other and with verifying noreanalysis observations. 3) Simulations suggest that precip over the GP region is largely of convective nature. However ERA-40 indicates that large-sacle precipitation is equally important!!

REGRESSING INDICES
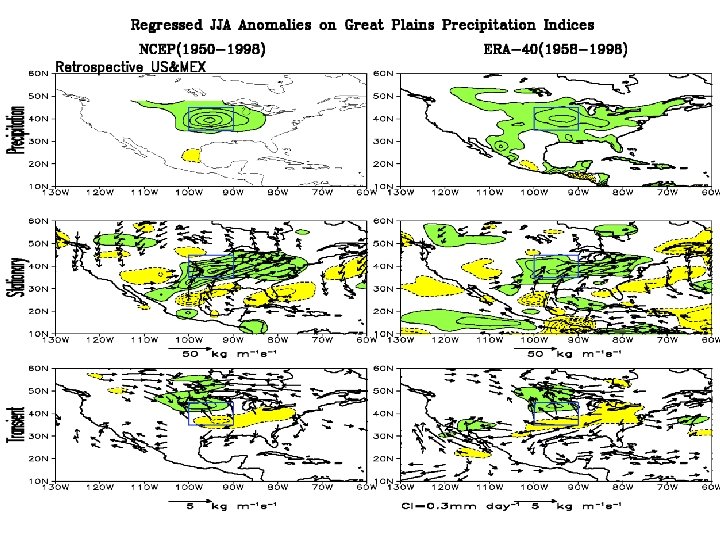
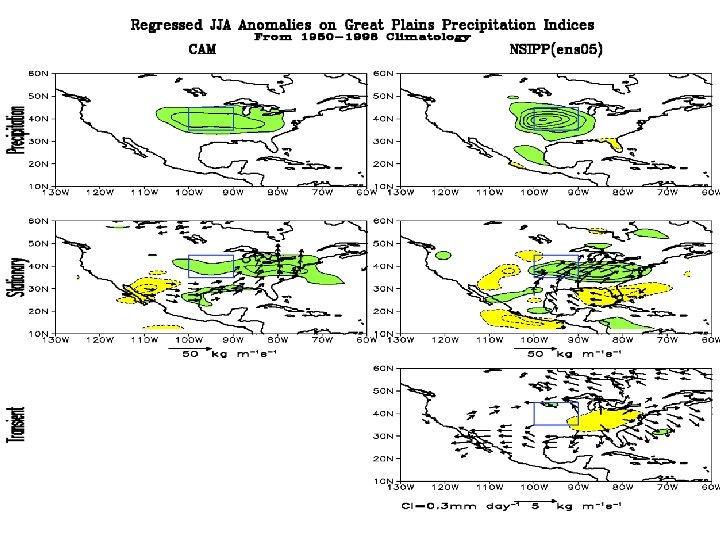
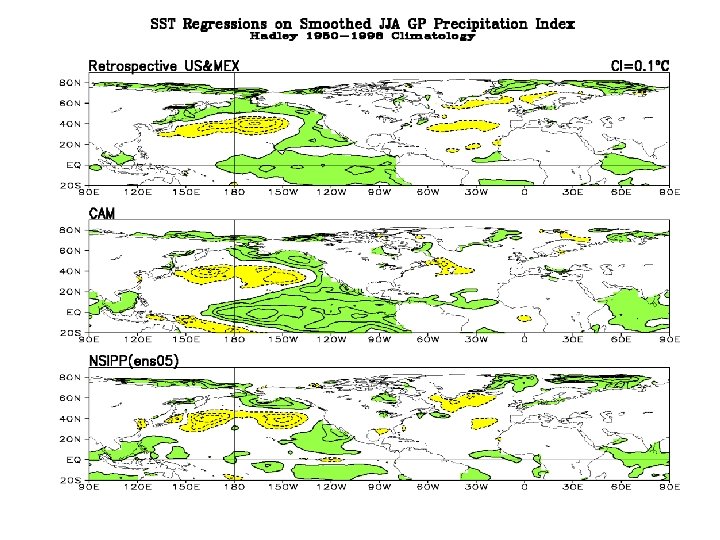
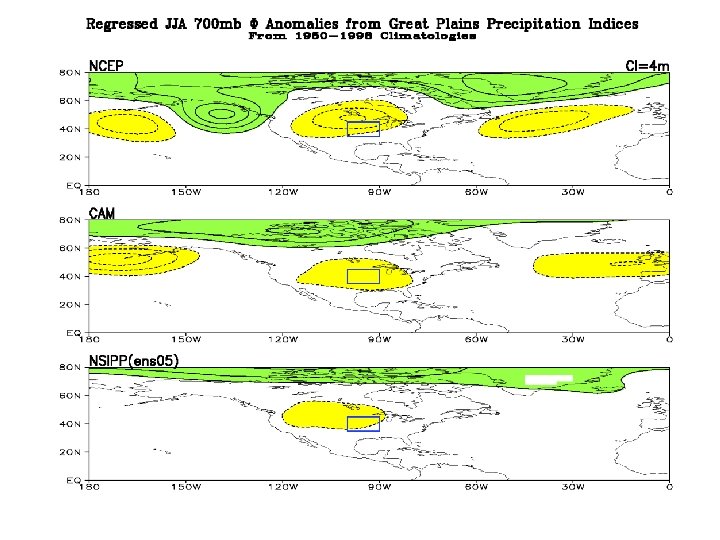

Remarks: Regressions • GP precip anomalies are associated with mean southerly MF from the Gulf of Mexico and Caribbean Sea, as well as mean MFC. Transients enhance precip in the N and reduce it in the S of the region. • Simulations disagree between them, NSIPP is closer to observations but with max of precip to the W of the max of MFC; CAM however shows MF from the Pacific!! • GP precip anomalies are linked to Pacific SSTs in both observations and simulations. • A wave-train with lows over the oceans and central US present in observations is weakly captured in simulations.

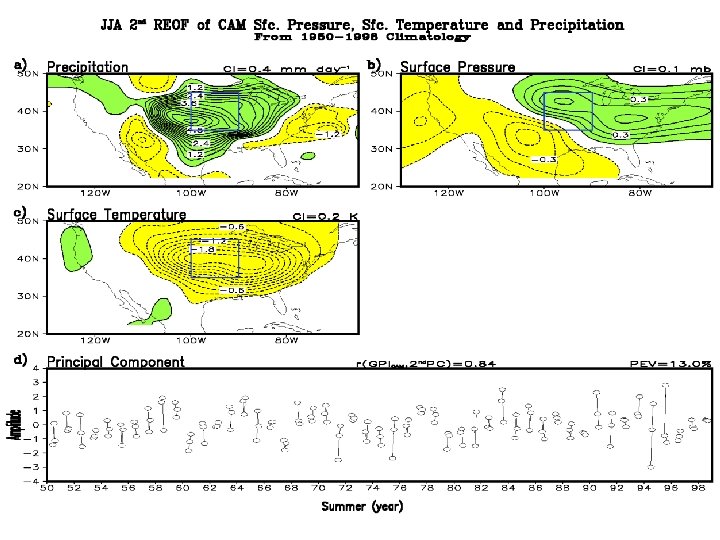
MULTIVARIATE ANALYSIS Precip+Sfc. Tmp+Sfc. Press
")
JJA vs MJJA or JJAS REOF OF SST+ (700)
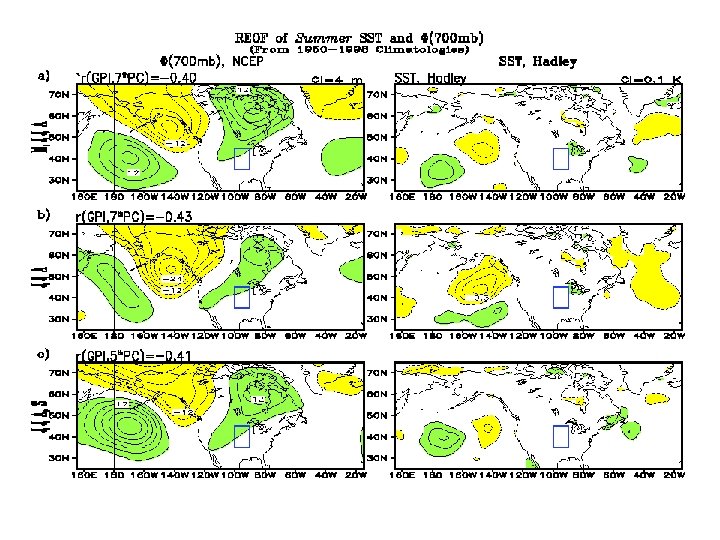

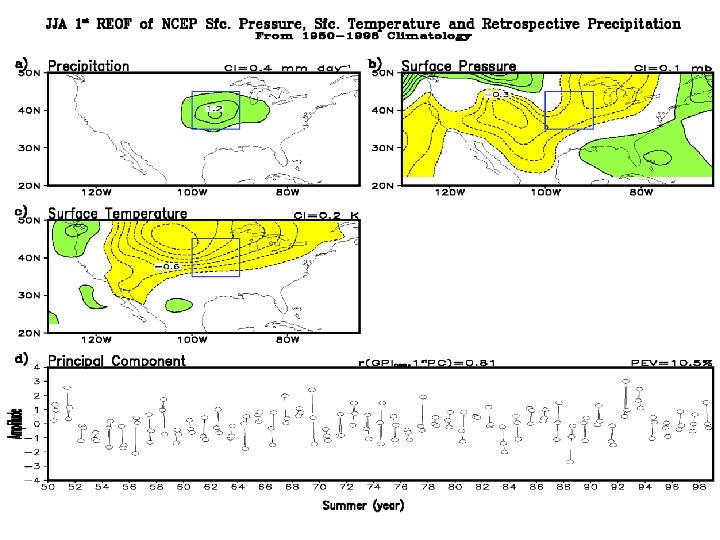
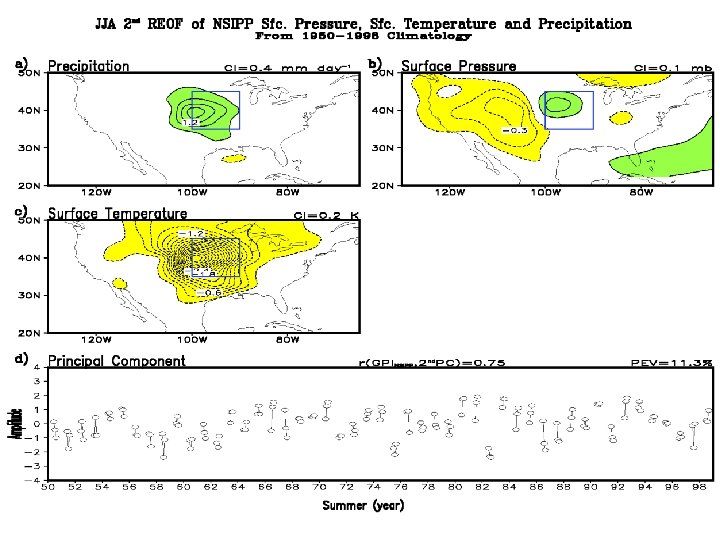
Remarks • Multivariate analysis indicates: – Great Plains precipitation variability is the main mode of summer variability in observations; – This is however not the case in both model simulations; – Wet/dry events are cold/warm events in both observed and simulated summers. – Part of the GP precip variability seems to be forced by the atmosphere. Transition months affect the structure of what is defined as “summer”.
- Slides: 34