
Interactive MultiInstrument Database for Studying Solar Flares Viacheslav
Interactive Multi-Instrument Database for Studying Solar Flares Viacheslav Sadykov, Alexander Kosovichev, Gelu Nita (Department of Physics, NJIT) Rishabh Gupta, Vincent Oria (Department of Computer Sciences, NJIT) Alexander Frolov (High-school student)
OUTLINE • Introduction • Brief look at https: //solarflare. njit. edu/ • Technologies, Sources and Processing: • Background data sources • Daily updated flare catalogs • Merging and inclusion of other sources • Examples of usage • Discussion and Future plans
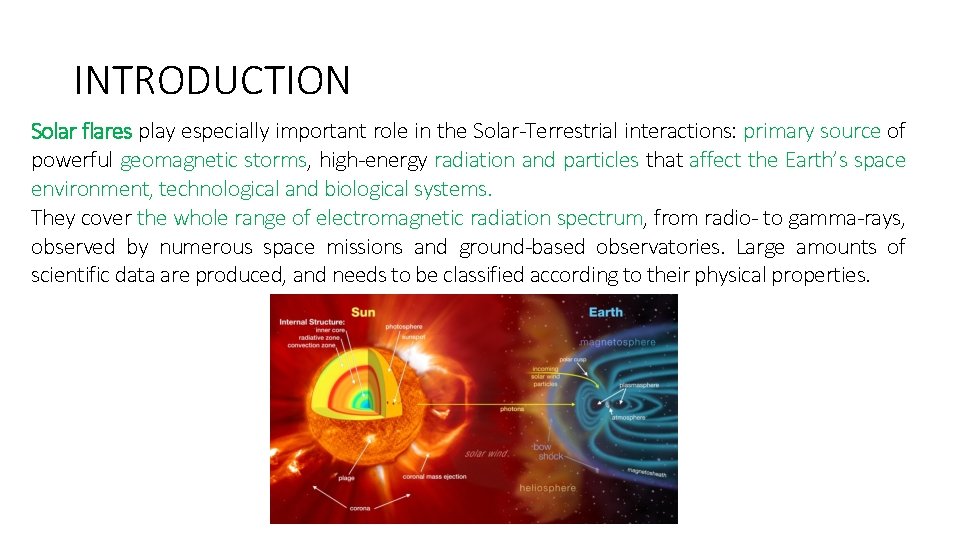
INTRODUCTION Solar flares play especially important role in the Solar-Terrestrial interactions: primary source of powerful geomagnetic storms, high-energy radiation and particles that affect the Earth’s space environment, technological and biological systems. They cover the whole range of electromagnetic radiation spectrum, from radio- to gamma-rays, observed by numerous space missions and ground-based observatories. Large amounts of scientific data are produced, and needs to be classified according to their physical properties.
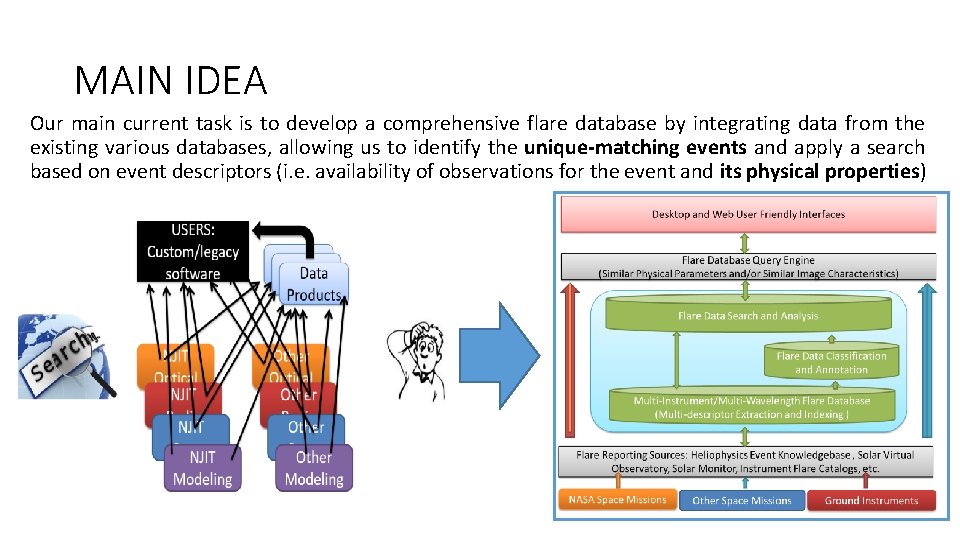
MAIN IDEA Our main current task is to develop a comprehensive flare database by integrating data from the existing various databases, allowing us to identify the unique-matching events and apply a search based on event descriptors (i. e. availability of observations for the event and its physical properties)
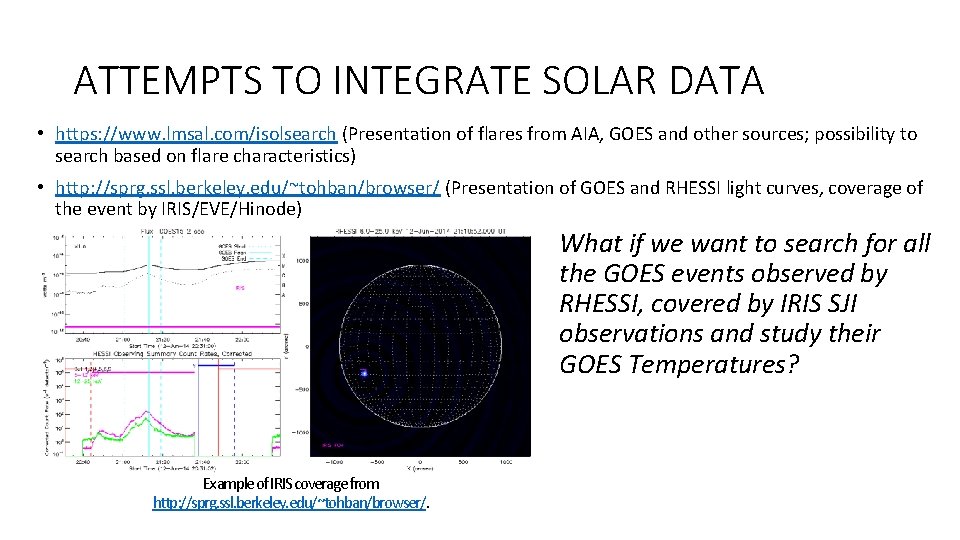
ATTEMPTS TO INTEGRATE SOLAR DATA • https: //www. lmsal. com/isolsearch (Presentation of flares from AIA, GOES and other sources; possibility to search based on flare characteristics) • http: //sprg. ssl. berkeley. edu/~tohban/browser/ (Presentation of GOES and RHESSI light curves, coverage of the event by IRIS/EVE/Hinode) What if we want to search for all the GOES events observed by RHESSI, covered by IRIS SJI observations and study their GOES Temperatures? Example of IRIS coverage from http: //sprg. ssl. berkeley. edu/~tohban/browser/.
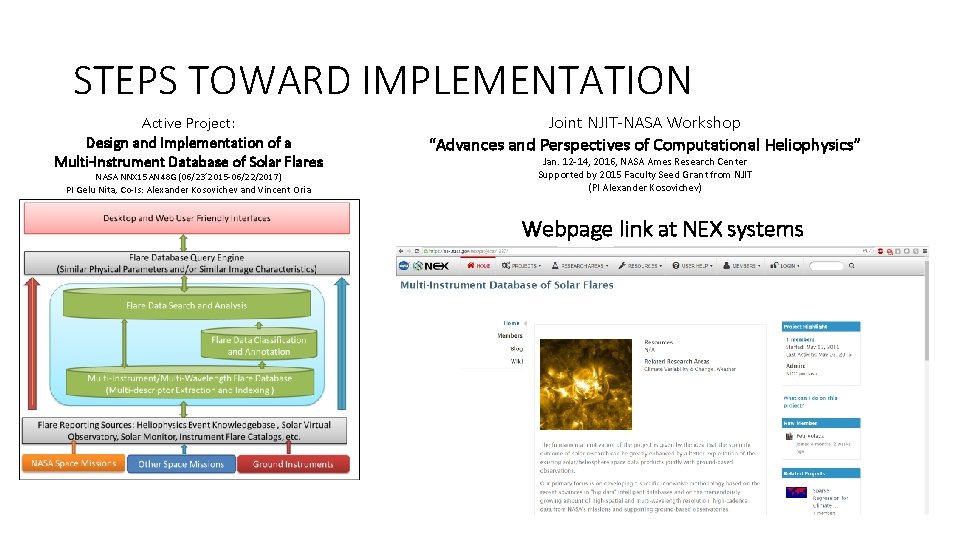
STEPS TOWARD IMPLEMENTATION Active Project: Design and Implementation of a Multi-Instrument Database of Solar Flares NASA NNX 15 AN 48 G (06/23’ 2015 -06/22/2017) PI Gelu Nita, Co-Is: Alexander Kosovichev and Vincent Oria Joint NJIT-NASA Workshop “Advances and Perspectives of Computational Heliophysics” Jan. 12 -14, 2016, NASA Ames Research Center Supported by 2015 Faculty Seed Grant from NJIT (PI Alexander Kosovichev) Webpage link at NEX systems
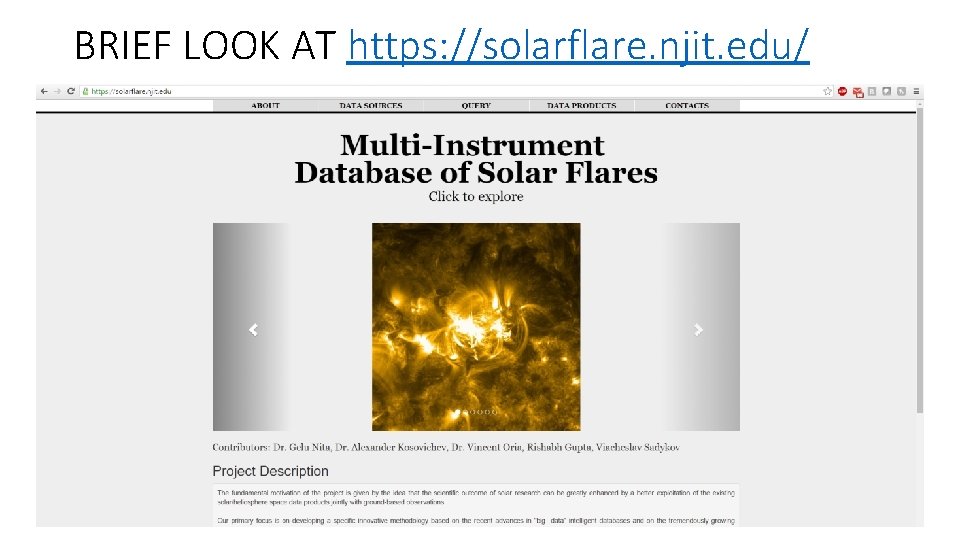
BRIEF LOOK AT https: //solarflare. njit. edu/
TECHNOLOGIES • • • Website (https: //solarflare. njit. edu/): hosted on NJIT’s AFS machine. Database Management System: MYSQL (Relational). Separate database tables created for every flare catalog or background data source. Indexing is applied to speed up querying Scripting: PHP and Python. Scripts are used for downloading the data, processing the downloaded files, insertion of them into the database and database querying Visualization: Google Charts. The Google charts are used to create plots and integrate them into the website Front end: HTML/CSS and Java. Script.
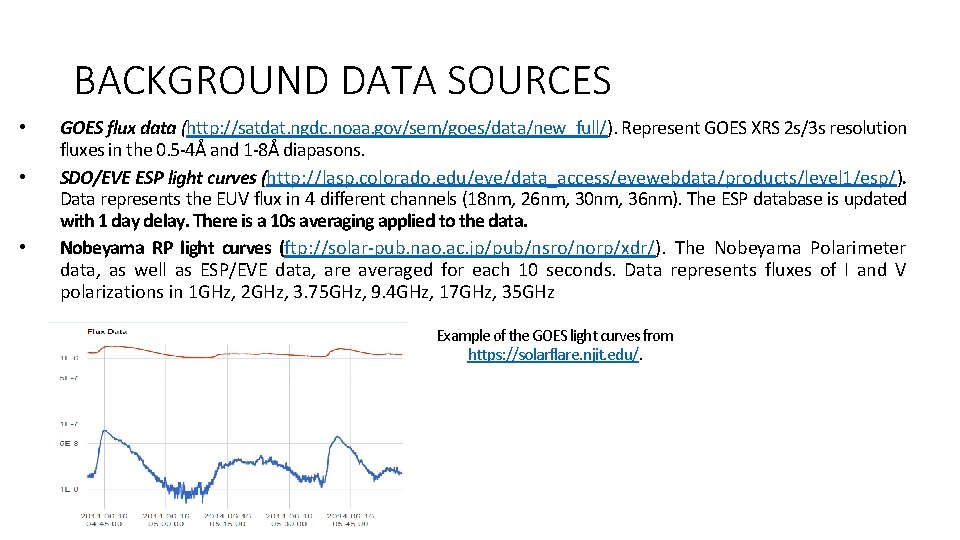
BACKGROUND DATA SOURCES • • • GOES flux data (http: //satdat. ngdc. noaa. gov/sem/goes/data/new_full/). Represent GOES XRS 2 s/3 s resolution fluxes in the 0. 5 -4Å and 1 -8Å diapasons. SDO/EVE ESP light curves (http: //lasp. colorado. edu/eve/data_access/evewebdata/products/level 1/esp/). Data represents the EUV flux in 4 different channels (18 nm, 26 nm, 30 nm, 36 nm). The ESP database is updated with 1 day delay. There is a 10 s averaging applied to the data. Nobeyama RP light curves (ftp: //solar-pub. nao. ac. jp/pub/nsro/norp/xdr/). The Nobeyama Polarimeter data, as well as ESP/EVE data, are averaged for each 10 seconds. Data represents fluxes of I and V polarizations in 1 GHz, 2 GHz, 3. 75 GHz, 9. 4 GHz, 17 GHz, 35 GHz Example of the GOES light curves from https: //solarflare. njit. edu/.
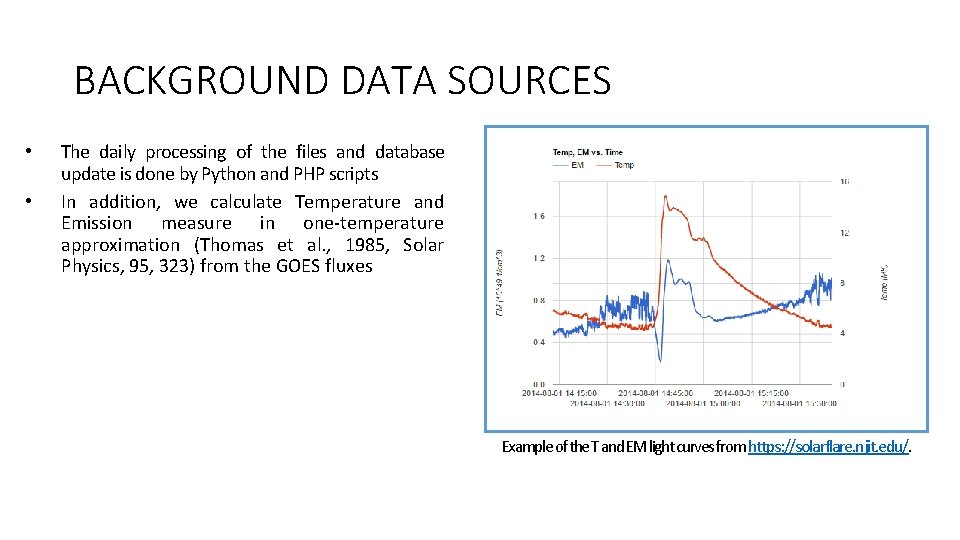
BACKGROUND DATA SOURCES • • The daily processing of the files and database update is done by Python and PHP scripts In addition, we calculate Temperature and Emission measure in one-temperature approximation (Thomas et al. , 1985, Solar Physics, 95, 323) from the GOES fluxes Example of the T and EM light curves from https: //solarflare. njit. edu/.
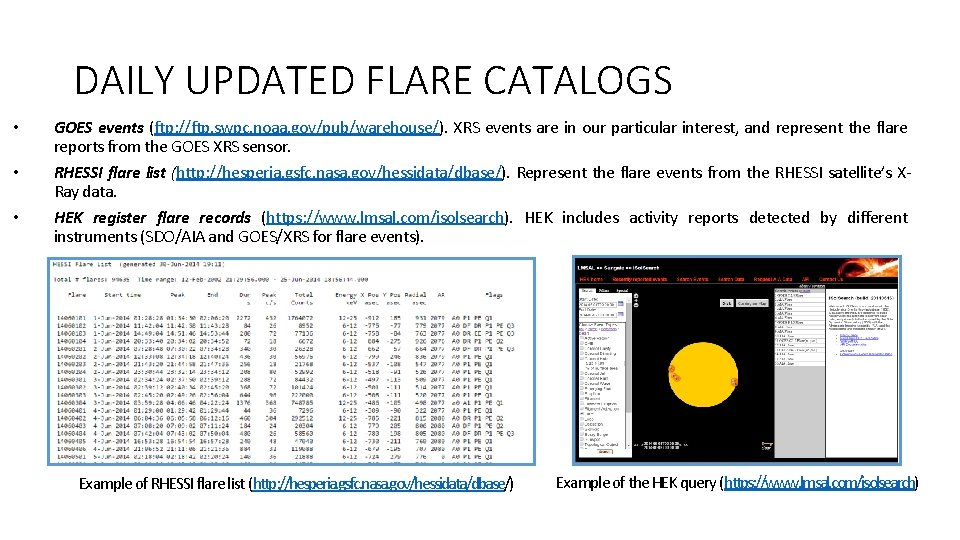
DAILY UPDATED FLARE CATALOGS • • • GOES events (ftp: //ftp. swpc. noaa. gov/pub/warehouse/). XRS events are in our particular interest, and represent the flare reports from the GOES XRS sensor. RHESSI flare list (http: //hesperia. gsfc. nasa. gov/hessidata/dbase/). Represent the flare events from the RHESSI satellite’s XRay data. HEK register flare records (https: //www. lmsal. com/isolsearch). HEK includes activity reports detected by different instruments (SDO/AIA and GOES/XRS for flare events). Example of RHESSI flare list (http: //hesperia. gsfc. nasa. gov/hessidata/dbase/) Example of the HEK query (https: //www. lmsal. com/isolsearch)
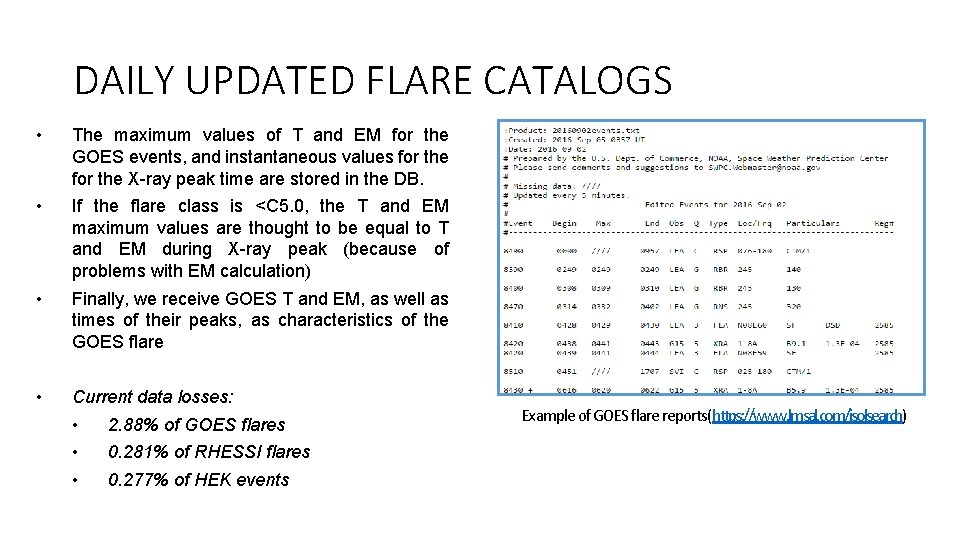
DAILY UPDATED FLARE CATALOGS • The maximum values of T and EM for the GOES events, and instantaneous values for the X-ray peak time are stored in the DB. • If the flare class is <C 5. 0, the T and EM maximum values are thought to be equal to T and EM during X-ray peak (because of problems with EM calculation) • Finally, we receive GOES T and EM, as well as times of their peaks, as characteristics of the GOES flare • Current data losses: • • • 2. 88% of GOES flares 0. 281% of RHESSI flares 0. 277% of HEK events Example of GOES flare reports(https: //www. lmsal. com/isolsearch)
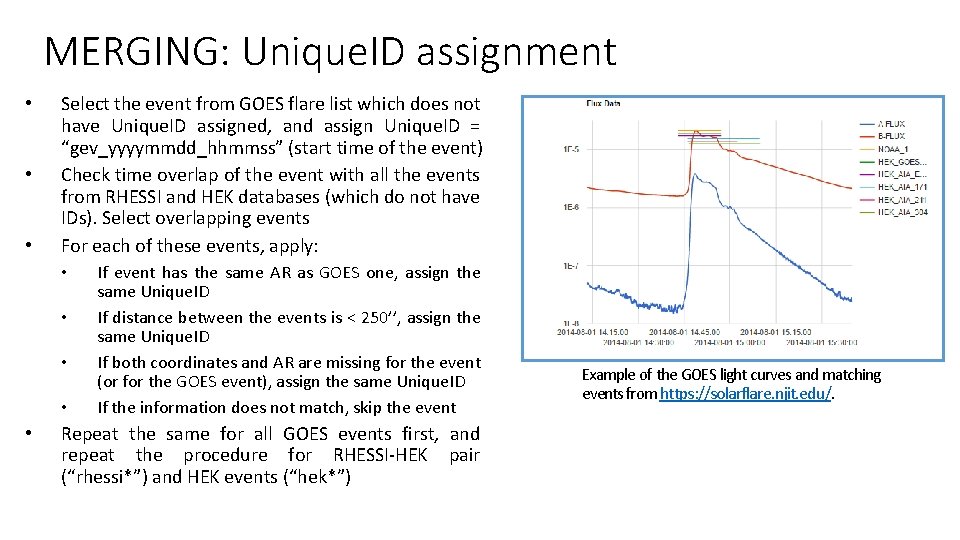
MERGING: Unique. ID assignment • • • Select the event from GOES flare list which does not have Unique. ID assigned, and assign Unique. ID = “gev_yyyymmdd_hhmmss” (start time of the event) Check time overlap of the event with all the events from RHESSI and HEK databases (which do not have IDs). Select overlapping events For each of these events, apply: • • • If event has the same AR as GOES one, assign the same Unique. ID If distance between the events is < 250’’, assign the same Unique. ID If both coordinates and AR are missing for the event (or for the GOES event), assign the same Unique. ID If the information does not match, skip the event Repeat the same for all GOES events first, and repeat the procedure for RHESSI-HEK pair (“rhessi*”) and HEK events (“hek*”) Example of the GOES light curves and matching events from https: //solarflare. njit. edu/.
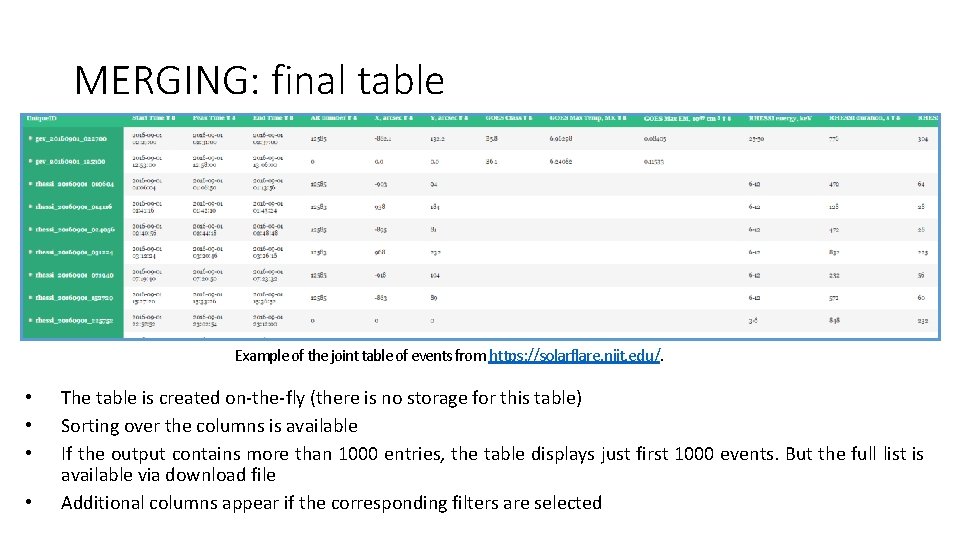
MERGING: final table Example of the joint table of events from https: //solarflare. njit. edu/. • • The table is created on-the-fly (there is no storage for this table) Sorting over the columns is available If the output contains more than 1000 entries, the table displays just first 1000 events. But the full list is available via download file Additional columns appear if the corresponding filters are selected
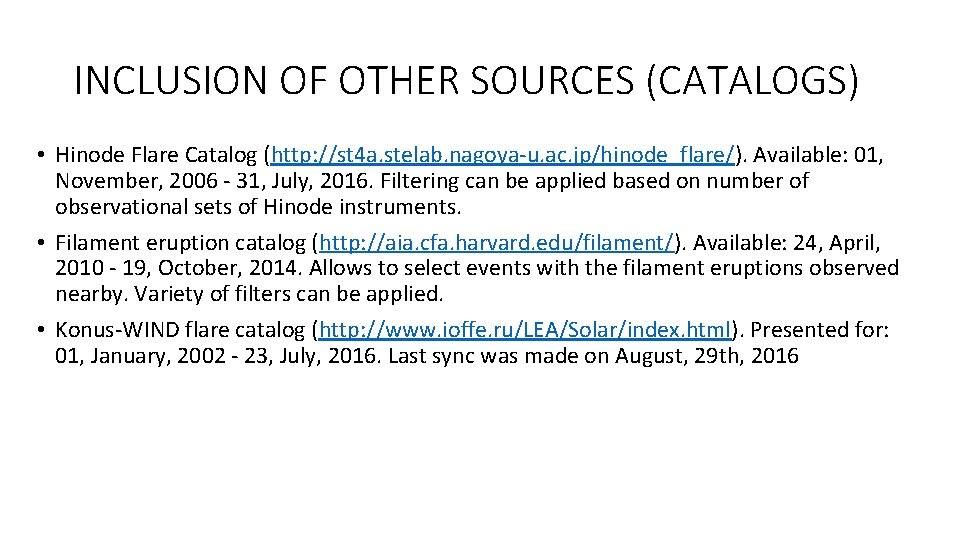
INCLUSION OF OTHER SOURCES (CATALOGS) • Hinode Flare Catalog (http: //st 4 a. stelab. nagoya-u. ac. jp/hinode_flare/). Available: 01, November, 2006 - 31, July, 2016. Filtering can be applied based on number of observational sets of Hinode instruments. • Filament eruption catalog (http: //aia. cfa. harvard. edu/filament/). Available: 24, April, 2010 - 19, October, 2014. Allows to select events with the filament eruptions observed nearby. Variety of filters can be applied. • Konus-WIND flare catalog (http: //www. ioffe. ru/LEA/Solar/index. html). Presented for: 01, January, 2002 - 23, July, 2016. Last sync was made on August, 29 th, 2016
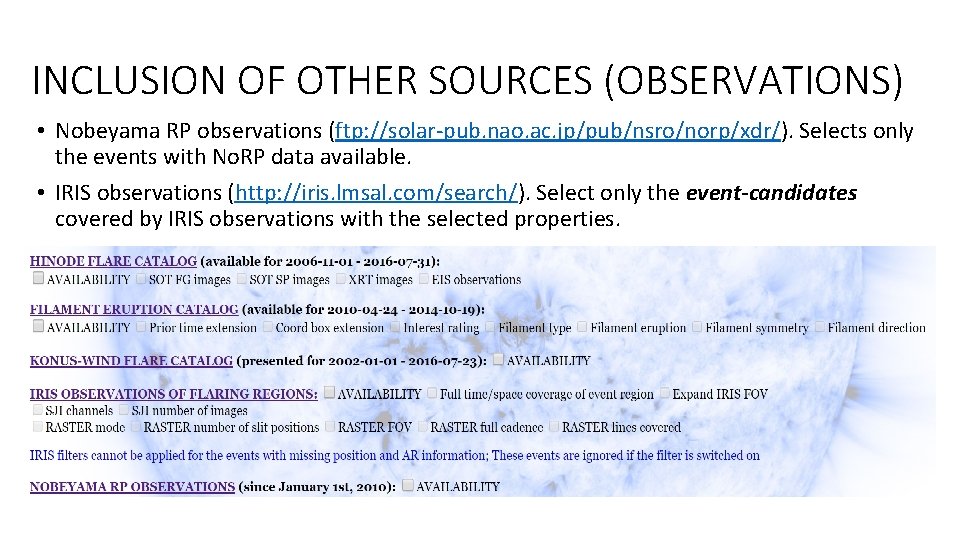
INCLUSION OF OTHER SOURCES (OBSERVATIONS) • Nobeyama RP observations (ftp: //solar-pub. nao. ac. jp/pub/nsro/norp/xdr/). Selects only the events with No. RP data available. • IRIS observations (http: //iris. lmsal. com/search/). Select only the event-candidates covered by IRIS observations with the selected properties.
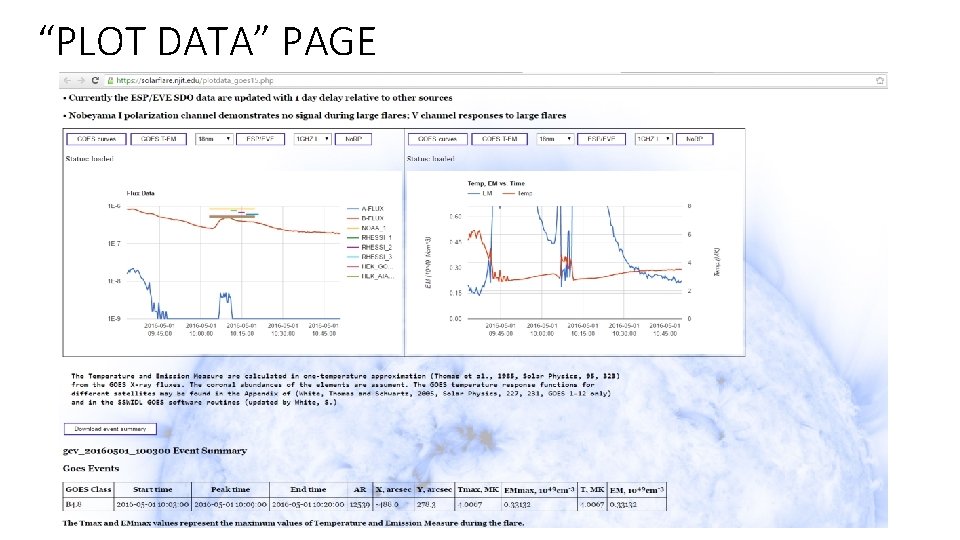
“PLOT DATA” PAGE
SUMMARY Currently implemented: • Web application. The technologies include the usage of My. SQL, PHP, Python, Google Charts, and the HTML/CSS and Java. Script. • Three main daily-updated sources of flare reports (GOES events list, RHESSI flare list, Heliophysics Event Knowledgebase Flares), and three additional catalogs (Hinode flares, Filament eruption catalog, Konus-WIND flares) • Check of coverage by No. RP and IRIS instruments • Integration of data from the selected catalogs with application of the selected filters • Possibility to download the result of the query • Plots of GOES X-ray data, T and EM, ESP/EVE data, No. RP data for the selected event.
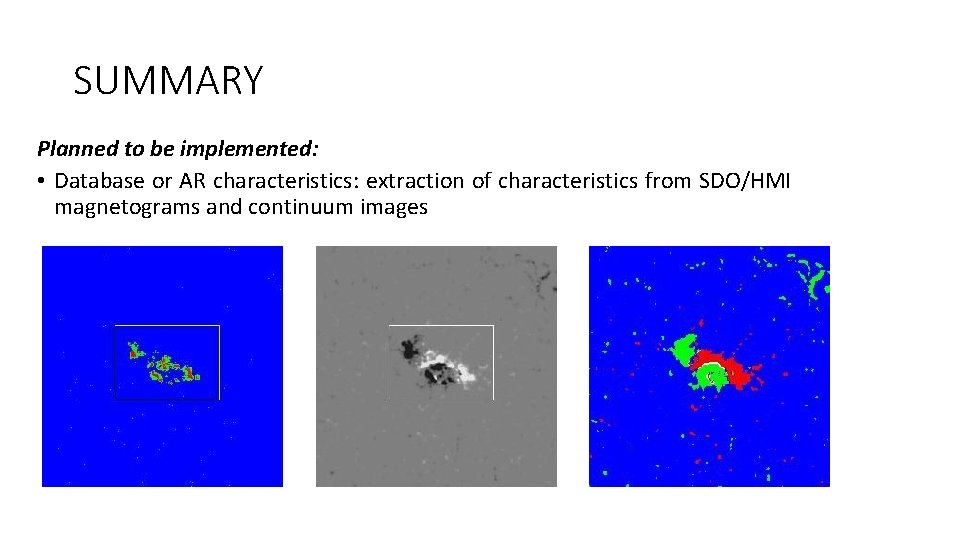
SUMMARY Planned to be implemented: • Database or AR characteristics: extraction of characteristics from SDO/HMI magnetograms and continuum images
QUESTIONS TO ANSWER Minor: • • Data overcheck (search of missing events and neighborhood Unique. ID reassignments) More stable daily updates (currently: large log files) Autocomplete of missing position information Stability of the system Major: • Inclusion of event recognition from data (Sasha Frolov, high-school student) • Semantic input text analysis for automatic query construction (Rishabh Gupta, CS student) • Inclusion of additional sources

Thank you for your attention!
- Slides: 21