
Interactive Animation of Cities over Time Paul C
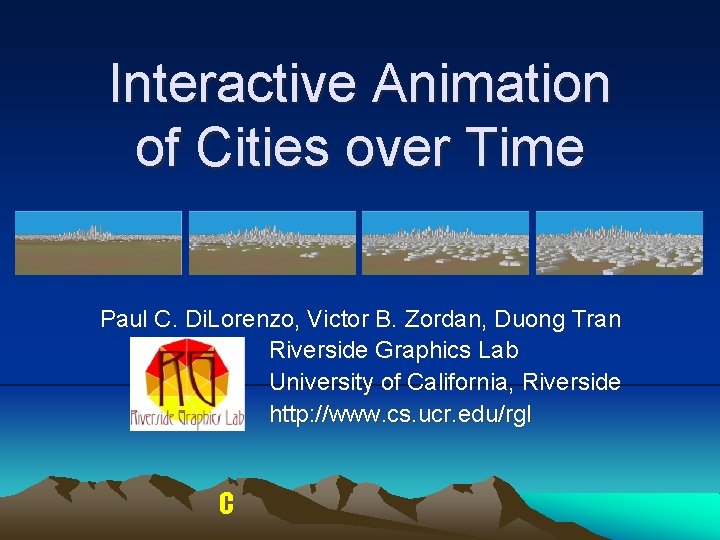
- Slides: 38
Interactive Animation of Cities over Time Paul C. Di. Lorenzo, Victor B. Zordan, Duong Tran Riverside Graphics Lab University of California, Riverside http: //www. cs. ucr. edu/rgl C
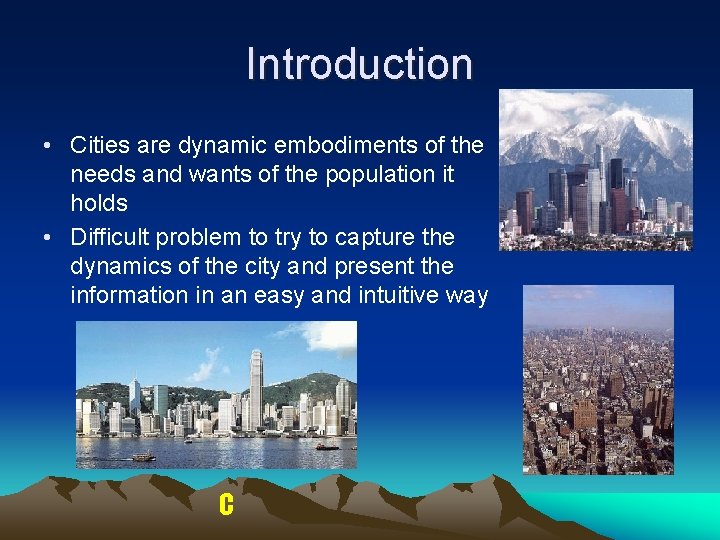
Introduction • Cities are dynamic embodiments of the needs and wants of the population it holds • Difficult problem to try to capture the dynamics of the city and present the information in an easy and intuitive way C
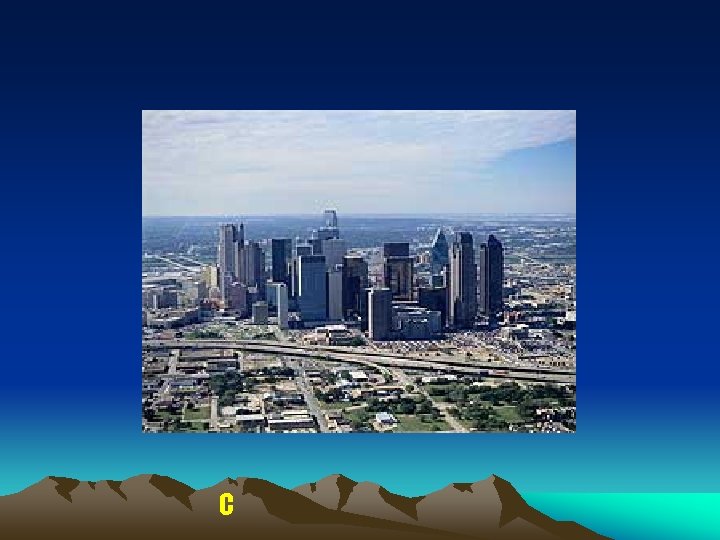
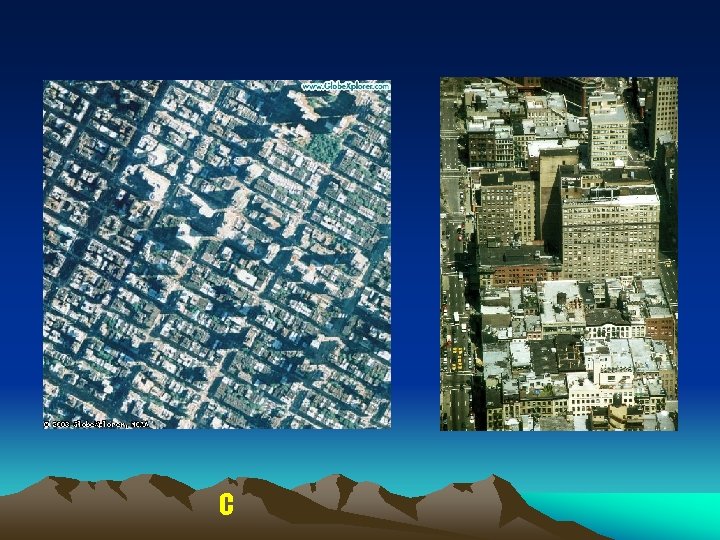
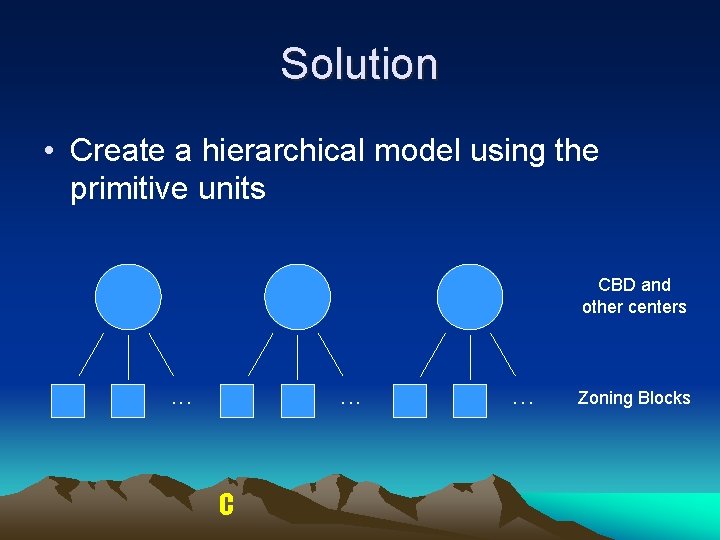
Parts of a City • Break down the city into primitive units – Central Business District (CBD) • Economic heart of the city • Mostly commercial buildings in this area • Usually, have the tallest buildings – Zoning Blocks • City block, or larger, area • Area assigned a zone type based on a city plan – Residential, Commercial, municipal, and so on C
C
Parts of a City • Break down the city into primitive units – Central Business District (CBD) • Economic heart of the city • Mostly commercial buildings in this area • Usually, have the tallest buildings – Zoning Blocks • City block, or larger, area • Area assigned a zone type based on a city plan – Residential, Commercial, municipal, and so on C
C
Background Computer Graphics • Cities – Capture data; Teller et al. • http: //city. lcs. mit. edu/city. html Hand modeled; Hamill and O’Sullivan, 2003 – – Procedural; Parish and Müller; 2001 • Building architecture – 3 D models with photographs • Jepson et al, 1995; Debevec et al, 1996; Ribarsky et al, 2002 – Instant Architecture – Heuristic rules plus procedural grammar; Wonka et al, 2003 • None of these efforts address the evolution of a city! C
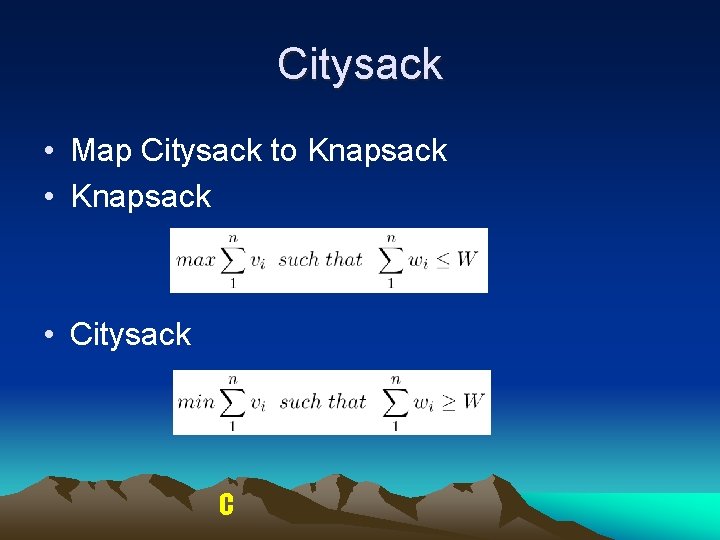
Problem Statement • Animation – Two point boundary problem that only manipulates the primitive units • Solve using Citysack – Similar to the thief’s Knapsack problem C
Goals • Recreate the look and feel of a city growing, or decaying, over time • Sociologically based • Interactive • Minimize the amount of inputs for the user C
Applications • Urban development and sociology – Play what-ifs – Determine what factors affect the growth and development of their synthesized city • Computer games and entertainment – Evolving cities C
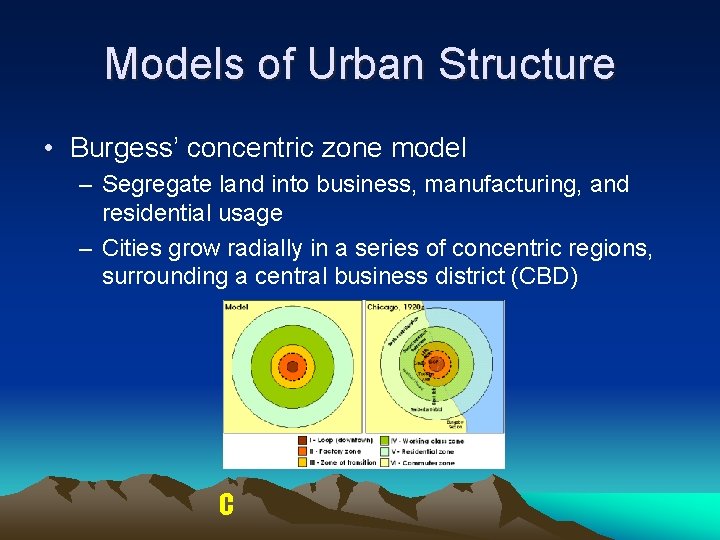
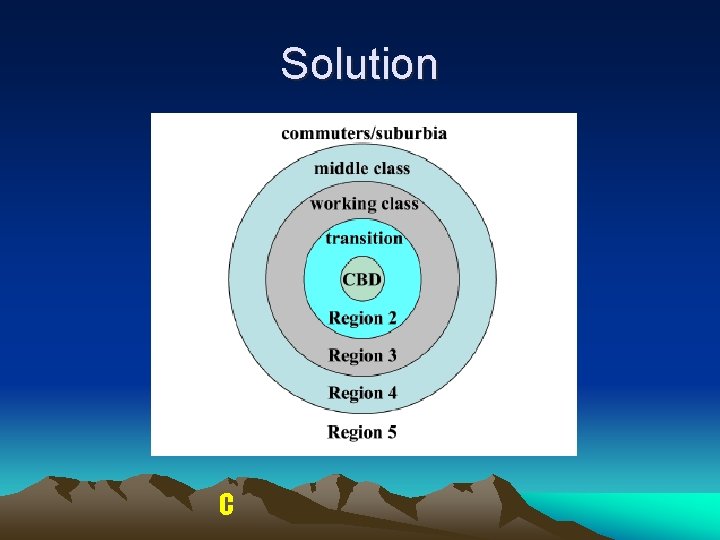
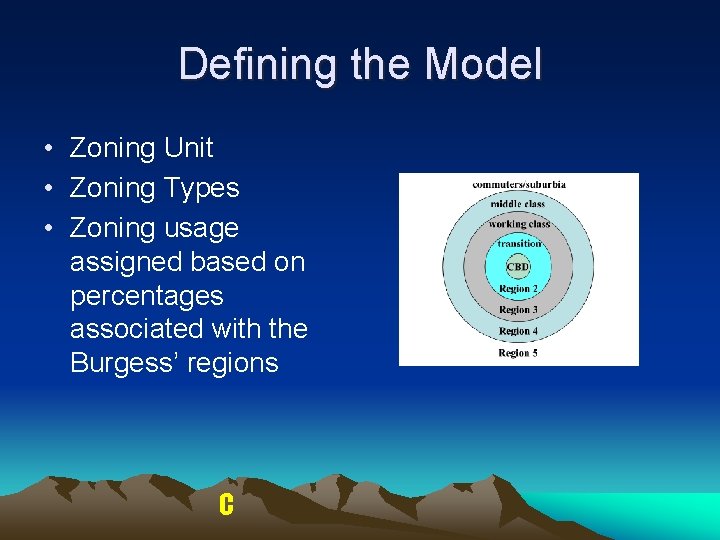
Models of Urban Structure • Burgess’ concentric zone model – Segregate land into business, manufacturing, and residential usage – Cities grow radially in a series of concentric regions, surrounding a central business district (CBD) C
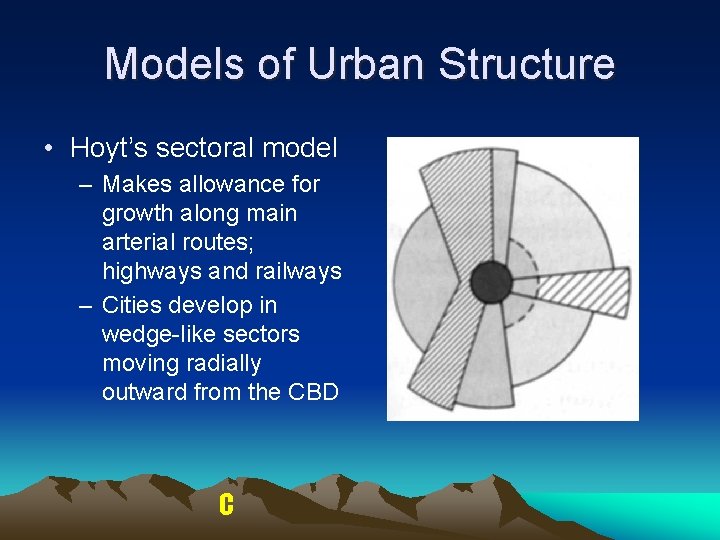
Models of Urban Structure • Hoyt’s sectoral model – Makes allowance for growth along main arterial routes; highways and railways – Cities develop in wedge-like sectors moving radially outward from the CBD C
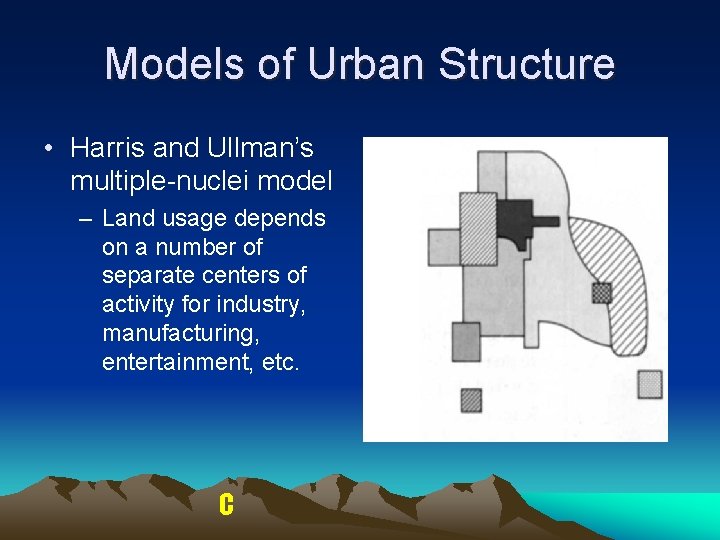
Models of Urban Structure • Harris and Ullman’s multiple-nuclei model – Land usage depends on a number of separate centers of activity for industry, manufacturing, entertainment, etc. C
Solution C
Solution • Create a hierarchical model using the primitive units CBD and other centers . . . C . . . Zoning Blocks
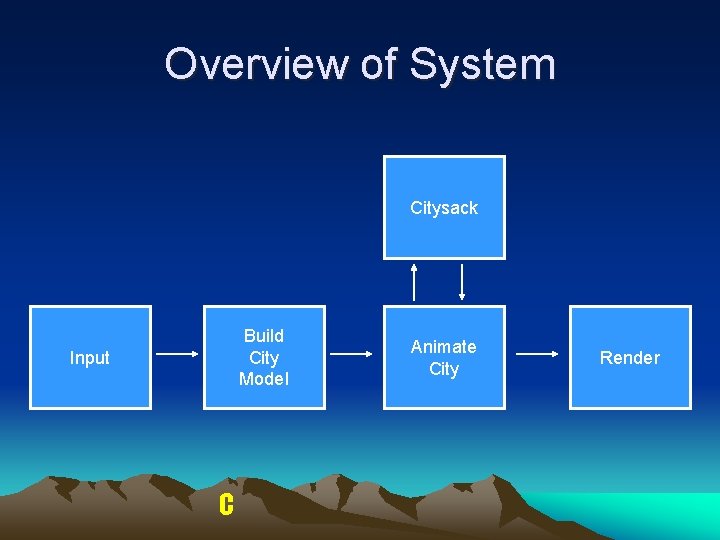
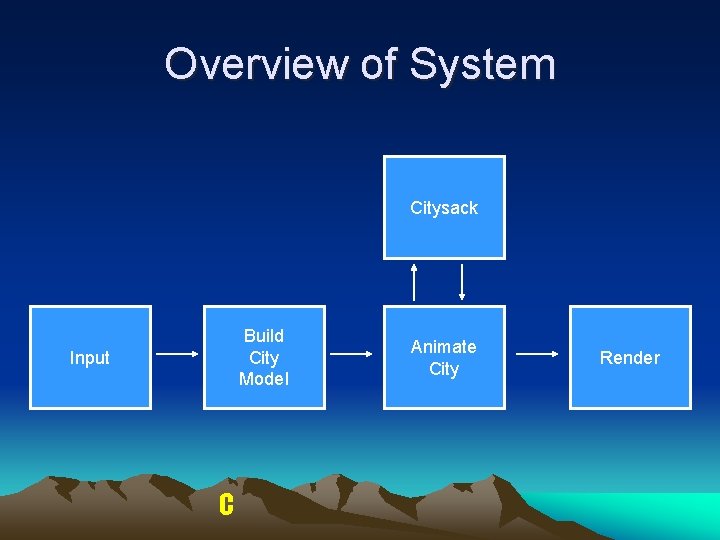
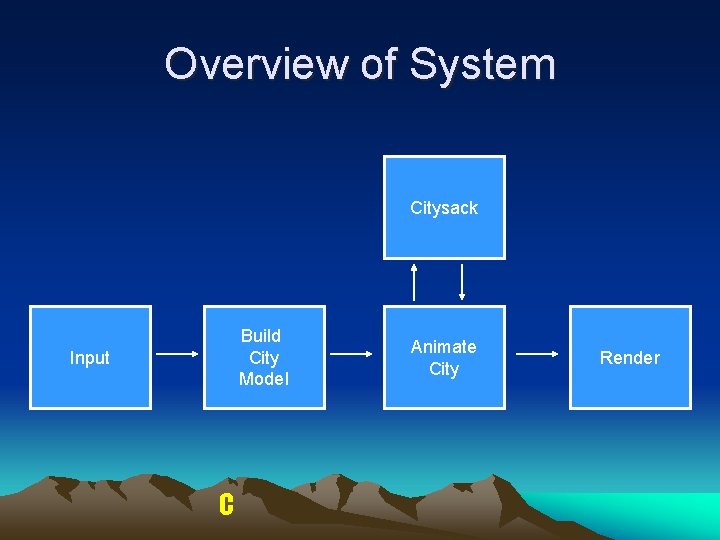
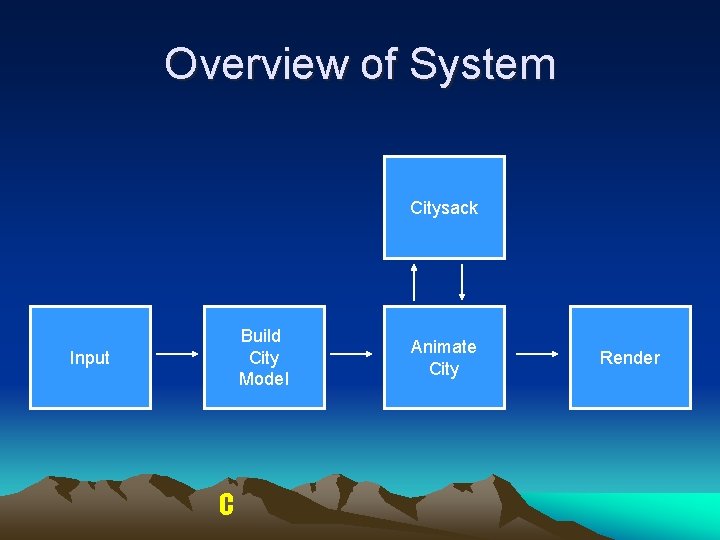
Overview of System Citysack Build City Model Input C Animate City Render
Overview of System Citysack Build City Model Input C Animate City Render
Defining the Model • Zoning Unit • Zoning Types • Zoning usage assigned based on percentages associated with the Burgess’ regions C
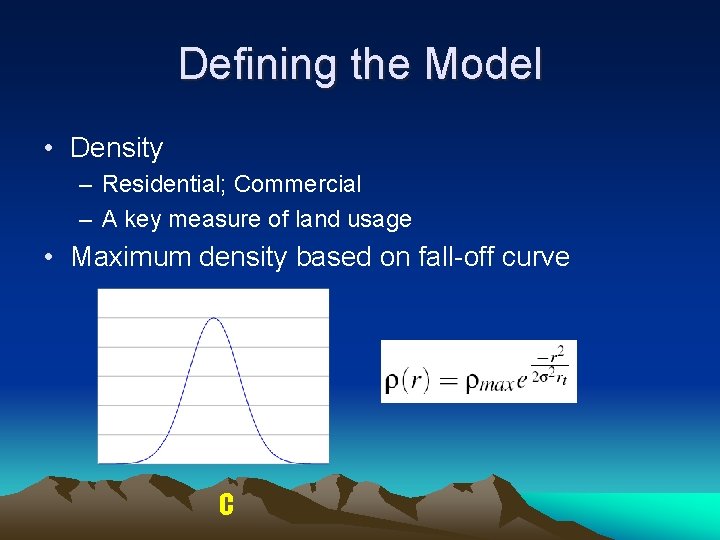
Defining the Model • Density – Residential; Commercial – A key measure of land usage • Maximum density based on fall-off curve C
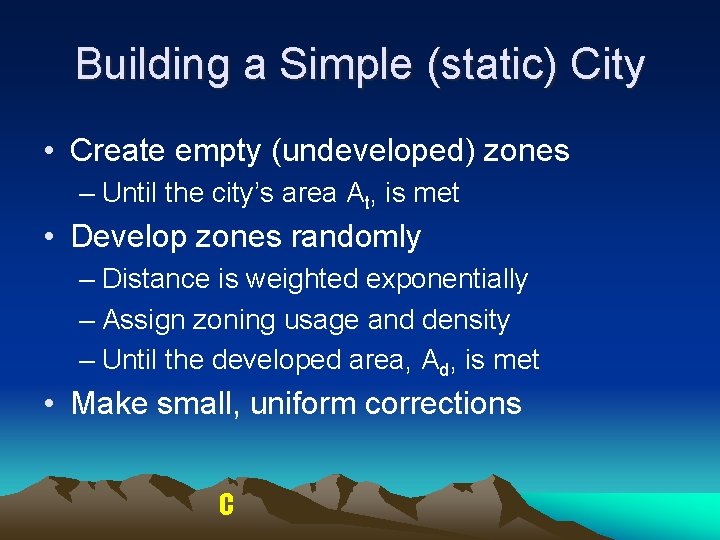
Building a Simple (static) City • Create empty (undeveloped) zones – Until the city’s area At, is met • Develop zones randomly – Distance is weighted exponentially – Assign zoning usage and density – Until the developed area, Ad, is met • Make small, uniform corrections C
Demo C
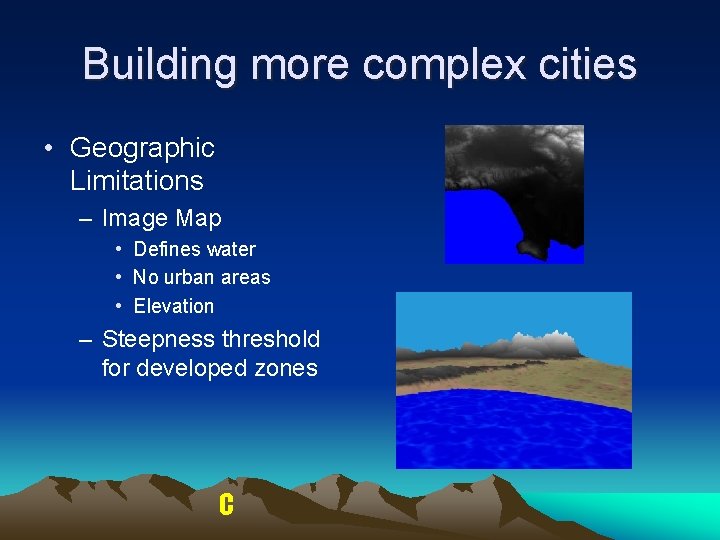
Building more complex cities • Geographic Limitations – Image Map • Defines water • No urban areas • Elevation – Steepness threshold for developed zones C
Building more complex cities • Multiple Centers – Assign maximum densities, relative rates of growth, and unique orientations – Zoning unit’s maximum density is the largest maximum density of all centers C
Demo C
Overview of System Citysack Build City Model Input C Animate City Render
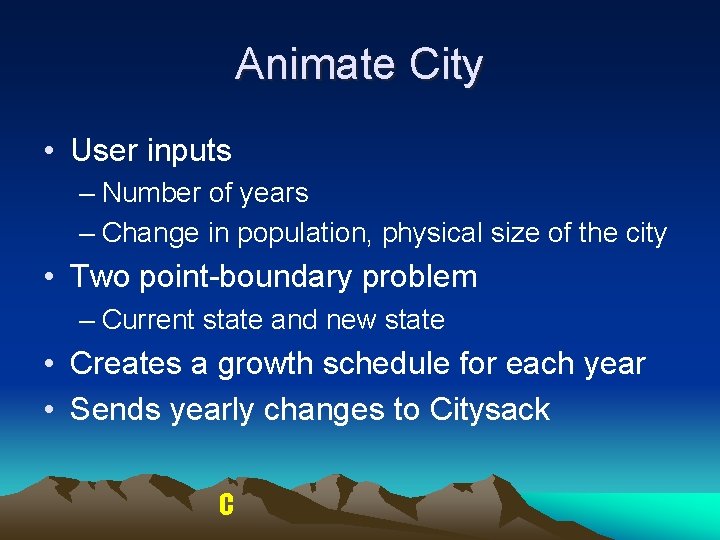
Animate City • User inputs – Number of years – Change in population, physical size of the city • Two point-boundary problem – Current state and new state • Creates a growth schedule for each year • Sends yearly changes to Citysack C
Citysack • Map Citysack to Knapsack • Knapsack • Citysack C
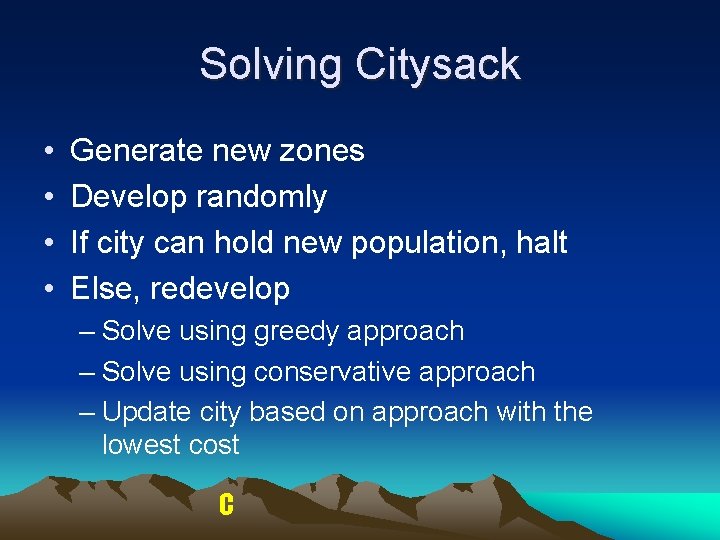
Solving Citysack • • Generate new zones Develop randomly If city can hold new population, halt Else, redevelop – Solve using greedy approach – Solve using conservative approach – Update city based on approach with the lowest cost C
Demo C
Overview of System Citysack Build City Model Input C Animate City Render
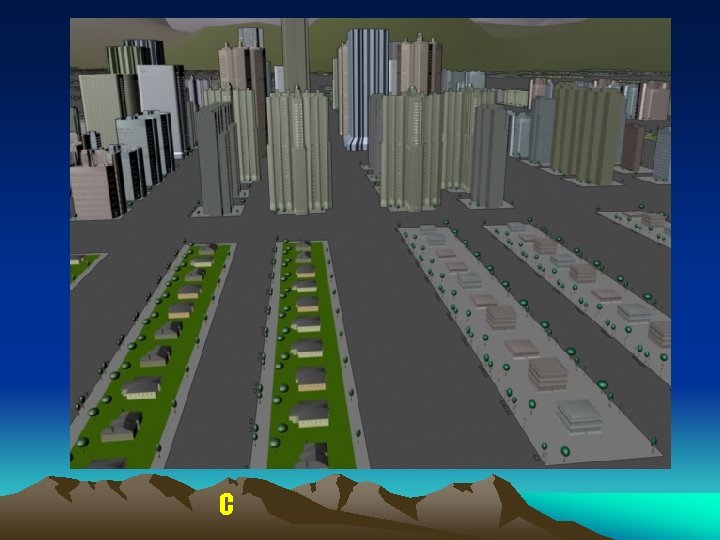
Rendering • Zones decomposed – density and zone type • Height and number of buildings C
Demo C
Rendering • Replaced buildings with commercial libraries • Use zoning units to describe more about the city – Combine multiple zones • Large parks – Break down zones • Buildings • Houses • Trees C
C
Conclusion • Reduce city to primitive units • Build city using these primitive units • Simplify animating the city by adjusting the zoning blocks – Solve with a well known algorithm C
Future Work • Add roads – Main transportation networks • Hoyt’s sectoral model – Inner roads • Visual appeal – People, traffic, etc… • Added factors – Fire damage, demolition, vandalism C
Thank you!!! C
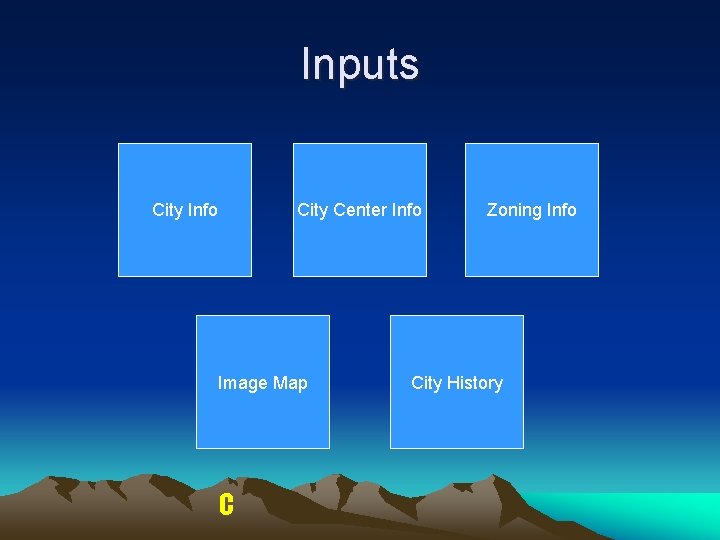
Inputs City Info City Center Info Image Map C Zoning Info City History