Intelligent Detection of Malicious Script Code CS 194


- Slides: 65
Intelligent Detection of Malicious Script Code CS 194, 2007 -08 Benson Luk Eyal Reuveni Kamron Farrokh Advisor: Adnan Darwiche Sponsored by Symantec
Outline for Project Phase I : Setup n n Set up machine for testing environment Ensure that “whitelist” is clean Phase II : Crawling n Modify crawler to output only necessary data. This means: • Grab only necessary information from webcrawling results • Listen into Internet Explorer’s Javascript interpreter and output relevant behavior Phase III: Database Research and develop an effective structure for storing data and link it to webcrawler n Phase IV: Analysis Research trends for normalcy and investigate possible heuristics n
Approach to Project First Quarter : Infrastructure Second Quarter : Data Gathering Third Quarter : Data Analysis (Note: some overlap between quarters)
Infrastructure Internet Explorer 7, Windows XP SP 2 Professional n • Main testing environment n Norton Antivirus • Protects against malicious files and scripts • Can access logs to determine which sites launched attacks • Integrated into automated site visiting
Infrastructure n Canary. Callback. dll • Plugin into Internet Explorer • Able to access most data received by low-level Javascript interpreter n n n The function being called (DISPID) The class that the function belongs to (GUID) The list of types and values of parameters passed into the function. Examples: • VT_I 4: 4 -byte integer • VT_BSTR: Byte string • VT_DISPATCH: Object • Large part of first and second quarter was spent programming, debugging, and maintaining the functions that would handle the data n n n Functions to grab data type Functions to parse data values (some stored in bitstreams) Functions to output data to file • If types did not have an obvious output format (i. e. VT_DISPATCH), we had to create one that would accurately represent as many components of the data as possible
Infrastructure n Python • Scripting language • Designed to handle parsing with ease • Script for infrastructure was used to perform three tasks: n n Launch Internet Explorer (uses the c. PAMIE engine), load website, then close Internet Explorer Access and parse Norton’s web attack logs for any attacks launched by website Sort script data from Canary. Callback DLL based on DLL data and attack logs (Was there an attack? Did any scripts run? Etc. ) Heretrix • Open-source webcrawler with high customizability • Can run specific crawls that target a set of domains, and output minimal information • Uses HTTP requests; does not render crawled sites • The purpose is to gather as many URLs with scripts as possible for a large sample base
Infrastructure: Crawler Step 0: URL queue is “seeded” with domain list URL queue Step 3: Append URLs to log data and URL queue iff they satisfy our set of rules Heretrix raw data Step 4: Get rid of excess data, leaving only URL information for each site, and output to new file Step 1: Grab URL from queue Crawler Python parser Step 2: Grab source from URL WWW Heretrix parsed data Repeat steps 1 -4 until crawl limit is reached.
Infrastructure: Gatherer Norton Antivirus: Step 5: Python analyzes callback data and logs to decide whether a site is clean, dirty, or has no scripts Logs Norton Antivirus: Python controller Step 4: IE 7 informs PAMIE that it is finished; Python kills IE 7 Step 1: Python script grabs site from crawl data Heretrix parsed data Step 6: Python outputs sorted and formatted data to relevant files for future analysis Step 2: c. PAMIE component loads IE and sends it to specified site Formatted output Repeat steps 1 -6 until URL list is exhausted. Canary. Callback data Step 3: IE 7 Javascript interpreter outputs to file containing all DLL data Internet Explorer 7
Data gathering n Heretrix crawls • First crawl: 5 seeds, depth 5 n 5 million sites found • Second crawl: 10 seeds, depth 3 n 3 million sites found • Third crawl: 200 seeds, depth 1 n 18, 500 sites found • Fourth crawl: 200 seeds, depth 2 n 3 million sites found • First two crawls produced data that was biased towards large, interlinked sites; the last two broad crawls were run to remedy this. n Canary. Callback gathering • For first and second crawls, a chosen set of 1, 000 or so sites were run through by gatherer component. • For third crawl, all sites (18, 500) were processed by gatherer • For fourth crawl, several tasks were performed: n n 20, 000 sites were processed by gatherer In mid-May, the same 1000 sites were processed 28 times (about 4 times per day) from May 7 to May 13
Data analysis setup n Canary. Callback data analysis • Main choice for parsing data was Python scripting language n Too much data for MS Access or even My. SQL • Python scripts were developed to facilitate analysis in manner similar to SQL n n Scripts to aggregate data sets and frequencies Scripts to calculate various metrics of data sets, such as: • • • n Smallest data point Largest data point Average data point Variance of data point Total data points Sum of data points Scripts to output to file in Excel spreadsheet (CSV) for deeper analysis
Individual data analysis Third quarter and last half of second quarter were spent focusing on as wide a range of data as possible n To accomplish this, our group split up and pursued a different line of research individually n Individual presentations will follow: n • Eyal: Activity categorization • Benson: Integer argument trend analysis • Kamron: Byte string argument trend analysis
Activity Categorization
Activity Analysis There is an obvious connection between a function and the site using it n Is it possible to quantify this relationship, and establish whether certain functions are used in a specific kind of site? n • Characterize a site based on how active it is; i. e, how many function calls are made while the site is loaded • Does there exist a pattern in the data that will be able to distinguish an abnormal usage of any function based on the characteristic of the site?
Site Function Usage Statistics Total number of sites: 14848 Average function calls per site: 5777 Average function calls per function: 1984 Standard deviation of function calls per function: 25493 Standard deviation of function calls per site: 14181 Minus outliers: none Three Standard Deviations below: 0 Two Standard Deviations below: 0 One Standard Deviation below: 12086 One Standard Deviation above: 1633 Two Standard Deviations above: 510 Three Standard Deviations above: 296 Normal distribution outliers: 323 Median: 1456 First quartile: 438 Third quartile: 4029 Interquartile range: 3591 Minus outliers: none Lower whisker starts at: 0 Upper whisker ends at: 9365 “Box and whisker” outliers: 2048
Correlation analysis Related each function to the site calling it using the number of function calls on that site n • Each tuple consisted of the number of times a function was called at a particular site, and the number of total function calls that were made at that site The correlation between the variables in the tuple was made for each individual function n Many functions were not common, and so not enough data was available to make a conclusion about them n For the functions that had enough (over 100) sites that called them, the correlation values were between. 004 and -. 01, showing no correlation between the function and the script activity of the site calling it n
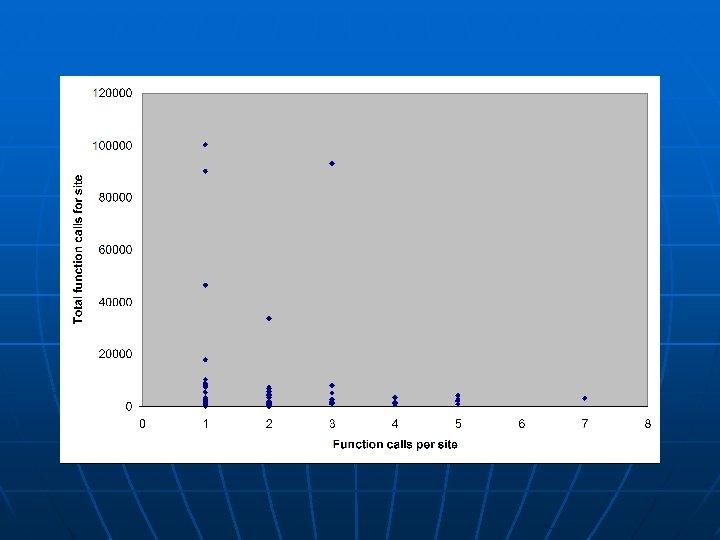
Function Usage Amount An interesting trend arose when analyzing the correlation data n • There are functions that are called hundreds/thousands of times • Despite this, sites seem to call a specific function only a couple times. n Example: • GUID 3050 f 3 fd-98 b 5 -11 cf-bb 82 -00 aa 00 bdec 0 b, DISPID 1 • Called 346 times, only in 11 sites is it called more than 3 times (3. 2%)
Categorization Approach Since no correlation was found, another approach was taken n • According to trends in the script activity data, divide the sites into distinct categories • Examine the function behavior in each category, as opposed to individual sites Three categories were chosen, roughly along the median and the end of the third quartile n • This gave one category 50% of the data, while the other two had 25% of the data n An attempt to avoid bias toward the extremely script-heavy sites
Categorization Heuristic A heuristic was developed to determine whether a function would be more likely to appear in a certain category n F =((avgl - avgsite)*(L - avgfunc)+(avgm - avgsite)*(M - avgfunc)+(avgh - avgsite)*(H - avgfunc)) / 3 avgl, avgm, and avgh are the average number of function calls per category (542, 2882, and 22745 respectively) n avgsite is the overall average number of function calls per site (5777) n avgfunc is the avg number of function calls per function (1984). n L, M, and H are the specific number of times the function was called in the low, medium, and high category n
Statistical Variation Among Categories The heuristic separated out the functions into three distinct sections n Along the higher values were mostly functions that had few arguments supplied n In the middle, there whole objects represented (a GUID, and all of its related function calls) n At the lowest negative values were functions that were commonly called with arguments n
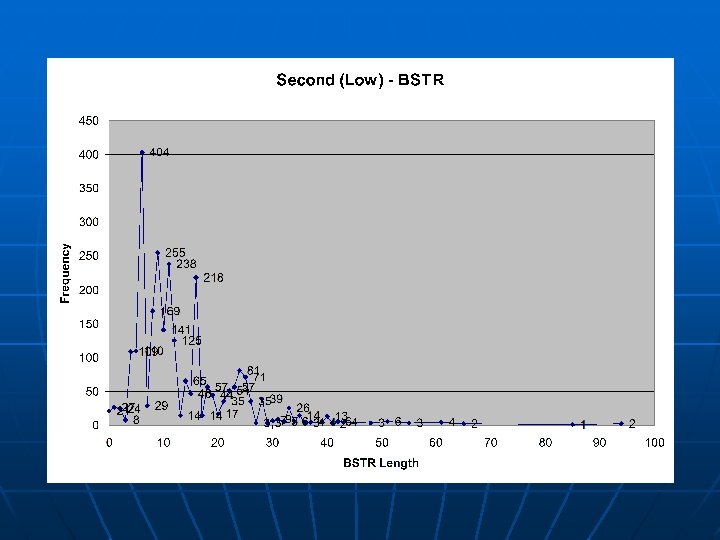
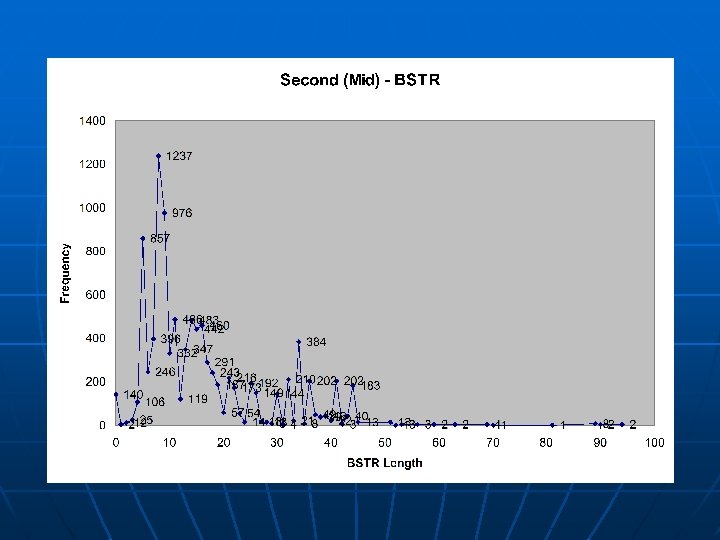
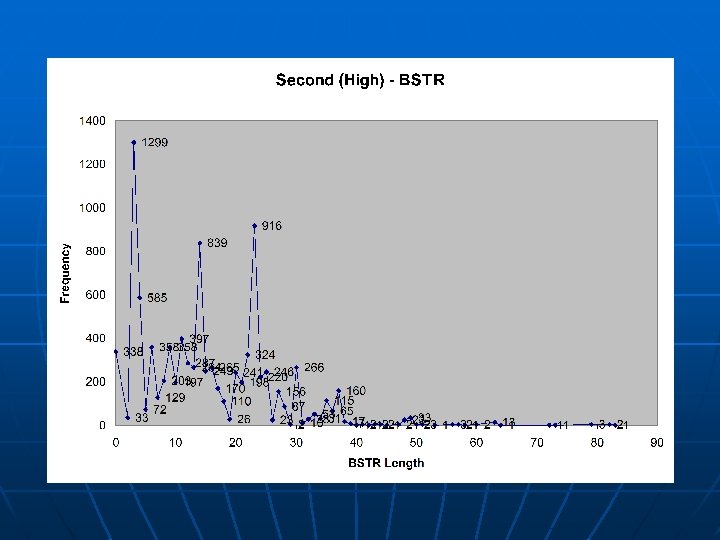
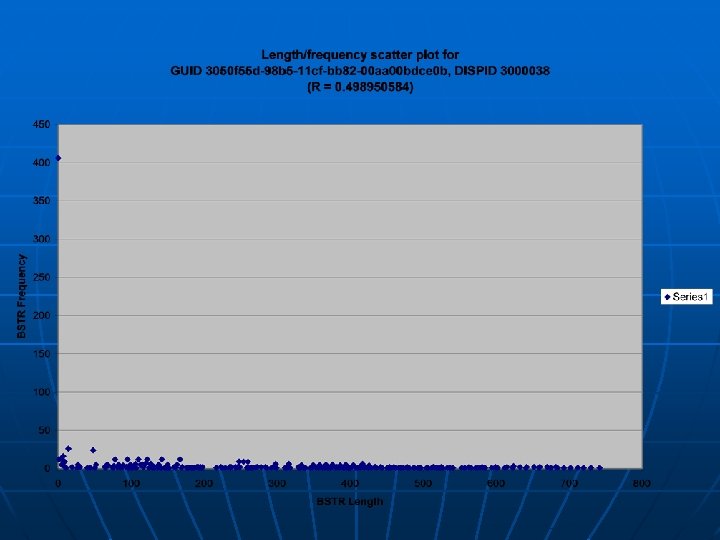
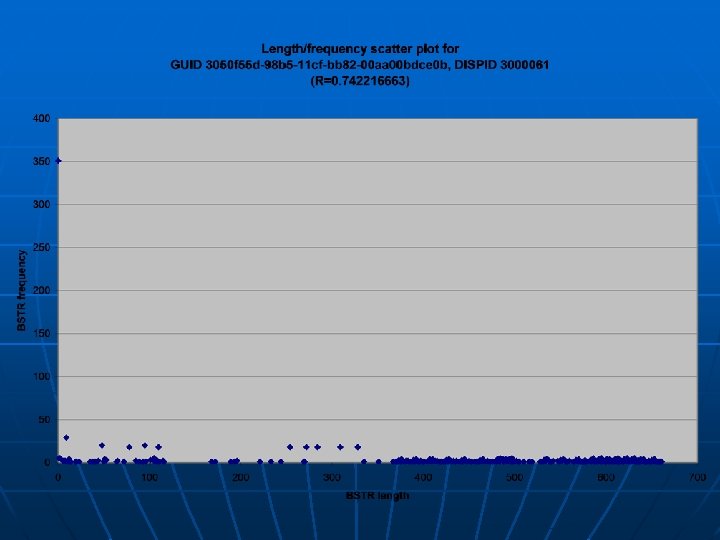
Argument Distributions A further analysis was done on whethere exists a difference in the behavior of a function in the separate categories n The distributions of BSTR (Byte String) lengths and I 4 (4 -byte Integer) values were considered n • Several functions were examined, but this specific one (referred to as “Second”, as it had the second highest heuristic value) is exemplary of the trends noticed n The argument type frequency of “Second”: LOW: 0 arguments: 20713 I 4 arguments: 0 BSTR arguments: 2634 DISPATCH arguments: 14 NULL arguments: 0 BOOL arguments: 0 MID: 0 arguments: 170861 I 4 arguments: 0 BSTR arguments: 9888 DISPATCH arguments: 1 NULL arguments: 0 BOOL arguments: 0 HIGH: 0 arguments: 1215964 I 4 arguments: 0 BSTR arguments: 9447 DISPATCH arguments: 19 NULL arguments: 0 BOOL arguments: 0
Conclusions of Approach The trend seen is that there is no major statistical difference in the argument value distribution among the categories, but there are distinct characteristic differences seen n Functions that appear more commonly in lessactive sites tend to have arguments supplied to them n No general correlation exists between functions and how active the site calling it is n • There may exist correlation in some other characteristic, however
Integer analysis
Functions through Three Sets n Looked through 3 of the runs: • 5 seeds, depth 5: • 10 seeds, depth 3: • 200 seeds, depth 1: 1, 324 sites 1, 184 sites 15, 790 sites Picked three most common functions with integer arguments of the first run to analyze n Goal: Look for consistency throughout function behavior in differing sets of sites n
Functions through Three Sets In all three data sets, the values of the argument had a very large range, from 0 to the millions or billions n Distributions did not stay consistent through sets, all had differing commonly occurring values n
Functions through Three Sets n Similar pattern in all 3 sets • Low values were used • Numbers near 0 most common, occurrences drop off as values get larger
Functions through Three Sets Values range from 0 to in the hundreds n Second data set did not have enough data n Similar common numbers in both sets: 3, 300, and 728 n
Patterns in DISPID Usage Looked at what DISPIDs were used, without regard to the GUIDS of the calling classes n DISPIDs had a large range, from lows of less than -2 billion, to highs of over 3 million n Out of 743, 270 functions analyzed, The vast majority had DISPIDs within 4 distinct ranges n • 205 of the function did not fall within these groups, and instead were one of 6 other numbers Within each of the four ranges, occurrences at specific numbers formed patterns n
DISPID Usage – First Range The most common range for DISPIDs – 3, 000 -3, 001, 286 490, 201 functions, about 66% n 1, 067 out of 1, 286 different numbers used n Numbers nearer to 3 million are most common, higher numbers were used less n Number range: Average Occurrences: 3, 000 -3, 000, 199 1, 121 3, 000, 200 -3, 000, 399 737 3, 000, 400 -3, 000, 599 471 3, 000, 600 -3, 000, 799 121 3, 000, 800+ 1
DISPID Usage – Second Range Second common range for DISPIDs – 0 -2, 313 164, 224 functions, about 22% n 39 numbers in this range were used n 0 and 1, 103 were the most common n Numbers clumped around 5 groups: 0 -9, 127 -154, 1002 -1168, 15001504, and 2001 -2015, with 2313 being an exception n
DISPID Usage – Third Range Third range for DISPIDs – -2, 147, 417, 109 to -2, 147, 411, 105 n n n 50, 541 functions, about 7% 55 numbers in this range used Most occurrences were around numbers ending in round thousands
DISPID Usage – Fourth Range Fourth range for DISPIDs – 10, 001 -10, 087 n n 38, 099 functions, about 5% 75 numbers out of the range were used Uniquely used by 3050 f 55 d-98 b 5 -11 cf-bb 82 -00 aa 00 bdce 0 b DISPIDs 10, 001 -10, 007 are most common
Patterns in DISPID Usage Looked at what DISPIDs were used, without regard to the GUIDS of the calling classes n DISPIDs had a large range, from lows of less than -2 billion, to highs of over 3 million n Out of 743, 270 functions analyzed, The vast majority had DISPIDs within 4 distinct ranges n Within each of the four ranges, occurrences at specific numbers formed patterns n
Function with Multiple Integers Looked for patterns in the relations among the integer arguments of functions taking multiple arguments n Not very many functions in this category n One took two arguments, first was always 0 n One took two arguments, always the same. Arguments were all from (1, 1) to (31, 31) and (1908, 1908) to (1908) n • All came from 2 signup sites on a particular website Two took two differing arguments, could not find relation between arguments n Other functions did not have a large enough sample size n
Functions with Multiple Integers Function itself had consistent patterns in the values it took: 95% of arguments were (1, 1) or (3, 2) n No consistent relations between arguments n
Function Pairs n Examined GUID: 3050 f 55 d-98 b 5 -11 cf-bb 82 -00 aa 00 bdce 0 b DISPIDs: 10001 -10062 Out of 38, 099 occurrences, 3, 595 were followed by: n GUID: c 59 c 6 b 12 -f 6 c 1 -11 cf-8835 -00 a 0 c 911 e 8 b 2 DISPID: 0 Second function had no independent occurrences n Similar arguments: n • First function took a variety of numbers and types of arguments • Second function always took a DISPATCH argument, followed by the same arguments as the first function
Conclusions of Approach n Functions arguments through sets: • Seems to be consistent patterns in certain functions • Range, values taken, values common, value distribution n DISPID usage • 4 ranges with very few exceptions • Common subranges or distribution patterns within each range n Multiple arguments • Uncommon type of function • No noticeable relations in arguments n Function pairs • Dependent functions have clear patterns n n Function position Argument types and values • Only one example – do more exist?
Byte string analysis
Byte String Analysis Buffer overflows are a common method of exploiting a targeted system n One method: create a very long string to break boundary checking, then append shellcode at the end to inject into the assembly code n We are interested in the length of BSTR objects feeded into given functions n For any given API, what is considered a normal string length? n
Class-based analysis • Initial analyses were done on a class-by-class basis • Samples were grouped together and analyzed according to GUID • Byte strings are typically very small • More than 70% of the commonly called Javascript classes typically received byte strings of less than length 20. (39 out of 55 functions from this crawl) • Less than 10% of these ever receive a string greater than 5000 characters in length (4 out of 55 functions from this crawl).
Class-based analysis • Analysis of individual classes shows same trend toward smaller strings BSTR length Exact length At most this length 0 287 12 1423 30965 1 136 423 13 383 31348 2 20 443 14 1258 32606 3 74 517 15 221 32827 4 907 1424 16 272 33099 5 1014 2438 17 868 33967 6 12638 15076 18 185 34152 7 3865 18941 19 200 34352 8 7362 26303 20 250 34602 9 1079 27382 10 1396 28778 14450 1 42665 11 764 29542 14549 1 42666 … • However, analyzing based on classes groups byte strings of all class functions together, which results in inaccuracy and lost information
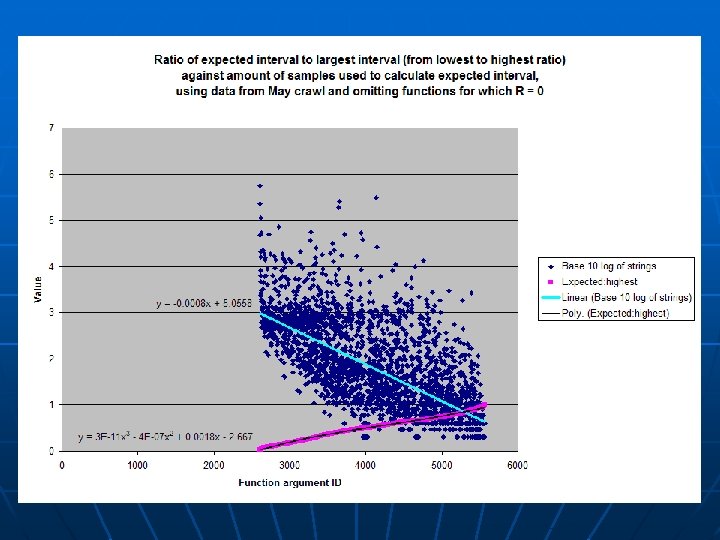
Parameter-based analysis • Second analysis split samples into individual arguments of unique functions of each class • Given a sample set with values in the interval (a, b) with average μ and standard deviation σ, we expect values to largely lie within the interval (μ – σ, μ + σ) • We also expect (μ – σ, μ + σ) to be smaller than (a, b) • The smaller (μ – σ, μ + σ) is in proportion to (a, b), the more well-defined our sample set becomes
Parameter-based analysis • Length of expected interval: 2σ • Length of entire interval: n = b – a + 1 • 2σ/n represents the ratio of the expected interval to the entire interval • Since 2σ < n, 0 < 2σ/n < 1 • When 2σ/n = 0, σ = 0 and all values in data set are equal • When 2σ/n = 1, σ = n/2 and all values in data equal either a or b • As 2σ/n goes from 0 to 1, shape of graph begins to shift
Ratio is no more than: Amount of functions: Percentage: 0. 0 2607 0. 468127132 0. 1 2753 0. 494343688 0. 2 3054 0. 548392889 0. 3 3345 0. 600646436 0. 4 3612 0. 648590411 0. 5 4029 0. 723469205 0. 6 4384 0. 78721494 0. 7 4833 0. 867839828 0. 8 5219 0. 937152092 0. 9 5435 0. 975938229 1. 0 5569 1
• When ratio is 0, amount of strings is typically low • Otherwise, ratio increases as amount of strings decreases • The function arguments with the smallest non-zero ratio are the most well-defined
Analysis with pruning Ratio is no more than: Amount of functions: Percentage: 0. 0 731 0. 248133062 0. 1 876 0. 297352342 0. 2 1177 0. 399524779 0. 3 1469 0. 498642227 0. 4 1729 0. 586897488 0. 5 2063 0. 700271555 0. 6 2355 0. 799389002 0. 7 2630 0. 892735913 0. 8 2855 0. 969110659 0. 9 2929 0. 994229464 1. 0 2946 1 • Only function arguments that see 9 or fewer strings are removed; however… • Most zero-ratio functions are pruned (2607 to 731) • Many functions with ratio > 0. 5 are pruned (1540 to 883) • Functions with ratio < 0. 5 are affected minimally (1442 to 1332)
Analysis with pruning Ratio is no more than: Amount of functions: Percentage: 0. 0 232 0. 157075152 0. 1 377 0. 255247123 0. 2 671 0. 454299255 0. 3 918 0. 621530129 0. 4 1079 0. 730534868 0. 5 1211 0. 819905213 0. 6 1307 0. 884901828 0. 7 1420 0. 96140826 0. 8 1463 0. 990521327 0. 9 1476 0. 999322952 1. 0 1477 1 • Only function arguments that see 99 or fewer strings are removed; however… • Almost all zero-ratio functions are pruned (731 to 232) • Almost all functions with ratio > 0. 5 are pruned (883 to 266) • Only some functions with ratio < 0. 5 are affected (1332 to 979)
Analysis with pruning String frequency requirement >1 > 100 Ratio = 0. 0 2607 731 232 0. 0 < Ratio < 0. 5 1422 1332 979 0. 5 < Ratio < 1. 0 1540 266 883 As a function is seen in the wild more frequently, the byte string lengths it takes in begin to fall into specific intervals. Functions with substantial evidence are well-defined in the lengths of byte strings they tend to receive!
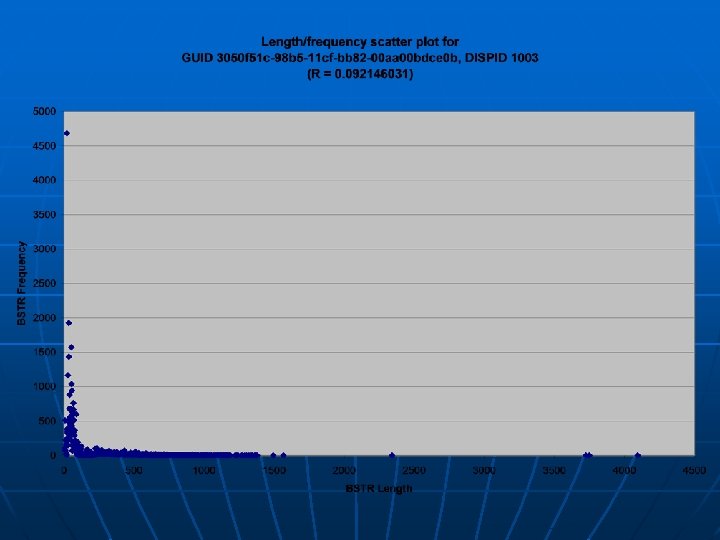
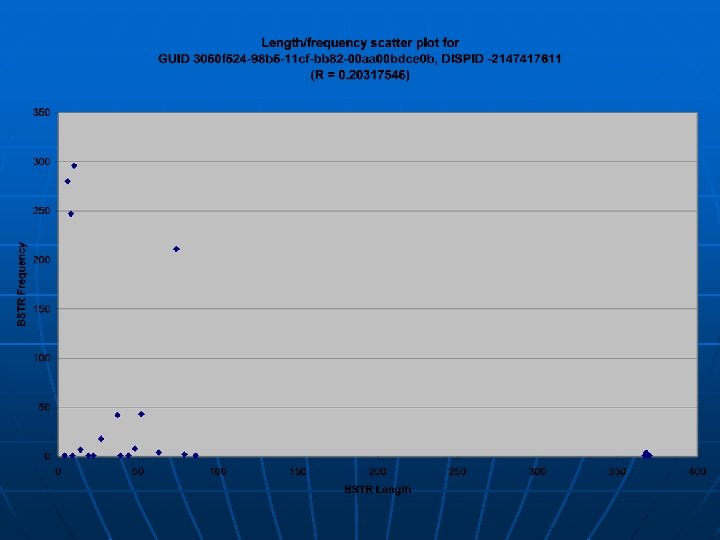
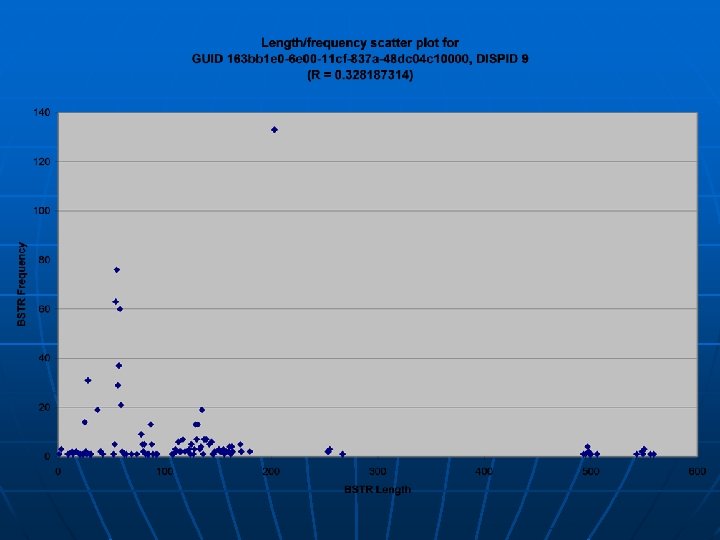
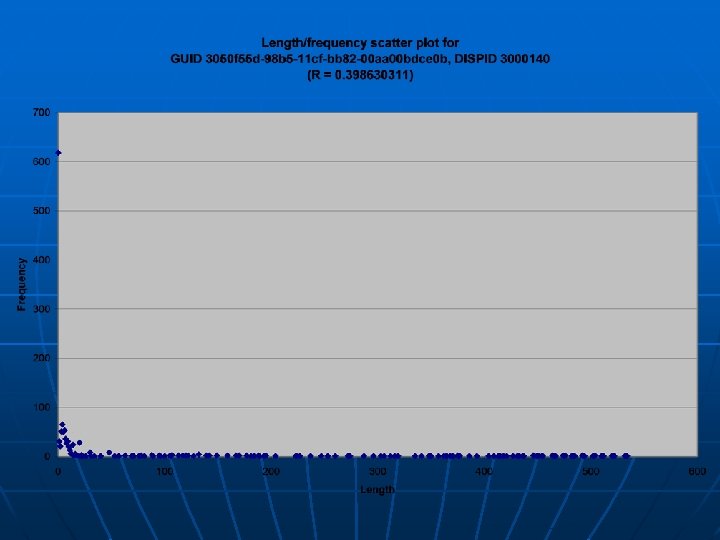
Comparing w/malicious data n Symantec provided us with test samples used for Canary testing • • n Malicious samples fell into one of three categories: • • • n n These samples trigger browser exploit but do not inject actual shellcode The worst thing they can do is crash the browser Bad BSTR Bad I 4 Bad DISPATCH (object) Example: “MSIE Popup Window Address Bar Spoofing Weakness” Callback data: DISPID GUID Params Type 1 Value 1 1026 3050 f 55 f-98 b 5 -11 cf-bb 82 -00 aa 00 bdce 0 b 1 BSTR 150 n Compare with data from May crawl: • 491 strings seen over the 20, 416 websites visited during that crawl • Smallest: 70 • Largest: 80 • Average: 76. 32 • Standard deviation: 2. 33 • Expected interval: [73. 99, 78. 65] • Entire interval [70, 80] • Length 150 is 31. 6 standard deviations away from the average length!
Trend volatility n n How does web activity change over time? 28 crawls of 1000 sites over May 7 to May 13 were performedto investigate this Run Size (KB) Size (MB) DLL calls URLs w/scripts 1 151356 147. 81 2071719 469 15 157522 153. 83 2166498 464 2 157178 153. 49 2155154 461 16 163440 159. 61 2263828 466 3 153634 150. 03 2091515 466 17 139088 135. 83 2015998 462 4 162288 158. 48 2236706 465 18 159899 156. 15 2219125 463 5 153640 150. 04 2091038 465 19 161024 157. 25 2220763 465 6 157247 153. 56 2148058 463 20 160108 156. 36 2211366 464 7 152411 148. 84 2074383 463 21 149148 145. 65 2090184 461 8 152776 149. 2 2082031 463 22 161600 157. 81 2232686 466 9 143086 139. 73 2041672 465 23 162083 158. 28 2236013 465 10 158285 154. 58 2172353 466 24 155612 151. 96 2189636 465 11 160603 156. 84 2213557 465 25 154043 150. 43 2176079 463 12 153172 149. 58 2096330 463 26 160625 156. 86 2221586 463 13 165713 161. 83 2304933 465 27 157313 153. 63 2173366 464 14 153186 149. 6 2164695 461 28 158556 154. 84 2199971 461 n n Each crawl differs by several hundred thousand DLL calls Amount of sites with actual scripts change
Trend volatility n n These runs were done ~5. 5 hrs apart Change is very slight • Zero-ratio functions increase • High-ratio functions decrease
Trend volatility n n These runs were done ~1 day apart Change is also very slight • Zero-ratio functions decrease • Mid-ratio functions (R = 0. 5) increase
Trend volatility n n These runs were done ~6 days apart Change is a little more apparent • Zero-ratio functions decrease • Mid-ratio functions (R = 0. 5) increase
Trend volatility n n n State of Javascript activity on Web is constantly changing Changes are somewhat unpredictable (and entirely dependent on decisions of webmaster) These changes in the long run are not major; however, they still exist and need to be addressed
Conclusions of Approach n n Substantial evidence in favor of existing trends for byte string arguments This approach can be adapted to anything that can be quantified as a number Changes in state of web will require any heuristic developed to have at least a basic learning capability Plan to continue research over the summer